
Via: http://hockeyschtick.blogspot.com/2014/07/updated-list-of-29-excuses-for-18-year.html
Updated list of 38 excuses for the 18 year ‘pause’ in global warming
| RSS satellite data showing the 18 year ‘pause’ of global warming |
2) Oceans ate the global warming [debunked] [debunked] [debunked]
3) Chinese coal use [debunked]
5) What ‘pause’? [debunked] [debunked] [debunked] [debunked]
6) Volcanic aerosols [debunked]
8) Faster Pacific trade winds [debunked]
10) ‘Coincidence!’
11) Pine aerosols
12) It’s “not so unusual” and “no more than natural variability”
13) “Scientists looking at the wrong ‘lousy’ data” http://
14) Cold nights getting colder in Northern Hemisphere
15) We forgot to cherry-pick models in tune with natural variability [debunked]
16) Negative phase of Interdecadal Pacific Oscillation
18) “Global brightening” has stopped
20) “It’s the hottest decade ever” Decadal averages used to hide the ‘pause’[debunked]
22) Temperature variations fall “roughly in the middle of the AR4 model results”
23) “Not scientifically relevant”
24) The wrong type of El Ninos
25) Slower trade winds [debunked]
26) The climate is less sensitive to CO2 than previously thought [see also]
27) PDO and AMO natural cycles and here
28) ENSO
35) Scientists forgot “to look at our models and observations and ask questions”
36) The models really do explain the “pause” [debunked] [debunked] [debunked]
38) Trenberth’s “missing heat” is hiding in the Atlantic, not Pacific as Trenberth claimed [debunked] [Dr. Curry’s take] [Author: “Every week there’s a new explanation of the hiatus”]
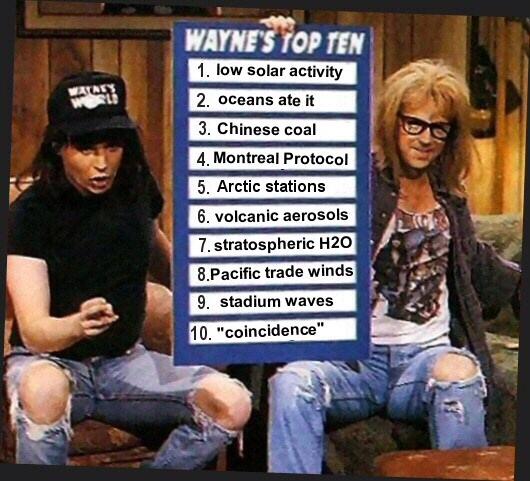 |
| An incomplete list of excuses |
UPDATE: C3 updates the Wayne’s World graphic:
Related:


One Response
I think this graph would draw less critical comment if it started in 1990.
Starting the graph just prior to the super El Nino of 1998 makes it look as if the start date has been “cherry-picked” and it is not necessary to cherry-pick to make the point. The data from 1990 to the present supports your main point.