
Load of bollocks: 2016 allegedly ‘hottest year’ by unmeasureable 1/100 of a degree – While satellites show ‘pause’ continues
Climate Depot Analysis
It’s that time of year again, the annual media ritual of declaring the previous year “the hottest ever!” And as usual, the media and many activists government scientists are playing fast and loose with the temperature data and.
Former Vice President Al Gore promoted the “hottest year” claim today. “2016 was the hottest year on record — confirmed by NASA and NOAA,” Gore tweeted. (More media hype here: CNN: 2016 was the hottest year on record — again & 2016 breaks record for hottest year ever)

But scientists seemed to yawn at the news.
Extreme Weather expert Dr. Roger Pielke Jr. noted that the media “hottest year” scare stories are simply not working. “Selling climate policy on “hottest year ever” hard because 2016 also had very low disasters & record high crop productivity. It doesn’t scare people,” Pielke wrote.

MIT climate scientist Dr. Richard Lindzen, was very blunt. (See: MIT climate scientist on ‘hottest year’: ‘The hysteria over this issue is truly bizarre’ – Warns of return ‘back to the dark ages’)
Lindzen said in an interview on Howie Carr’s radio show: “To imply that a rise of temperature of a tenth of a degree is proof that the world is coming to an end — has to take one back to the dark ages.” He added, “As long as you can get people excited as to whether it’s a tenth of a degree warmer or cooler, then you don’t have to think, you can assume everyone who is listening to you is an idiot.”
“The whole point is so crazy because the temperature is always going up or down a little. What is astonishing is that in the last 20 years it hasn’t done much of anything,” Lindzen continued.
“What they don’t mention is there has been a big El Nino in 2016 and in recent months the temperature has been dropping back into a zero trend level,” he added.
Load of bollocks: 2016 allegedly the ‘hottest year’ by 1/100 of a degree! UK Met Office: 2016 & 2015 temps the same
…Hottest year claims? Media Ignores The Satellite Record Showing No Warming Since 1998
By Paul Homewood
There must be something wrong with my old eyes, as I can’t seem to find any mention of the satellite record, which shows no such thing.
To recap, both UAH and RSS say that atmospheric temperatures for 2016 statistically tied with 1998, at just 0.02C higher.
Neither 2014 or 2015 were anywhere near being a record.

http://www.nsstc.uah.edu/climate/

Satellite measurements of global temperatures are regarded as much more comprehensive, accurate and unaffected by UHI, as Roy Spencer explained in 2014.
The BBC shows the map provided by NOAA, with lots of red on it to convince us how hot it has been.

However, if they were more honest, they might have showed the Land-Only map, which underlines the fact that most of the world’s land mass has no thermometer coverage at all.

http://www.bbc.co.uk/news/science-environment-38652746
Of course, there might be good reasons why the satellite record has diverged from the surface data in recent years, but is it not the job of the BBC to provide us with all the facts, and not just the ones that suit its political agenda?
…There’s Still Less Warming Than Climate Models Predicted, Despite 2016’s Claimed ‘Record Warmth’
By Michael Bastasch
Right now, the world is about as warm as half the models predicted, but, remember, global surface temperatures were driven up a strong El Nino.
Climate scientist Zeke Hausfather compared the global average temperature record to climate model predictions. 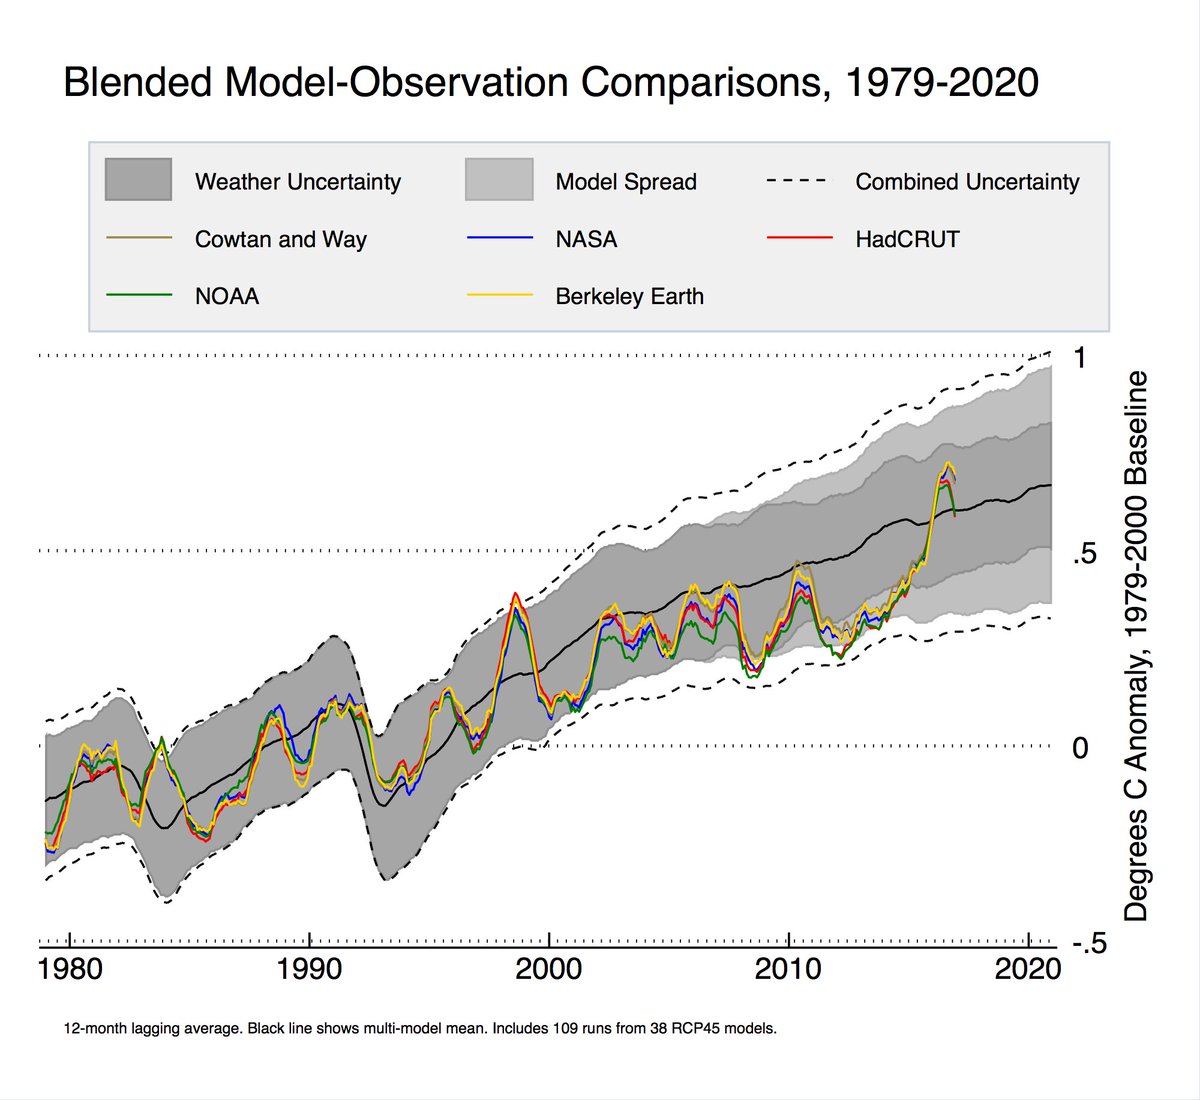
Climate models have consistently over-predicted global warming over longer periods.
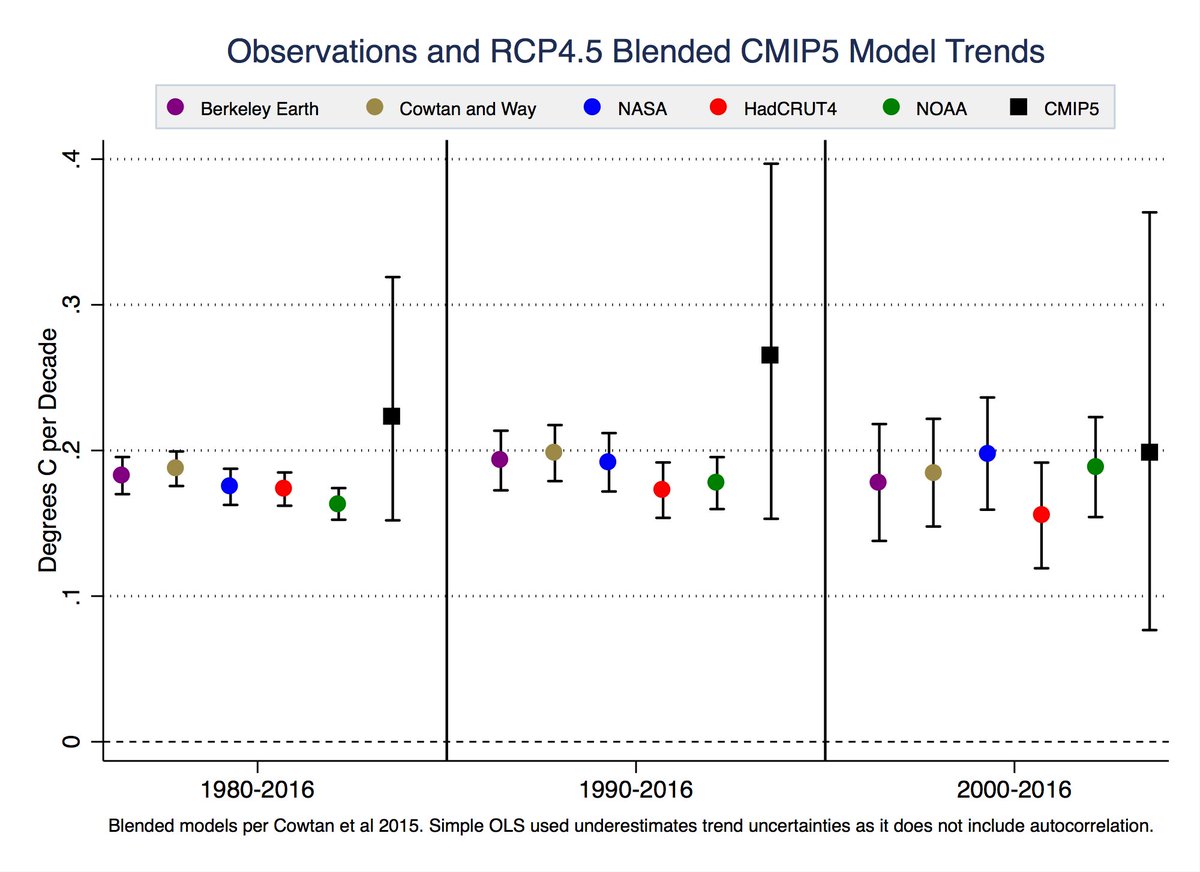
“Bottom line (which remains unchanged by the 2016 global temperatures) … climate models continue to look like they produce too much warming,” Chip Knappenberger, a climate scientist with the libertarian Cato Institute, wrote in an email to The Daily Caller News Foundation.
“It took a near record strong El Nino event (i.e. natural warming event) to do this, and already, as the El Nino Fades the global temperatures are headed back to the lower-half of climate model projections,” he wrote to TheDCNF.…
There is no ‘canonical’ global mean temp: NASA’s temp trends are ‘almost 20 times larger than the satellites’
By Dr. Lubos Motl
Excerpts:
The growing discrepancy between the satellites and the terrestrial measurements could be naively interpreted as bad news for science – there has to be some big mistake at least in one class of these measurements. But this conclusion isn’t really right. Their different stories about the global mean temperature probably aren’t due to a “mistake” but due to their different definition of the global mean temperature. The terrestrially measured temperature is increasing at this rate approximately 2 °C per century while the rate is less than 1.5 °C – and, according some proxies, even much smaller than that – according to the satellites. That’s not a contradiction because they mean different quantities by the “global mean temperature”.
There is no “canonical” global mean temperature. It’s an artificial quantity whose detailed value – and whose detailed change in 18 or 100 years – significantly depends on all the details about how the global mean temperature is defined and measured. I’ve mentioned that 2016 was 0.02 °C warmer than 1998 by satellites but by 0.36 °C warmer than 1998 according to the terrestrial measurements. You may pretty much say that the difference of the annual global mean temperatures in 2016 and 1998 was 0.19 °C plus minus 0.17 °C. It’s still pretty much compatible with the zero at the one-sigma level.
…
The GISS temperature anomaly for 2016 was 0.99 °C, about 0.13 °C warmer than the anomaly in 2015. It’s a significant increase but the increase between 1997 and 1998 was larger still, 0.15 °C. According to GISS, the temperature in 2016 was 0.36 °C warmer than in 1998. You may see that the ratio is almost exactly 0.02 °C per year or 2 °C per century. This deduced trend is almost 20 times larger than that from the satellites but even if we trusted the linear extrapolation, it would still be far from a tragedy if the temperature in 2116 were 2 °C warmer than in 2016.…
EL NINO WARMING DOES NOT MEAN THE END OF THE ‘PAUSE’
The death of the global warming ‘pause’ has been greatly exaggerated

The global warming ‘pause’ never existed, say the headlines. It’s a claim that has been made before, only to be refuted, yet now it’s back again. If there is one topic that sends a small subset of climate scientists’ temperature into the stratosphere, it’s the topic of the global warming ‘pause’ or ‘hiatus’. This is the idea that global surface temperatures haven’t changed much for almost 20 years. Never in my experience of science have I come across a topic like it, and that’s because it means nothing, and everything.
Global warming is about energy imbalance. Greenhouse gasses stop heat leaving the earth, so the planet is getting warmer. This is fundamental physics. Temperature goes up; oceans warm up, expand and sea level rises; pole caps melt. The world has certainly warmed up: 2001 to 2010 was the warmest decade for which we have reliable measurements. Global temperatures are over one degree C above pre-industrial levels and the Intergovernmental Panel on Climate Change says most of the temperature rise since the 1950s is due to mankind.
But around 2007 it began to be noticed by so-called sceptics (usually scientists from other fields) that for a few years, global temperatures had not gone up. Perhaps the climate situation was more complicated than was first thought. They were of course lambasted, called deniers for just saying ‘look at this graph’. But the ‘pause’ or ‘hiatus’ or whatever it was called didn’t go away, at least until 2015, when the natural temperature spike that is El Nino started – a Pacific-based emergence of hot water that affects the entire globe for a year or two.
It would be fair to say that most climate scientists think the ‘hiatus’ exists and is a fascinating phenomenon that deserves study. There have been hundreds of research papers about it and over 30 explanations proffered. These range from ones focussed on heat going into the ocean, to ones which focus on the sun, or the stratosphere or even an unknown effect. The hiatus showed the importance of natural climate variability being, possibly for a while, stronger than long-term global warming. But some wouldn’t have it. The ‘pause’ had to be destroyed. That’s fair enough, but they need to make a case.
The latest evidence has just cropped …
Two satellite datasets agree: The Pause lives on: ‘No warming for the last 18 years’
By Paul Homewood

RSS have also now released their temperature data for December, which, as with UAH, shows a big drop from the month before.
Annually, RSS come to the same conclusion as UAH, that 2016 was 0.02C warmer than 1998.

As Roy Spencer has pointed out, the margin of error is 0.1C, so statistically 2016 is tied with 1998 as the warmest year in the satellite record.
The fact that there has been no warming for the last 18 years is a massive blow to the credibility of climate science.…
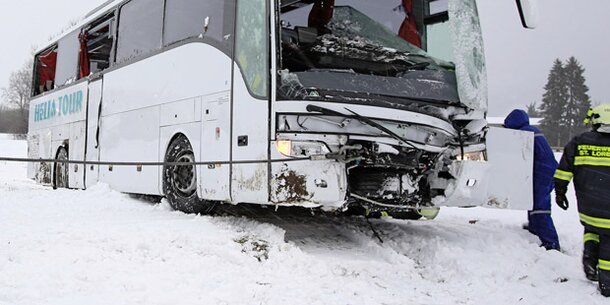
Record cold and snow spread globally
Record cold and snow have descended upon the planet this Winter and even in the summer in some places. The cold is spreading as the latest satellite data reveals that despite a huge El Nino, global temperatures are not statistically warmer than 1998. The global warming “pause” continues. See: Death Of Global Temperature ‘Pause’ Greatly Exaggerated – 2016 Not Statistically Warmer Than 1998 & Despite new claims, global warming temperature pause ‘still going strong’ & The Pause Lives on: Global Satellites: 2016 not Statistically Warmer than 1998 Round up of global record cold and snow Via: https://www.iceagenow.info/ Record cold, then freezing rain in Portland metro New cold record set in Finland
California – 6½ feet of snow in 72 hours – Homewood ski area has received 79 inches (200 cm) of snow in the past 72 hours. Continue reading California – 6½ feet of snow in 72 hours Ten to fifteen feet of snow for California Austria – “Winter is returning – and how!”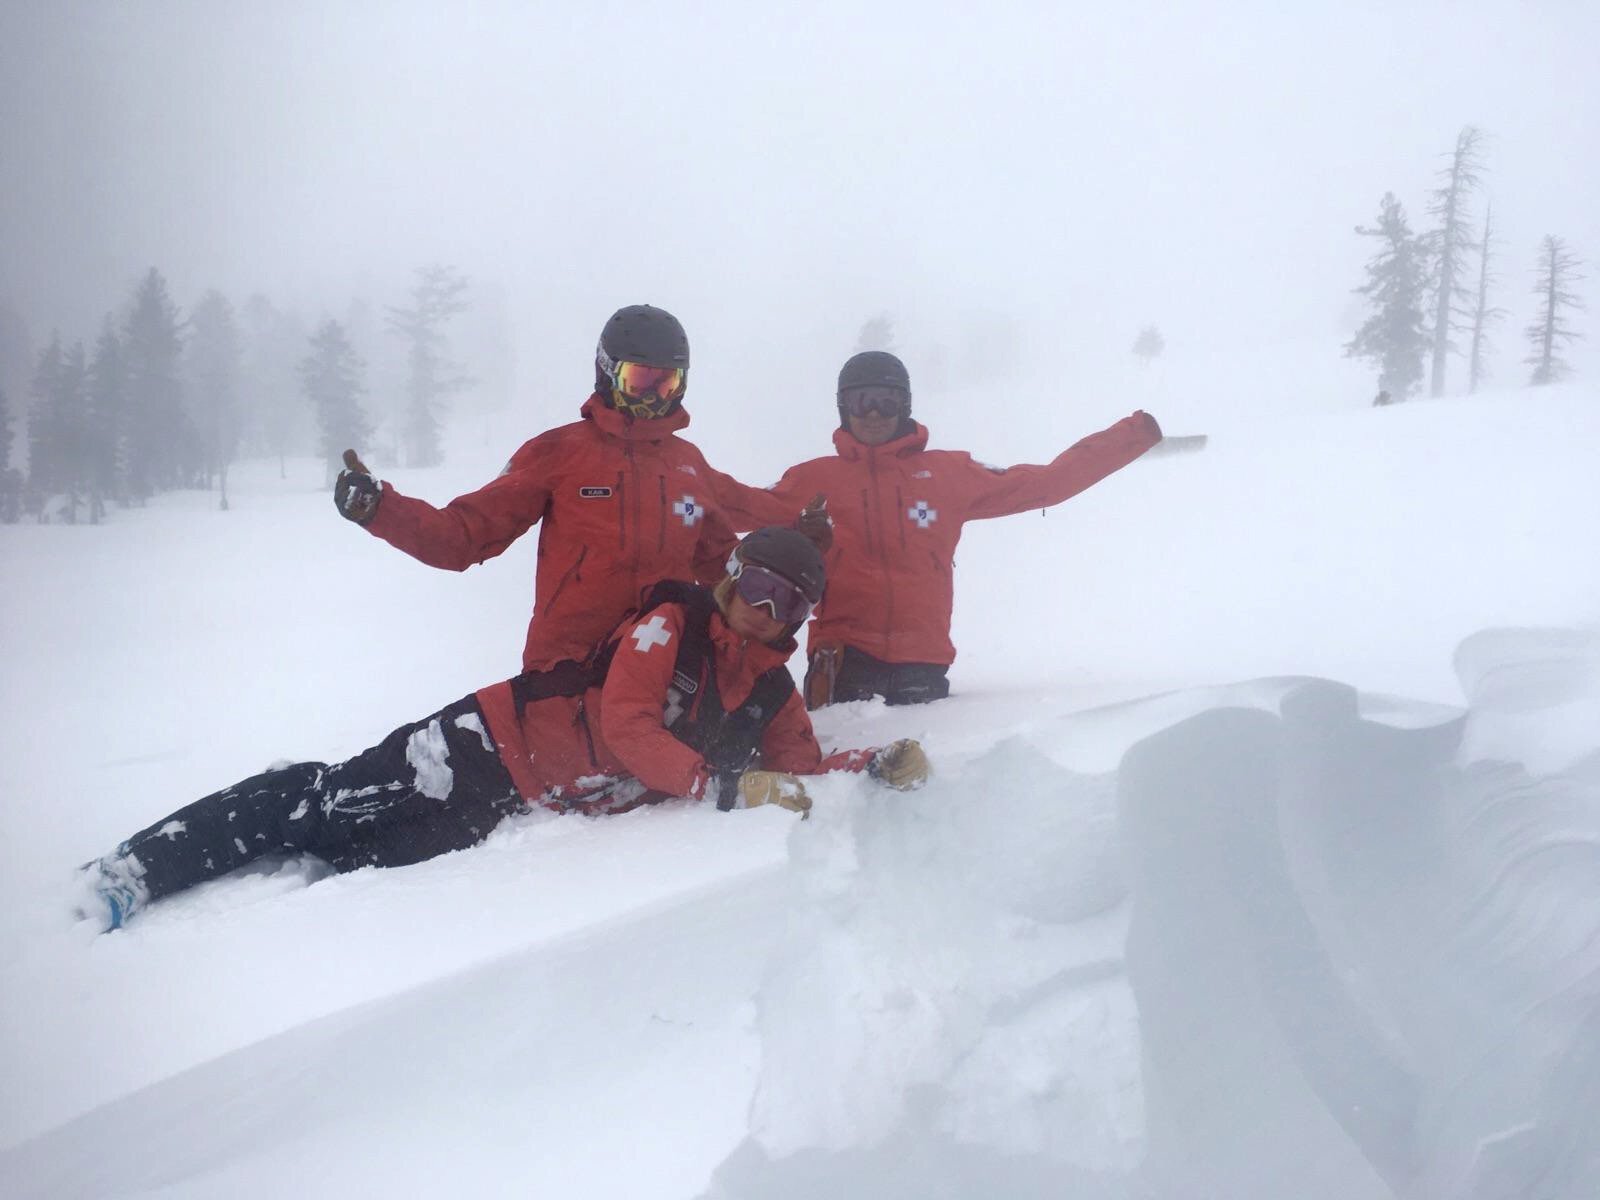
Far colder than normal in Russia

Snowing in New Zealand – In high summer
Death Of Global Temperature ‘Pause’ Greatly Exaggerated – 2016 Not Statistically Warmer Than 1998
|
|||
 Any estimate of temperature trends that have their endpoint on the uptick of the El Nino curve will give a misleadingly high trend. It is obvious that a better trend will be obtained after the natural El Nino has ended. Likewise care must be taken if the start point is near the La Nina years of 1999-2000. The temperature trends of the oceans estimated by the new paper fall into this trap. – Dr David Whitehouse, The GWPF Observatory, 5 January 2016 1) Death Of Global Temperature ‘Pause’ Greatly Exaggerated 2) 2016 Not Statistically Warmer Than 1998, Satellites Data Shows 3) North Atlantic Ocean Cooling Rapidly 4) “Hottest Year Evah”: A Reality Check 5) Judith Curry Retires, Citing ‘Craziness’ Of Climate Debate 6) Friends Of The Earth Promise: We Will Never Again Spread Misleading Anti-Fracking Scares 7) Stephen Moore: 2016’s Biggest Loser – The Green Blob
Strong December cooling leads to 2016 being statistically indistinguishable from 1998. —Dr Roy Spencer, 3 January 2017 While it has understandably not received much, if any, media attention, the North Atlantic Ocean has been rapidly cooling since the mid-2000s, or for more than 10 years now. The longer the cooling trend continues — and scientists are projecting more cooling for the coming decades — the more difficult it will be to ignore. The North Atlantic Ocean is, after all, a key trend-setter for hemispheric- and perhaps even global-scale climate changes. –Kenneth Richard, NoTricksZone, 5 January 2017 Supposedly 2016 was the banner year for global warming. So what has it brought? Arctic sea ice extent finishes the year at the level of the last few years. Northern Hemisphere snow extent was at the second highest on record this autumn. Greenland’s ice sheet has been growing at a phenomenal rate. Hurricane activity for the last 12 months has been normal. The US tornado season has been one of the quietest on record. US wildfires have been below the 10-year average. |

Despite new claims, global warming temperature pause ‘still going strong’
According to a new study, the rate of ocean warming for the past 19 years was rising nearly twice as fast than originally measured, but land temps still show a global warming pause. Previously, sea surface temperatures (SSTs) were rising at 0.07C per decade, but the new paper shows it’s actually .12C. But the new paper has flaws being glossed over by mainstream #News outlets to push the #Climate Change narrative. The study was published in #Science Advances and is open to the public.
First, the study only looked at ocean temperatures, not land, and didn’t include the year 2016, a markedly cooler year in the latter half. Even the U.N. Intergovernmental Panel on Climate Change (IPCC) said there was no discernible warming since 2000 in its 2013 report. They wrote that global temperatures showed a “much smaller increasing linear trend over the past 15 years than over the past 30 to 60 years.”

Yet another study tries to erase “the pause” – but is missing a whole year of data http://wattsupwiththat.com/2017/01/04/yet-another-study-tries-to-erase-the-pause-but-is-missing-a-whole-year-of-data …
How they did it
In this new study led by Zeke Hausfather, they homogenized buoy, satellite, and ARGO buoy records to come up with mean ocean temperatures. The authors believe that ocean temperatures have been “underestimated” for the past 20 years because ocean buoys record slightly colder sea temperatures when compared to how they were measured last century; seawater would flow into a ship’s intake systems and a temperature reading would be taken.
But by ending the study on an El Nino year, estimating temperature trends that begin and end on an “El Nino curve will give a misleadingly high trend.” That’s according to a statement by Dr. David Whitehouse of the Global Warming Policy Forum think-tank. He notes that researchers need to be careful when estimating temperature trends with rigid start and end dates. Adding or removing even a year or two can produce dramatically different results. Which is what happened here.

Latest GWPF Newsletter: Death Of Global Temperature ‘Pause’ Greatly Exaggerated – http://eepurl.com/cwknnr

No, the pause isn’t over
Because the …