
No global warming at all for 18 years 8 months
By Christopher Monckton of Brenchley
The Paris agreement is more dangerous than it appears. Though the secession clause that this column has argued for was inserted into the second draft and remained in the final text, the zombies who have replaced the diplomatic negotiators of almost 200 nations did not – as they should have done in a rational world – insert a sunset clause that would bring the entire costly and pointless process to an end once the observed rate of warming fell far enough below the IPCC’s original predictions in 1990.
It is those first predictions that matter, for they formed the official basis for the climate scam – the biggest transfer of wealth in human history from the poor to the rich, from the little guy to the big guy, from the governed to those who profit by governing them.
Let us hope that the next President of the United States insists on a sunset clause. I propose that if 20 years without global warming occur, the IPCC, the UNFCCC and all their works should be swept into the dustbin of history, and the prosecutors should be brought in. We are already at 18 years 8 months, and counting. The el Niño has shortened the Pause, and will continue to do so for the next few months, but the discrepancy between prediction and reality remains very wide.

Figure 1. The least-squares linear-regression trend on the RSS satellite monthly global mean surface temperature anomaly dataset shows no global warming for 18 years 8 months since May 1997, though one-third of all anthropogenic forcings have occurred during the period of the Pause.
It is worth understanding just how surprised the modelers ought to be by the persistence of the Pause. NOAA, in a very rare fit of honesty, admitted in its 2008 State of the Climatereport that 15 years or more without global warming would demonstrate a discrepancy between prediction and observation. The reason for NOAA’s statement is that there is supposed to be a sharp and significant instantaneous response to a radiative forcing such as adding CO2 to the air.
The steepness of this predicted response can be seen in Fig. 1a, which is based on a paper on temperature feedbacks by Professor Richard Lindzen’s former student Professor Gerard Roe in 2009. The graph of Roe’s model output shows that the initial expected response to a forcing is supposed to be an immediate and rapid warming. But, despite the very substantial forcings in the 18 years 8 months since May 1997, not a flicker of warming has resulted.

Figure 1a: Models predict rapid initial warming in response to a forcing. Instead, no warming at all is occurring. Based on Roe (2009).
The current el Niño, as Bob Tisdale’s distinguished series of reports here demonstrates, is at least as big as the Great el Niño of 1998. The RSS temperature record is now beginning to reflect its magnitude. If past events of this kind are a guide, there will be several months’ further warming before the downturn in the spike begins.
However, if there is a following la Niña, as there often is, the Pause may return at some time from the end of this year onward.
The hiatus period of 18 years 8 months is the farthest back one can go in the RSS satellite temperature record and still show a sub-zero trend. The start date is not cherry-picked: it is calculated. And the graph does not mean there is no such thing as global warming. Going back further shows a small warming rate. The rate on the RSS dataset since it began in 1979 is equivalent to 1.2 degrees/century.
And yes, the start-date for the Pause has been inching forward, though just a little more slowly than the end-date, which is why the Pause has continued on average to lengthen.
The UAH satellite dataset shows a Pause almost as long as the RSS dataset. However, the much-altered surface tamperature datasets show a small warming rate (Fig. 1b).

Figure 1b. The least-squares linear-regression trend on the mean of the GISS, HadCRUT4 and NCDC terrestrial monthly global mean surface temperature anomaly datasets shows global warming at a rate equivalent to 1.1 C° per century during the period of the Pause from May 1997 to September 2015.
Bearing in mind that one-third of the 2.4 W m–2 radiative forcing from all manmade sources since 1750 has occurred during the period of the Pause, a warming rate equivalent to little more than 1 C°/century (even if it had occurred) would not be cause for concern.
As always, a note of caution. Merely because there has been little or no warming in recent decades, one may not draw the conclusion that warming has ended forever. The trend lines measure what has occurred: they do not predict what will occur.
The Pause – politically useful though it may be to all who wish that the “official” scientific community would remember its duty of skepticism – is far less important than the growing discrepancy between the predictions of the general-circulation models and observed reality.
The divergence between the models’ predictions in 1990 (Fig. 2) and 2005 (Fig. 3), on the one hand, and the observed outturn, on the other, continues to widen. If the Pause lengthens just a little more, the rate of warming in the quarter-century since the IPCC’sFirst Assessment Report in 1990 will fall below 1 C°/century equivalent.

Figure 2. Near-term projections of warming at a rate equivalent to 2.8 [1.9, 4.2] K/century, made with “substantial confidence” in IPCC (1990), for the 311 months January 1990 to November 2015 (orange region and red trend line), vs. observed anomalies (dark blue) and trend (bright blue) at just 1 K/century equivalent, taken as the mean of the RSS and UAH v.6 satellite monthly mean lower-troposphere temperature anomalies.

Figure 3. Predicted temperature change, January 2005 to September 2015, at a rate equivalent to 1.7 [1.0, 2.3] Cº/century (orange zone with thick red best-estimate trend line), compared with the near-zero observed anomalies (dark blue) and real-world trend (bright blue), taken as the mean of the RSS and UAH v.6 satellite lower-troposphere temperature anomalies.
The Technical Note explains the sources of the IPCC’s predictions in 1990 and in 2005, and also demonstrates that that according to the ARGO bathythermograph data the oceans are warming at a rate equivalent to less than a quarter of a Celsius degree per century. In a rational scientific discourse, those who had advocated extreme measures to prevent global warming would now be withdrawing and calmly rethinking their hypotheses. However, this is not a rational scientific discourse.
Key facts about global temperature
These facts should be shown to anyone who persists in believing that, in the words of Mr Obama’s Twitteratus, “global warming is real, manmade and dangerous”.
Ø The RSS satellite dataset shows no global warming at all for 224 months from May 1997 to December 2015 – more than half the 444-month satellite record.
Ø There has been no warming even though one-third of all anthropogenic forcings since 1750 have occurred since 1997.
Ø The entire UAH dataset for the 444 months (37 full years) from December 1978 to November 2015 shows global warming at an unalarming rate equivalent to just 1.14 Cº per century.

Ø Since 1950, when a human influence on global temperature first became theoretically possible, the global warming trend has been equivalent to below 1.2 Cº per century.
Ø The global warming trend since 1900 is equivalent to 0.75 Cº per century. This is well within natural variability and may not have much to do with us.
Ø The fastest warming rate lasting 15 years or more since 1950 occurred over the 33 years from 1974 to 2006. It was equivalent to 2.0 Cº per century.
Ø Compare the warming on the Central England temperature dataset in the 40 years 1694-1733, well before the Industrial Revolution, equivalent to 4.33 C°/century.
Ø In 1990, the IPCC’s mid-range prediction of near-term warming was equivalent to 2.8 Cº per century, higher by two-thirds than its current prediction of 1.7 Cº/century.
Ø The warming trend since 1990, when the IPCC wrote its first report, is equivalent to little more than 1 Cº per century. The IPCC had predicted close to thrice as much.
Ø To meet the IPCC’s original central prediction of 1 C° warming from 1990-2025, in the next decade a warming of 0.75 C°, equivalent to 7.5 C°/century, would have to occur.
Ø Though the IPCC has cut its near-term warming prediction, it has not cut its high-end business as usual centennial warming prediction of 4.8 Cº warming to 2100.
Ø The IPCC’s predicted 4.8 Cº warming by 2100 is well over twice the greatest rate of warming lasting more than 15 years that has been measured since 1950.
Ø The IPCC’s 4.8 Cº-by-2100 prediction is four times the observed real-world warming trend since we might in theory have begun influencing it in 1950.
Ø The oceans, according to the 3600+ ARGO buoys, are warming at a rate of just 0.02 Cº per decade, equivalent to 0.23 Cº per century, or 1 C° in 430 years.
Ø Recent extreme-weather events cannot be blamed on global warming, because there has not been any global warming to speak of. It is as simple as that.
Technical note
Our latest topical graph shows the least-squares linear-regression trend on the RSS satellite monthly global mean lower-troposphere dataset for as far back as it is possible to go and still find a zero trend. The start-date is not “cherry-picked” so as to coincide with the temperature spike caused by the 1998 el Niño. Instead, it is calculated so as to find the longest period with a zero trend.
The fact of a long Pause is an indication of the widening discrepancy between prediction and reality in the temperature record.
The satellite datasets are arguably less unreliable than other datasets in that they show the 1998 Great El Niño more clearly than all other datasets. The Great el Niño, like its two predecessors in the past 300 years, caused widespread global coral bleaching, providing an independent verification that the satellite datasets are better able than the rest to capture such fluctuations without artificially filtering them out.
Terrestrial temperatures are measured by thermometers. Thermometers correctly sited in rural areas away from manmade heat sources show warming rates below those that are published. The satellite datasets are based on reference measurements made by the most accurate thermometers available – platinum resistance thermometers, which provide an independent verification of the temperature measurements by checking via spaceward mirrors the known temperature of the cosmic background radiation, which is 1% of the freezing point of water, or just 2.73 degrees above absolute zero. It was by measuring minuscule variations in the cosmic background radiation that the NASA anisotropy probe determined the age of the Universe as 13.82 billion years.
The RSS graph (Fig. 1) is accurate. The data are lifted monthly straight from the RSS website. A computer algorithm reads them down from the text file and plots them automatically using an advanced routine that automatically adjusts the aspect ratio of the data window at both axes so as to show the data at maximum scale, for clarity.
The latest monthly data point is visually inspected to ensure that it has been correctly positioned. The light blue trend line plotted across the dark blue spline-curve that shows the actual data is determined by the method of least-squares linear regression, which calculates the y-intercept and slope of the line.
The IPCC and most other agencies use linear regression to determine global temperature trends. Professor Phil Jones of the University of East Anglia recommends it in one of the Climategate emails. The method is appropriate because global temperature records exhibit little auto-regression, since summer temperatures in one hemisphere are compensated by winter in the other. Therefore, an AR(n) model would generate results little different from a least-squares trend.
Dr Stephen Farish, Professor of Epidemiological Statistics at the University of Melbourne, kindly verified the reliability of the algorithm that determines the trend on the graph and the correlation coefficient, which is very low because, though the data are highly variable, the trend is flat.
RSS itself is now taking a serious interest in the length of the Great Pause. Dr Carl Mears, the senior research scientist at RSS, discusses it at remss.com/blog/recent-slowing-rise-global-temperatures.
Dr Mears’ results are summarized in Fig. T1:

Figure T1. Output of 33 IPCC models (turquoise) compared with measured RSS global temperature change (black), 1979-2014. The transient coolings caused by the volcanic eruptions of Chichón (1983) and Pinatubo (1991) are shown, as is the spike in warming caused by the great el Niño of 1998.
Dr Mears writes:
“The denialists like to assume that the cause for the model/observation discrepancy is some kind of problem with the fundamental model physics, and they pooh-pooh any other sort of explanation. This leads them to conclude, very likely erroneously, that the long-term sensitivity of the climate is much less than is currently thought.”
Dr Mears concedes the growing discrepancy between the RSS data and the models, but he alleges “cherry-picking” of the start-date for the global-temperature graph:
“Recently, a number of articles in the mainstream press have pointed out that there appears to have been little or no change in globally averaged temperature over the last two decades. Because of this, we are getting a lot of questions along the lines of ‘I saw this plot on a denialist web site. Is this really your data?’ While some of these reports have ‘cherry-picked’ their end points to make their evidence seem even stronger, there is not much doubt that the rate of warming since the late 1990s is less than that predicted by most of the IPCC AR5 simulations of historical climate. … The denialists really like to fit trends starting in 1997, so that the huge 1997-98 ENSO event is at the start of their time series, resulting in a linear fit with the smallest possible slope.”
In fact, the spike in temperatures caused by the Great el Niño of 1998 is almost entirely offset in the linear-trend calculation by two factors: the not dissimilar spike of the 2010 el Niño, and the sheer length of the Great Pause itself. The headline graph in these monthly reports begins in 1997 because that is as far back as one can go in the data and still obtain a zero trend.

Fig. T1a. Graphs for RSS and GISS temperatures starting both in 1997 and in 2001. For each dataset the trend-lines are near-identical, showing conclusively that the argument that the Pause was caused by the 1998 el Nino is false (Werner Brozek and Professor Brown worked out this neat demonstration).
Curiously, Dr Mears prefers the terrestrial datasets to the satellite datasets. The UK Met Office, however, uses the satellite data to calibrate its own terrestrial record.
The length of the Pause, significant though it now is, is of less importance than the ever-growing discrepancy between the temperature trends predicted by models and the far less exciting real-world temperature change that has been observed.
Sources of the IPCC projections in Figs. 2 and 3
IPCC’s First Assessment Report predicted that global temperature would rise by 1.0 [0.7, 1.5] Cº to 2025, equivalent to 2.8 [1.9, 4.2] Cº per century. The executive summary asked, “How much confidence do we have in our predictions?” IPCC pointed out some uncertainties (clouds, oceans, etc.), but concluded:
“Nevertheless, … we have substantial confidence that models can predict at least the broad-scale features of climate change. … There are similarities between results from the coupled models using simple representations of the ocean and those using more sophisticated descriptions, and our understanding of such differences as do occur gives us some confidence in the results.”
That “substantial confidence” was substantial over-confidence. For the rate of global warming since 1990 – the most important of the “broad-scale features of climate change” that the models were supposed to predict – is now below half what the IPCC had then predicted.
In 1990, the IPCC said this:
“Based on current models we predict:
“under the IPCC Business-as-Usual (Scenario A) emissions of greenhouse gases, a rate of increase of global mean temperature during the next century of about 0.3 Cº per decade (with an uncertainty range of 0.2 Cº to 0.5 Cº per decade), this is greater than that seen over the past 10,000 years. This will result in a likely increase in global mean temperature of about 1 Cº above the present value by 2025 and 3 Cº before the end of the next century. The rise will not be steady because of the influence of other factors” (p. xii).
Later, the IPCC said:
“The numbers given below are based on high-resolution models, scaled to be consistent with our best estimate of global mean warming of 1.8 Cº by 2030. For values consistent with other estimates of global temperature rise, the numbers below should be reduced by 30% for the low estimate or increased by 50% for the high estimate” (p. xxiv).
The orange region in Fig. 2 represents the IPCC’s medium-term Scenario-A estimate of near-term warming, i.e. 1.0 [0.7, 1.5] K by 2025.
The IPCC’s predicted global warming over the 25 years from 1990 to the present differs little from a straight line (Fig. T2).

Figure T2. Historical warming from 1850-1990, and predicted warming from 1990-2100 on the IPCC’s “business-as-usual” Scenario A (IPCC, 1990, p. xxii).
Because this difference between a straight line and the slight uptick in the warming rate the IPCC predicted over the period 1990-2025 is so small, one can look at it another way. To reach the 1 K central estimate of warming since 1990 by 2025, there would have to be twice as much warming in the next ten years as there was in the last 25 years. That is not likely.
But is the Pause perhaps caused by the fact that CO2 emissions have not been rising anything like as fast as the IPCC’s “business-as-usual” Scenario A prediction in 1990? No: CO2 emissions have risen rather above the Scenario-A prediction (Fig. T3).

Figure T3. CO2 emissions from fossil fuels, etc., in 2012, from Le Quéré et al. (2014), plotted against the chart of “man-made carbon dioxide emissions”, in billions of tonnes of carbon per year, from IPCC (1990).
Plainly, therefore, CO2 emissions since 1990 have proven to be closer to Scenario A than to any other case, because for all the talk about CO2 emissions reduction the fact is that the rate of expansion of fossil-fuel burning in China, India, Indonesia, Brazil, etc., far outstrips the paltry reductions we have achieved in the West to date.
True, methane concentration has not risen as predicted in 1990 (Fig. T4), for methane emissions, though largely uncontrolled, are simply not rising as the models had predicted. Here, too, all of the predictions were extravagantly baseless.
The overall picture is clear. Scenario A is the emissions scenario from 1990 that is closest to the observed CO2 emissions outturn.

Figure T4. Methane concentration as predicted in four IPCC Assessment Reports, together with (in black) the observed outturn, which is running along the bottom of the least prediction. This graph appeared in the pre-final draft of IPCC (2013), but had mysteriously been deleted from the final, published version, inferentially because the IPCC did not want to display such a plain comparison between absurdly exaggerated predictions and unexciting reality.
To be precise, a quarter-century after 1990, the global-warming outturn to date – expressed as the least-squares linear-regression trend on the mean of the RSS and UAH monthly global mean surface temperature anomalies – is 0.27 Cº, equivalent to little more than 1 Cº/century. The IPCC’s central estimate of 0.71 Cº, equivalent to 2.8 Cº/century, that was predicted for Scenario A in IPCC (1990) with “substantial confidence” was approaching three times too big. In fact, the outturn is visibly well below even the least estimate.
In 1990, the IPCC’s central prediction of the near-term warming rate was higher by two-thirds than its prediction is today. Then it was 2.8 C/century equivalent. Now it is just 1.7 Cº equivalent – and, as Fig. T5 shows, even that is proving to be a substantial exaggeration.
Is the ocean warming?
One frequently-discussed explanation for the Great Pause is that the coupled ocean-atmosphere system has continued to accumulate heat at approximately the rate predicted by the models, but that in recent decades the heat has been removed from the atmosphere by the ocean and, since globally the near-surface strata show far less warming than the models had predicted, it is hypothesized that what is called the “missing heat” has traveled to the little-measured abyssal strata below 2000 m, whence it may emerge at some future date.
Actually, it is not known whether the ocean is warming: each of the 3600 automated ARGO bathythermograph buoys takes just three measurements a month in 200,000 cubic kilometres of ocean – roughly a 100,000-square-mile box more than 316 km square and 2 km deep. Plainly, the results on the basis of a resolution that sparse (which, as Willis Eschenbach puts it, is approximately the equivalent of trying to take a single temperature and salinity profile taken at a single point in Lake Superior less than once a year) are not going to be a lot better than guesswork.
Unfortunately ARGO seems not to have updated the ocean dataset since December 2014. However, what we have gives us 11 full years of data. Results are plotted in Fig. T5. The ocean warming, if ARGO is right, is equivalent to just 0.02 Cº decade–1, equivalent to 0.2 Cº century–1.

Figure T5. The entire near-global ARGO 2 km ocean temperature dataset from January 2004 to December 2014 (black spline-curve), with the least-squares linear-regression trend calculated from the data by the author (green arrow).
Finally, though the ARGO buoys measure ocean temperature change directly, before publication NOAA craftily converts the temperature change into zettajoules of ocean heat content change, which make the change seem a whole lot larger.
The terrifying-sounding heat content change of 260 ZJ from 1970 to 2014 (Fig. T6) is equivalent to just 0.2 K/century of global warming. All those “Hiroshima bombs of heat” of which the climate-extremist websites speak are a barely discernible pinprick. The ocean and its heat capacity are a lot bigger than some may realize.

Figure T6. Ocean heat content change, 1957-2013, in Zettajoules from NOAA’s NODC Ocean Climate Lab: http://www.nodc.noaa.gov/OC5/3M_HEAT_CONTENT, with the heat content values converted back to the ocean temperature changes in Kelvin that were originally measured. NOAA’s conversion of the minuscule warming data to Zettajoules, combined with the exaggerated vertical aspect of the graph, has the effect of making a very small change in ocean temperature seem considerably more significant than it is.
Converting the ocean heat content change back to temperature change reveals an interesting discrepancy between NOAA’s data and that of the ARGO system. Over the period of ARGO data, from 2004-2014, the NOAA data imply that the oceans are warming at 0.05 Cº decade–1, equivalent to 0.5 Cº century–1, or rather more than double the rate shown by ARGO.
ARGO has the better-resolved dataset, but since the resolutions of all ocean datasets are very low one should treat all these results with caution.
What one can say is that, on such evidence as these datasets are capable of providing, the difference between underlying warming rate of the ocean and that of the atmosphere is not statistically significant, suggesting that if the “missing heat” is hiding in the oceans it has magically found its way into the abyssal strata without managing to warm the upper strata on the way.
On these data, too, there is no evidence of rapid or catastrophic ocean warming.
Furthermore, to date no empirical, theoretical or numerical method, complex or simple, has yet successfully specified mechanistically either how the heat generated by anthropogenic greenhouse-gas enrichment of the atmosphere has reached the deep ocean without much altering the heat content of the intervening near-surface strata or how the heat from the bottom of the ocean may eventually re-emerge to perturb the near-surface climate conditions relevant to land-based life on Earth.

Figure T7. Near-global ocean temperatures by stratum, 0-1900 m, providing a visual reality check to show just how little the upper strata are affected by minor changes in global air surface temperature. Source: ARGO marine atlas.
Most ocean models used in performing coupled general-circulation model sensitivity runs simply cannot resolve most of the physical processes relevant for capturing heat uptake by the deep ocean.
Ultimately, the second law of thermodynamics requires that any heat which may have accumulated in the deep ocean will dissipate via various diffusive processes. It is not plausible that any heat taken up by the deep ocean will suddenly warm the upper ocean and, via the upper ocean, the atmosphere.
If the “deep heat” explanation for the Pause were correct (and it is merely one among dozens that have been offered), the complex models have failed to account for it correctly: otherwise, the growing discrepancy between the predicted and observed atmospheric warming rates would not have become as significant as it has.
In early October 2015 Steven Goddard added some very interesting graphs to his website. The graphs show the extent to which sea levels have been tampered with to make it look as though there has been sea-level rise when it is arguable that in fact there has been little or none.
Why were the models’ predictions exaggerated?
In 1990 the IPCC predicted – on its business-as-usual Scenario A – that from the Industrial Revolution till the present there would have been 4 Watts per square meter of radiative forcing caused by Man (Fig. T8):

Figure T8. Predicted manmade radiative forcings (IPCC, 1990).
However, from 1995 onward the IPCC decided to assume, on rather slender evidence, that anthropogenic particulate aerosols – mostly soot from combustion – were shading the Earth from the Sun to a large enough extent to cause a strong negative forcing. It has also now belatedly realized that its projected increases in methane concentration were wild exaggerations. As a result of these and other changes, it now estimates that the net anthropogenic forcing of the industrial era is just 2.3 Watts per square meter, or little more than half its prediction in 1990 (Fig. T9):

Figure T9: Net anthropogenic forcings, 1750 to 1950, 1980 and 2012 (IPCC, 2013).
Even this, however, may be a considerable exaggeration. For the best estimate of the actual current top-of-atmosphere radiative imbalance (total natural and anthropo-genic net forcing) is only 0.6 Watts per square meter (Fig. T10):

Figure T10. Energy budget diagram for the Earth from Stephens et al. (2012)
In short, most of the forcing predicted by the IPCC is either an exaggeration or has already resulted in whatever temperature change it was going to cause. There is little global warming in the pipeline as a result of our past and present sins of emission.
It is also possible that the IPCC and the models have relentlessly exaggerated climate sensitivity. One recent paper on this question is Monckton of Brenchley et al. (2015), which found climate sensitivity to be in the region of 1 Cº per CO2 doubling (go to scibull.com and click “Most Read Articles”). The paper identified errors in the models’ treatment of temperature feedbacks and their amplification, which account for two-thirds of the equilibrium warming predicted by the IPCC.
Professor Ray Bates gave a paper in Moscow in summer 2015 in which he concluded, based on the analysis by Lindzen & Choi (2009, 2011) (Fig. T10), that temperature feedbacks are net-negative. Accordingly, he supports the conclusion both by Lindzen & Choi (1990) (Fig. T11) and by Spencer & Braswell (2010, 2011) that climate sensitivity is below – and perhaps considerably below – 1 Cº per CO2 doubling.

Figure T11. Reality (center) vs. 11 models. From Lindzen & Choi (2009).
A growing body of reviewed papers find climate sensitivity considerably below the 3 [1.5, 4.5] Cº per CO2 doubling that was first put forward in the Charney Report of 1979 for the U.S. National Academy of Sciences, and is still the IPCC’s best estimate today.
On the evidence to date, therefore, there is no scientific basis for taking any action at all to mitigate CO2 emissions.
Finally, how long will it be before the Freedom Clock (Fig. T12) reaches 20 years without any global warming? If it does, the climate scare will become unsustainable.

Figure T12. The Freedom Clock edges ever closer to 20 years without global warming
#
Related Links:
April 1990 – The Canberra Times: ‘A report Issued by the U.S. space agency NASA…’
‘The [NASA] report’s authors said that their satellite analysis of the upper atmosphere is more accurate, and should be adopted as the standard way to monitor temperature change.’

Real Science website analysis: ‘Twenty-four years later, NASA and NOAA ignore the more accurate satellite data – and report only useless, tampered surface temperatures.’
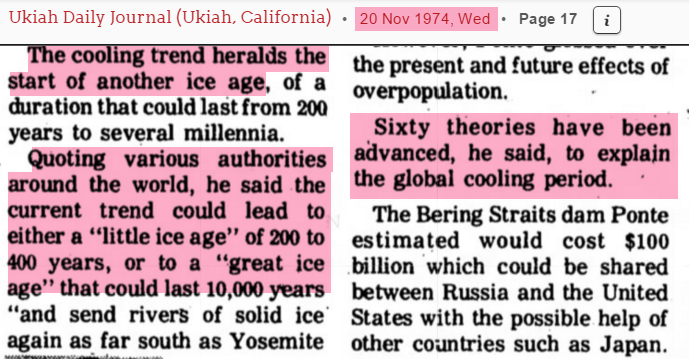
Flashback 1974: ’60 theories have been advanced to explain the global cooling’ – In the 1970’s scientists were predicting a new ice age, and had 60 theories to explain it.: – Ukiah Daily Journal 0 November 20, 1974 – “The cooling trend heralds the start of another ice age, of a duration that could last form 200 years to several milenia…Sixty theories have been advanced, he said, to explain the global cooling period.”

92 Responses
It is a crying shame that the climate change charlatans – who have been responsible for the greatest scientific deception of all time, and the individuals who have been responsible for engaging in misleading and deceptive conduct over ‘climate change’ since 1988, peddling fiction about CO2 and a coming climate catastrophe – will get away Scot free!
The author of this article at one time claimed to have a cure all for all manner of diseases, from Aids to Cancer.
When that failed, he got on the Global Warming Denial gravy train.
Pathetic.
Would you post your evidence for justifying this statement.
https://vimeo.com/45097141
I see…your evidence that this rather extraordinarily well-documented and erudite article rests on this? What if…just what if, Cap and Trade and Global Warming is a hoax in transferring wealth from the Haves to the Have Nots? A sort of Global Industrial Complex to replace the Military Industrial Complex in order for the Banks to have unfettered access to “Helping” these impoverished to become rebuilt in the image of us? Just what if?
You asked for proof that Monckton claimed to have “discovered” a cure all for multiple diseases.
I provided you with video proof of him professing exactly that from his own lying lips.
You now begin to whine about “what if” fantasies that are unrelated to your request.
Monckton is a scam artist, a congenital liar, and a fool.
His job is to leach as much money from Denialists as possible.
He has no talents, and no other way of supporting himself, except perhaps mopping floors or flipping burgers.
No, I assumed that you had read his significantly well-researched evidence, as I did, and were going to offer information to contradict him rather than merely label him as an enemy of your religion. Those hollow accusations and labels ended with the dark ages and the Witch trials. Eccentric people are entitled to occasional rantings…
So, what say you about any of his conclusions? Please identify those that are wrong. Pick it apart for me. This is a Forum for Scientists not for those Religious Fanatics who believe they have seen the light…and then live by The Creed, with no proof either from their Gods who they have chosen to believe… also without critiquing their methods.
You asked for proof that Monckton claimed to have “discovered” a cure all for multiple diseases.
I provided you with video proof of him professing exactly that from his own lying lips.
You now begin to whine about “what if” fantasies that are unrelated to your request.
Monckton is a scam artist, a congenital liar, and a fool.
His job is to leach as much money from Denialists as possible.
He has no talents, and no other way of supporting himself, except perhaps mopping floors or flipping burgers.
A short list of Monckton’s Deceit.
https://bbickmore.wordpress.com/lord-moncktons-rap-sheet/
and you are a pole smoking bootlicker of bath house barry.
“What if…just what if” – FortuitousOne
What if.. Just what if… action on CO2 reductions are delayed and your kind end up eradicating 1/3 of humanity, and 2/3rds of plant and animal life on this planet.
How should such scheming be punished?
Is execution good enough? Or should it be preceded with a months of extreme torture first?
Just what if?
lol…sounds as tho the alarmist´s misdirection techniques have brainwashed you and made you angry, threatening and a likely psychopath …Scared and crazy people buy guns next…
I believe that, when St. Helens erupted, the resulting pollution wiped out ALL the substantial gains spent on pollution control to that point in time…Maybe we would be just as well off spending money on controlling mother nature.
Assuming your doomsday scenario, as for my species, as opposed to yours…we will just evolve with larger and more efficient lungs.
But, until that happens…FOLLOW WHO IS BENEFITING FROM THE TRILLIONS WASTED KEEPING THE WORLD ECONOMY GOING!
Stupid people believe many stupid things.
“I believe that, when St. Helens erupted, the resulting pollution wiped out ALL the substantial gains spent on pollution control to that point in time” – FortuitousOne
Belief without evidence is just faith.
Where is your evidence for your belief?
Provide it here.
Another attempt at misdirection…Nice Try! I believe you were going to demon-strate to me how Lord Monktons calculations were wrong as you assert…
I grew up with Newsweek magazine predicting global cooling and its ramifications with it’s cover asserting such in the ’50’s. No attempt was ever made to control it and… Surprise… It just went away…
Just as this planet cannot afford to control volcanoes, neither can we afford to control mother nature with regard to global warming. We will just subsidize the Global Banking Industry and investors like Al Gore…
“I grew up with Newsweek magazine predicting global cooling” – FartitousOne
Then you grew up ignorant.
LOL I see now that it is impossible to have an erudite discussion with the mouth and mind consistent with a mean 10 year old! Let me know when you are capable of complex thought and able to support your facts in critiquing Lord Monckton’s calculations instead of attempting to discredit his character…
“I see now that it is impossible to have an erudite discussion with the mouth and mind consistent with a mean 10 year old!” – Fartuitous one.
You give yourself far too much credit. Your science comprehension is more that of an 8 year old.
“your facts in critiquing Lord Monckton’s calculations” – Fartuitous One
You apparently can’t read. There is no such person as Lord Monkton.
There is a denialist fraud called “Monkton” but he has never been a Lord, and never will be.
He lies a lot and claims to have a cure all for aids, the common cold, cancer, etc.
He sells snake oil, and dupes like you who don’t know the difference between reality and fantasy fall for it.
A detailed list of the (125) errors in Monckton’s July 2008 Physics and Society article
http://altenergyaction.org/Monckton.html
maybe he went thru the growing process ignorant, but what’s YOUR excuse now?
He grew up ignorant, I grew up intelligent.
I need no excuse.
You seem to suffer from the same intellectual inferiority as he does.
BWAAHAA!! You’re partially correct. YOU have no excuse for stupidity LOL! Keep gulping your Kool-Aid from your lead sippy cup.
“It just went away…” – FartuitiousOne
As a result of sulfate emission controls and catalytic converters mandated by Government.
My goodness you are ignorant.
“Lord Monktons calculations were wrong” – FartuitousOne
There is no such person as Lord Monkton. Three is a denialist fraud called “Monkton” but he has never been a Lord, and never will be.
He lies a lot and claims to have a cure all for aids, the common cold, cancer, etc.
He sells snake oil, and dupes like you who don’t know the difference between reality and fantasy fall for it.
A detailed list of the (125) errors in Monckton’s July 2008 Physics and Society article
http://altenergyaction.org/Monckton.html
Proof of deception, Deceptacarion0… First you quote me wrong and then, as your argument, you support what I said …DUH..
Don’t bother a response…
“neither can we afford to control mother nature with regard to global warming” – FartuitiousOne
Global warming in primarily anthropogenic in origin.
Why do you feel a need to lie about that fact?
Back in the 70s the big line of bullshit was we were going to freeze in a global ice age. That didn’t grab any traction, so 30+ years later they pull the rubbish we’re all going to die in a global atmospheric steam cooker.
“Back in the 70s the big line of bullshit was we were going to freeze in a global ice age.” – Moejj
Liar.. Liar.. Pants on fire…
I was wrong about you. You ARE dumber than I initially thought. I’m NOT lying. Pull your heard from your brainless arse. Back in the 70’s the big bad threat was the oncoming iceage. Now it’s completely opposite. Before you share your idiocracy with the big wide interwebs, educate yourself and learn what’s going on before you accomplish the impossible and make yourself look even less intelligent than you originally did at the beginning of this thread. I’m lying LOL…you are a COMPLETE looser. SMH.
Well, I wasn’t wrong about you MoeJJ. You have the intelligence of a low grade moron.
LOL!
https://uploads.disquscdn.com/images/d417f7a8a927588352665368fd10fa78f661e9f01deccaf33c4b57a8dd7676fa.png
If you’re ASSuming your brainless drivel is supposed to upset me, file it under fail. Time to engage with people who debate differences of thought, which you tossed out the window a long time ago. Your incapacity to do so has been demonstrated by pathetic name calling and an inability to maintain a mature demeanor all started with you. Yes for a moment you were partially correct because I foolishly stooped to your level and acted as a low grade moron by participating with you and utilizing names and insults just calling like you. I’m done with this nonsense. I wish you the best in finding like minded morons as yourself, I’m not one of them. Cheers.
“If you’re ASSuming your brainless drivel is supposed to upset me” – Moejj
LOL. You don’t even enter the picture, fool. You have no value, no meaning, other than as a source of laughter and as a paintable surface.
if that is the case then why are you so bent out of shape? lack of self control or sheer stupidity? tsk tsk tsk. advice: get a girlfriend. stay away from boys. society frowns on that 😉
I don’t tolerate liars. Hence I don’t tolerate you.
then define “liar”. i haven’t lied about anything. for the record, just because you disagree, does not qualify me as untruthful.
A liar is someone who denies fact.
Since global warming is a fact, and since you dispute it, you are therefore a liar.
A liar is also someone who tells lies. Since denialists regularly tell reams upon reams of lies, denialists are liars.
so, what’s your excuse? Other than making a box of rocks look like a PhD?
Rapid population decline among vertebrates began with industrialization
Rapid population decline among vertebrate species began at the end of the 19th century when industrialization was at its peak, according to researchers at The University of Texas Health Science Center at Houston (UTHealth) and the Chinese Academy of Sciences. The research was recently published in Proceedings of the National Academy of Sciences.
“Industrialization is the most natural explanation as to why we have rapid population decline in that period of time. It has to be somehow caused by human impact,” said Yun-Xin Fu, Ph.D., professor in the Department of Biostatistics and the Department of Epidemiology, Human Genetics and Environmental Sciences at UTHealth School of Public Health.
To reach this conclusion, Fu and his co-authors, including first author Haipeng Li, Ph.D., who was a visiting School of Public Health student and postdoctoral fellow now with the Chinese Academy of Sciences, reviewed thousands of scientific articles about the genetic diversity of vertebrate species. Their efforts yielded genetic data from 2,764 vertebrate species, 600 of which are endangered.
The researchers used a population genetics approach to model when each threatened species began to rapidly decline in population size. On average, the population size of endangered species declined by about 25 percent every 10 years starting 123 years ago.
yeah yeah yeah, keep your kindergarten level remarks coming. it’s entertaining.
A liar is someone who denies fact.
Since global warming is a fact, and since you dispute it, you are therefore a liar.
A liar is also someone who tells lies. Since denialists regularly tell reams upon reams of lies, denialists are liars.
“Time to engage with people who debate” – Moejj
People like you who are liars and fools are incapable of debate. Your only capacity is to lie and respond as a fool.
Perhaps you think that you are debating, in the same way that a Cow may think that it is winning the war against it’s farmer.
LOL!
there ya’ go again. got your panties wedged up yer arse again. switch to decaf. smh
People like you who are liars and fools are incapable of debate. Your only capacity is to lie and respond as a fool.
Perhaps you think that you are debating, in the same way that a Cow may think that it is winning the war against it’s farmer.
LOL!
i can debate. you haven’t done anything beyond throw insults and get angry. THAT – is the inability to debate.
“i can debate.” – Moejj
No evidence of that. In fact your denial of simple fact makes it clear that you don’t have the capacity to debate.
BWAAAAHAAAHAAA heed your own words? You’re hilarious. What a joke! You are stellar!! Nothing like trading barbs with a troll. At least you’re entertaining, dumb as a box of rocks and a hypocrite, but you are fun. Keep up. You make the interwebs fun.
Ocean temperatures faithfully recorded in mother-of-pearl
Mother-of-pearl or nacre (pronounced nay-ker), the lustrous, tough-as-nails biomineral that lines some seashells, has been shown to be a faithful record of ancient ocean temperature.
Writing online Thursday, Dec. 15, in the journal Earth and Planetary Science Letters, a team led by University of Wisconsin-Madison physics Professor Pupa Gilbert describes studies of the physical attributes of nacre in modern and fossil shells showing that the biomineral provides an accurate record of temperature as the material is formed, layer upon layer, in a mollusk.
“We can very accurately correlate nacre tablet thickness with temperature,” says Gilbert, explaining that mother-of-pearl is formed as mollusks lay down microscopic polygonal tablets of the mineral aragonite like brickwork to build layers of the shiny biomineral.
The work is important because it provides scientists with a new and potentially more accurate method of measuring ancient ocean temperatures, improving on methods now used with other biominerals to tease out the record of the environmental conditions at which the materials formed in the distant past.
“Everyone else measures temperatures in the ancient world using chemical proxies,” says Gilbert, referencing methods that, for example, use ratios of isotopic oxygen locked into tiny fossil shells made by marine microorganisms known as Foraminifera to get a snapshot of ocean temperatures in the distant past.
The method devised by Gilbert and her collaborators is extraordinarily simple: using just a scanning electron microscope and a cross section of shell, it is possible to measure the thickness of the layered microscopic tablets that compose nacre in a shell. The thickness of the tablets, explains Gilbert, correlates with ocean temperature as measured in modern shells when ocean temperatures were known at the time the shells were formed.
The new work by the researchers from Wisconsin, Harvard, and the Lawrence Berkeley National Laboratory provides a novel physical approach to measuring past climate, says Gilbert, an expert in biomineral formation.
“If what you are measuring is a physical structure, you see it directly,” says Gilbert. “You just measure nacre tablet thickness, the spacing of the lines, and it corresponds to temperature. When the temperature is warmer, the layers get thicker.”
The new study looked at fossil samples of nacre as old as 200 million years from a mollusk in the family Pinnidae, large, fast-growing saltwater clams that live in shallow ocean environments. Today, as in the distant past, the bivalves are widespread in tropical and temperate coastal and shallow continental shelf environments.
The new method is potentially more accurate, Gilbert notes, because the chemistry of fossil shells can be altered by diagenesis. Diagenesis occurs over geologic time, during or after sediments rain down on ocean beds to form sedimentary rock. Fossil shells may partially dissolve and re-precipitate as calcite, which fills cracks in aragonite nacre, thus skewing the chemical analysis of a sample, if analyzed as a bulk sample.
LOL incapable of debate. hypocrite much?
Trump’s outrageous lies come straight from big businesses’ playbook
Donald Trump surrogate Scottie Nell Hughes recently told WAMU’s Diane Rehm that “there’s no such thing, unfortunately, anymore, as facts.”
She’s right. And that’s the problem.
We now disagree not just on our political philosophies but on whether proven facts are true. In this world, Hughes’s observation is the last self-evident truth: Facts are a thing of the past. For the foreseeable future, Americans may find it impossible to debate politics clearly because of a lack of agreement on basic matters of fact; that was certainly the case during this year’s election. And no one has taken more advantage of this than Trump and his big-business cronies.
Trump and his talking heads didn’t create this world. It is a result of a decades-long strategy devised by a number of public affairs practitioners who recognized that lies were the most potent weapon in the fight against progress. Trump emulated some of these disinformation techniques, gleaned from big business, during his campaign.
Sixty-three years ago, as the scientific community neared consensus that tobacco products were dangerous, titans of the tobacco industry came together to meet with John Hill at the Plaza Hotel in New York. This was a rare gathering, as these executives were fighting one another for market share in an immensely competitive business. Hill, the founder of PR conglomerate Hill & Knowlton, recommended that they form a public relations operation, thinly veiled as a scientific institute, to argue that their products were safe. Together, the tobacco executives and Hill created the Tobacco Industry Research Committee, a sham organization designed to spread corporate propaganda to mislead the media, policymakers and the public at large.
Their goal was not to convince the majority of Americans that cigarettes did not cause cancer. Instead, they sought to muddy the waters and create a second truth. One truth would emanate from the bulk of the scientific community; the other, from a cadre of people primarily in the employment of the tobacco industry. The organization launched with an ad titled “A Frank Statement to Cigarette Smokers,” which ran in 400 newspapers reaching nearly 43 million readers and stated, “There is no proof that cigarette smoking is one of the causes” of lung cancer.
The ruse continued for almost five decades, until lawsuits against the industry forced the closure of the “research institute” and the public release of its internal documents. Now anyone with an Internet connection can read the full details of the tobacco industry’s expensive efforts to create an alternate set of facts about its products.
Today, 82 percent of Americans believe that smoking is “very harmful.” However, in the 1950s, the industry’s efforts influenced coverage from journalists as revered as Edward R. Murrow. In 1994, the chief executives of the seven largest tobacco companies told Congress under oath that they did not believe their products were addictive; more than 20 years later, they have yet to face penalties for their apparent perjury. Vice President-elect Mike Pence wrote in an op-ed posted on his 2000 congressional campaign website that, “despite the hysteria from the political class and the media, smoking doesn’t kill.” That year, his campaign received at least $13,000 from PACs affiliated with Big Tobacco.
The tobacco industry’s success in manufacturing its own truth won it decades of increased profits, even as it put the lives of millions of Americans at risk.
This morally objectionable playbook has been used by other industries seeking to avoid necessary regulations. The sugar industry, for instance, has promoted research designed to distract from the health effects of its products. Its Sugar Research Foundation provided funding to Harvard scientists to counter claims that sugar causes heart disease, despite the overwhelming evidence. In defense of their products, sugar lobbyists have also attacked other sweeteners, most recently high-fructose corn syrup. The Washington Post reported on an April 2004 memo from the Sugar Association bragging that it had “fed the media with the science to help fuel the public concern and debate on High Fructose Corn Syrup.” On the other side, those with a financial interest in the use of high-fructose corn syrup waged their own campaign, even hiring sex therapist Dr. Ruth to star in an ad in which she counsels a man in a giant corn costume, telling him that “corn sugar” was a “great name” because he was a sugar made from “good American corn” and should “be proud.”
Perhaps unsurprisingly, the consultants and strategists behind these campaigns of falsehood sometimes cross over from the corporate world into the domain of politics. In the 1970s, scientists at Exxon (now ExxonMobil) knew that their products were changing the climate, but the company nonetheless funded think tanks and organizations dedicated to denying the existence of global warming, such as the Heartland Institute and the Competitive Enterprise Institute. Donald Trump has appointed Exxon’s chief executive Rex Tillerson as his secretary of state, while Myron Ebell, who heads Trump’s Environmental Protection Agency transition, directs the Competitive Enterprise Institute’s anti-“global warming alarmism” Center for Energy and the Environment, an outfit straight out of the tobacco lobby’s handbook.
Other veterans of strategic-misinformation gambits have also found spots in Trump’s inner circle. In 2009 and 2010, instead of debating the government’s role in providing health care to its citizens, we were stuck in a conversation about whether Obamacare was in fact a plot to create panels with the goal of killing your elderly relatives and disabled children. The “death panels” lie was invented and evangelized by Betsy McCaughey, who had also been a leading opponent of Hillary Clinton’s health-care reform efforts in the ’90s. No surprise there: McCaughey has strong ties to the tobacco industry. After Sarah Palin coined the term “death panels” on Facebook to refer to McCaughey’s fictitious scare tactic, it was rigorously fact-checked by nonpartisan media from the moment the meme began to spread, yet to this day a significant percentage of the public believes that such panels exist. In August, Trump’s campaign announced that McCaughey would serve as an economic adviser.
We’ve seen this pattern repeated on issue after issue. A well-financed group invents lies and convinces a substantial share of the public that those lies are true. The propaganda purveyors recognize that the media’s instinct to cover “both sides” of an issue, people’s tendency to believe claims that conveniently fit their ideology, and, more recently, social media’s propensity to spread falsehoods all create a fundamental weakness in our civil society. They aren’t confused; they don’t misunderstand science or freely accessible truths. They have financial incentives to obscure those realities, and they do not care what they destroy in the process.
Our democracy is now straining under the weight of these attacks. When lies repeatedly affect the same segments of the population (and no group is immune), those absorbing this toxicity become distrustful of facts from reputable sources while latching onto even the most far-fetched conspiracy theories that conform to their worldviews. This political misinformation is so powerful that people have refused access to medical care because they were frightened by lies they had heard about Obamacare. So when Trump refers to, without basis in fact, “the millions of people who voted illegally,” his supporters believe his word over any actual authority on the subject — and he knows it.
“Yes for a moment you were partially correct because I foolishly stooped to your level and acted as a low grade moron” – Low Grade Moron
Low grade morons such as yourself, are always low grade morons. You don’t have the capacity to be otherwise.
https://uploads.disquscdn.com/images/d8eb9419c30e42d9d7c812cf7e221832d52895fb2f8ed6d25aa391125499ecf3.png
*sigh* it’s the mark of the *REAL* lamer when you can’t even think of your own insult, have to be a brainless loser and use the same words someone else just used. That = FAIL. Amazing your pea-brain can generate the required electricity to send signals to your fat little fingers just to type. No wait, you have your neighbor boy type for you right?
*what if* some dumbass detonates 25 megaton nukes around the globe, guess none of it matters then eh?
You don’t appear capable of rational discussion.
You’re out of your league. SO SOWWY!
You are clearly incapable of rational discussion.
You’re sadly incapable of accept fact/truth.
You are clearly incapable of rational discussion.
Awwww. Poor baby doesn’t like the program use to annotate a graphic.
Awwww…….. Suck it up Moron..
I was wrong about you. You’re a bigger dumbass than I originally thought. First time for me – I was actually wrong ! LOL
Awwww. Poor baby doesn’t like the program use to annotate a graphic.
Awwww…….. Suck it up Moron..
https://uploads.disquscdn.com/images/d8eb9419c30e42d9d7c812cf7e221832d52895fb2f8ed6d25aa391125499ecf3.png
you’re just incapable period.
You are clearly a moron..
typical libturd. can’t argue/debate so you name call. then have a good old fashioned panny meltdown.
Clearly you are a moron.
https://uploads.disquscdn.com/images/31e869773f4fbe075925c02c69612c85420e603e0e67674220635023b02ee0a9.png
post a sloppy MSpaint job and call me a moron. CLEARLY you = jackhole. i CLEARLY await your next pannie meltdown. cheers Skippy.
Awwww. Poor baby doesn’t like the program use to annotate a graphic.
Awwww…….. Suck it up Moron.
you’re so lame you copy and paste the same response. run out of words in that tiny brain (if there is even one present)?
Awwww. Poor baby doesn’t like the program use to annotate a graphic.
Awwww…….. Suck it up Moron.
https://uploads.disquscdn.com/images/d8eb9419c30e42d9d7c812cf7e221832d52895fb2f8ed6d25aa391125499ecf3.png
learn the gift of gab. you’re the equivalent of a scratched record stuck on repeat. i don’t “appear”. your OPINION = ZERO.
You are clearly incapable of rational discussion. https://uploads.disquscdn.com/images/d417f7a8a927588352665368fd10fa78f661e9f01deccaf33c4b57a8dd7676fa.png
You’re clearly incapable LOL
You are clearly a moron.
you=clearly incapable. so now what?
Clearly yo are a liar and a moron.
https://uploads.disquscdn.com/images/31e869773f4fbe075925c02c69612c85420e603e0e67674220635023b02ee0a9.png
He did not, in the video you posted he clearly says it shows promise.’
“We are curing people of everything from hiv, malaria, to multiple sclerosis.” – Liar for Hire – Not quite Lord Monckton.
Even the British House of Lords has told Monckton to stop misrepresenting himself as a Lord and to stop dishonestly misusing their Logo.
False tongueingore’s bum pablum. VenDickar
What if we were to look at 19 years even? Warming. 20 years? Warming. 21 years? Warming. 22 years? Warming. 23 years? Warming. 24 years? Warming. 25 years? Warming. 17 years? Warming. 18 years? Warming?
Hmmmm…it seems as if there is just a teeny, tiny window to make this specious claim!
Best,
D https://uploads.disquscdn.com/images/182c7c526aab159d16be77294b67de0813033c7f42a312f61fa2693ecdfa3fef.png
https://uploads.disquscdn.com/images/2d24474aaacf4e91cf6e65530df05e1ea4ecf44f127c8111496147645f183777.png https://uploads.disquscdn.com/images/e464892954c9ae0e05ec4881da49198dc75b086fbccbb97d56212ec54eb033ff.png https://uploads.disquscdn.com/images/1b7af132a68c1983c28a9e3c7161b3a0627fa1e9a654ef3d3905d67aca29f4d4.png
The evidence shows that not quite Lord Monckton is a liar for hire.
Exactly so.
Best,
D
fortunately you ecobabblers ususally do not like to be armed, so easily taken out once you get to shrill in the upcoming purges.
My God you are persistent one ! You been pasting this into this discussion everyday for months… You need a job bad!
The evidence shows that not quite Lord Monckton is a liar for hire.
Wow. You’re stupid on all sorts of sites.
My statements are 100% in line with the scientific assessment of the nature, extent, and ongoing damage being caused by anthropogenic climate change.
My training and expertise is in physics and computer science.
Your expertise is in maintaining your willful ignorance.
Young lady, you have no idea about my level of knowledge or education. Suggest you get back to your training; you obviously havent completed it. You sound like a chi square wannabe.
You are a fool. It is self evident that y https://uploads.disquscdn.com/images/39771dcd8fe292e0a59c7207aa3a9ac665b054829fe36533ba204669c076fd16.png our scientific literacy is close to zero.
I live in California. When I go into the Sierra Nevadas, which I have been visiting for 30 years and see huge swaths of trees dying I cannot help but to wonder what lies next. Its almost laughable the situation deniers find themselves in, where a graph is put up and you guys think that it proves AGW a sham?
Everyday deniers lose members, as in 2010 half my extended family(the older half) all were rapid deniers. Now, only one set of my grandparents are. 2 out of 16! Deniers are losing people left and right and having to keep their mouths shut whenever some horrible weather disaster happens. I keep wondering how long before they simply stop talking.
What caused the California Drought that lasted 200 years just 1000 years ago?
You do reliaze this drought is nothing in comparison?
The reason that they are winning the war on brainwashing is because they have an unlimited financial resource to keep beating us up with it … And that is your taxes you’re paying…
But… FOLLOW THE MONEY! This is no different than a Military war and there are lots of corporations reaping financial rewards using your tax payments …
See what RSS chief scientist Carl Mears has to say about the abuse of his data by people like Monckton. For those “skeptics” wishing to avoid the confronting content of the entire video, Mears first appears at 4’45, but reappears several times.
http://climatecrocks.com/2016/01/13/new-video-can-we-trust-satellite-temperatures/
Total crock of shit. You aren’t allowed to cherry pick your starting point. 1998 was an abberation. Show the whole time series, and stop lying.