
Special To Climate Depot
The Pause lengthens again – just in time for Paris
No global warming at all for 18 years 9 months – a new record
By Christopher Monckton of Brenchley
As the faithful gather around their capering shamans in Paris for the New Superstition’s annual festival of worship, the Pause lengthens yet again. One-third of Man’s entire influence on climate since the Industrial Revolution has occurred since February 1997. Yet the 225 months since then show no global warming at all (Fig. 1). With this month’s RSS temperature record, the Pause beats last month’s record and now stands at 18 years 9 months.
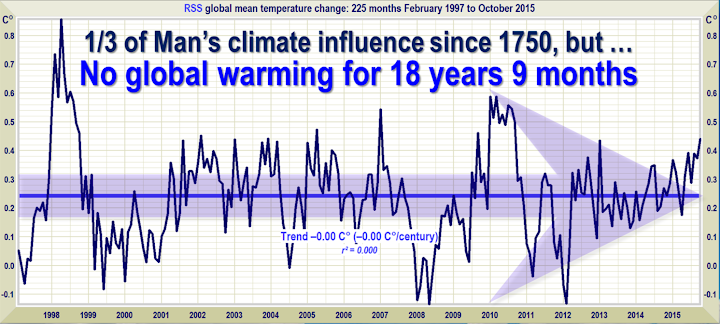
Figure 1. The least-squares linear-regression trend on the RSS satellite monthly global mean surface temperature anomaly dataset shows no global warming for 18 years 9 months since February 1997, though one-third of all anthropogenic forcings have occurred during the period of the Pause.
The accidental delegate from Burma provoked shrieks of fury from the congregation during the final benediction in Doha three years ago, when he said the Pause had endured for 16 years. Now, almost three years later, the Pause is almost three years longer.
It is worth understanding just how surprised the modelers ought to be by the persistence of the Pause. NOAA, in a very rare fit of honesty, admitted in its 2008 State of the Climate report that 15 years or more without global warming would demonstrate a discrepancy between prediction and observation. The reason for NOAA’s statement is that there is supposed to be a sharp and significant instantaneous response to a radiative forcing such as adding CO2 to the air.
The steepness of this predicted response can be seen in Fig. 1a, which is based on a paper on temperature feedbacks by Professor Richard Lindzen’s former student Professor Gerard Roe in 2009. The graph of Roe’s model output shows that the initial expected response to a forcing is supposed to be an immediate and rapid warming. But, despite the very substantial forcings in the 18 years 9 months since February 1997, not a flicker of warming has resulted.
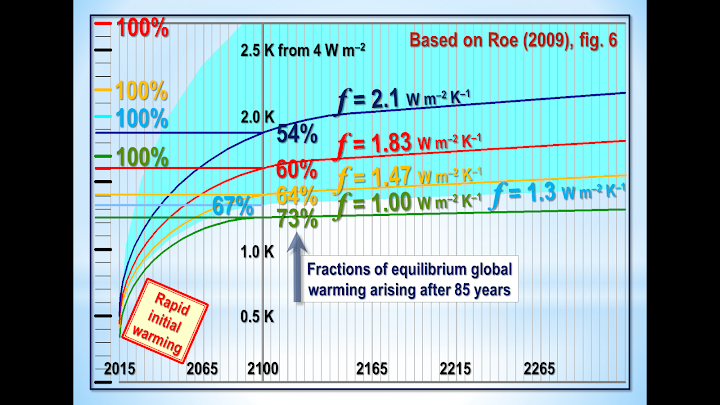
Figure 1a: Models predict rapid initial warming in response to a forcing. Instead, no warming at all is occurring. Based on Roe (2009).
At the Heartland and Philip Foster events in Paris, I shall reveal in detail the three serious errors that have led the models to over-predict warming so grossly.
The current el Niño, as Bob Tisdale’s distinguished series of reports here demonstrates, is at least as big as the Great el Niño of 1998. The RSS temperature record is beginning to reflect its magnitude.
From next month on, the Pause will probably shorten dramatically and may disappear altogether for a time. However, if there is a following la Niña, as there often is, the Pause may return at some time from the end of next year onward.
The hiatus period of 18 years 9 months is the farthest back one can go in the RSS satellite temperature record and still show a sub-zero trend. The start date is not cherry-picked: it is calculated. And the graph does not mean there is no such thing as global warming. Going back further shows a small warming rate.
And yes, the start-date for the Pause has been inching forward, though just a little more slowly than the end-date, which is why the Pause continues on average to lengthen.
So long a stasis in global temperature is simply inconsistent not only with the extremist predictions of the computer models but also with the panic whipped up by the rent-seeking profiteers of doom rubbing their hands with glee in Paris.
The UAH dataset shows a Pause almost as long as the RSS dataset. However, the much-altered surface tamperature datasets show a small warming rate (Fig. 1b).

Figure 1b. The least-squares linear-regression trend on the mean of the GISS, HadCRUT4 and NCDC terrestrial monthly global mean surface temperature anomaly datasets shows global warming at a rate equivalent to 1.1 C° per century during the period of the Pause from January 1997 to September 2015.
Bearing in mind that one-third of the 2.4 W m–2 radiative forcing from all manmade sources since 1750 has occurred during the period of the Pause, a warming rate equivalent to little more than 1 C°/century is not exactly alarming.
As always, a note of caution. Merely because there has been little or no warming in recent decades, one may not draw the conclusion that warming has ended forever. The trend lines measure what has occurred: they do not predict what will occur.
The Pause – politically useful though it may be to all who wish that the “official” scientific community would remember its duty of skepticism – is far less important than the growing discrepancy between the predictions of the general-circulation models and observed reality.
The divergence between the models’ predictions in 1990 (Fig. 2) and 2005 (Fig. 3), on the one hand, and the observed outturn, on the other, continues to widen. If the Pause lengthens just a little more, the rate of warming in the quarter-century since the IPCC’s First Assessment Report in 1990 will fall below 1 C°/century equivalent.

Figure 2. Near-term projections of warming at a rate equivalent to 2.8 [1.9, 4.2] K/century, made with “substantial confidence” in IPCC (1990), for the 309 months January 1990 to September 2015 (orange region and red trend line), vs. observed anomalies (dark blue) and trend (bright blue) at just 1.02 K/century equivalent, taken as the mean of the RSS and UAH v.6 satellite monthly mean lower-troposphere temperature anomalies.

Figure 3. Predicted temperature change, January 2005 to September 2015, at a rate equivalent to 1.7 [1.0, 2.3] Cº/century (orange zone with thick red best-estimate trend line), compared with the near-zero observed anomalies (dark blue) and real-world trend (bright blue), taken as the mean of the RSS and UAH v.6 satellite lower-troposphere temperature anomalies.
As ever, the Technical Note explains the sources of the IPCC’s predictions in 1990 and in 2005, and also demonstrates that that according to the ARGO bathythermograph data the oceans are warming at a rate equivalent to less than a quarter of a Celsius degree per century. In a rational scientific discourse, those who had advocated extreme measures to prevent global warming would now be withdrawing and calmly rethinking their hypotheses. However, this is not a rational scientific discourse. On the questioners’ side it is rational: on the believers’ side it is a matter of increasingly blind faith. The New Superstition is no fides quaerens intellectum.
Key facts about global temperature
These facts should be shown to anyone who persists in believing that, in the words of Mr Obama’s Twitteratus, “global warming is real, manmade and dangerous”.
- The RSS satellite dataset shows no global warming at all for 225 months from February 1997 to Octber 2015 – more than half the 442-month satellite record.
- There has been no warming even though one-third of all anthropogenic forcings since 1750 have occurred since the Pause began in February 1997.
- The entire RSS dataset for the 442 months December 1978 to September 2015 shows global warming at an unalarming rate equivalent to just 1.13 Cº per century.

- Since 1950, when a human influence on global temperature first became theoretically possible, the global warming trend has been equivalent to below 1.2 Cº per century.
- The global warming trend since 1900 is equivalent to 0.75 Cº per century. This is well within natural variability and may not have much to do with us.
- The fastest warming rate lasting 15 years or more since 1950 occurred over the 33 years from 1974 to 2006. It was equivalent to 2.0 Cº per century.
- Compare the warming on the Central England temperature dataset in the 40 years 1694-1733, well before the Industrial Revolution, equivalent to 4.33 C°/century.
- In 1990, the IPCC’s mid-range prediction of near-term warming was equivalent to 2.8 Cº per century, higher by two-thirds than its current prediction of 1.7 Cº/century.
- The warming trend since 1990, when the IPCC wrote its first report, is equivalent to 1 Cº per century. The IPCC had predicted close to thrice as much.
- To meet the IPCC’s central prediction of 1 C° warming from 1990-2025, in the next decade a warming of 0.75 C°, equivalent to 7.5 C°/century, would have to occur.
- Though the IPCC has cut its near-term warming prediction, it has not cut its high-end business as usual centennial warming prediction of 4.8 Cº warming to 2100.
- The IPCC’s predicted 4.8 Cº warming by 2100 is well over twice the greatest rate of warming lasting more than 15 years that has been measured since 1950.
- The IPCC’s 4.8 Cº-by-2100 prediction is four times the observed real-world warming trend since we might in theory have begun influencing it in 1950.
- The oceans, according to the 3600+ ARGO buoys, are warming at a rate of just 0.02 Cº per decade, equivalent to 0.23 Cº per century, or 1 C° in 430 years.
- Recent extreme-weather events cannot be blamed on global warming, because there has not been any global warming to speak of. It is as simple as that.
Technical note
Our latest topical graph shows the least-squares linear-regression trend on the RSS satellite monthly global mean lower-troposphere dataset for as far back as it is possible to go and still find a zero trend. The start-date is not “cherry-picked” so as to coincide with the temperature spike caused by the 1998 el Niño. Instead, it is calculated so as to find the longest period with a zero trend.
The fact of a long Pause is an indication of the widening discrepancy between prediction and reality in the temperature record.
The satellite datasets are arguably less unreliable than other datasets in that they show the 1998 Great El Niño more clearly than all other datasets. The Great el Niño, like its two predecessors in the past 300 years, caused widespread global coral bleaching, providing an independent verification that the satellite datasets are better able than the rest to capture such fluctuations without artificially filtering them out.
Terrestrial temperatures are measured by thermometers. Thermometers correctly sited in rural areas away from manmade heat sources show warming rates below those that are published. The satellite datasets are based on reference measurements made by the most accurate thermometers available – platinum resistance thermometers, which provide an independent verification of the temperature measurements by checking via spaceward mirrors the known temperature of the cosmic background radiation, which is 1% of the freezing point of water, or just 2.73 degrees above absolute zero. It was by measuring minuscule variations in the cosmic background radiation that the NASA anisotropy probe determined the age of the Universe: 13.82 billion years.
The RSS graph (Fig. 1) is accurate. The data are lifted monthly straight from the RSS website. A computer algorithm reads them down from the text file and plots them automatically using an advanced routine that automatically adjusts the aspect ratio of the data window at both axes so as to show the data at maximum scale, for clarity.
The latest monthly data point is visually inspected to ensure that it has been correctly positioned. The light blue trend line plotted across the dark blue spline-curve that shows the actual data is determined by the method of least-squares linear regression, which calculates the y-intercept and slope of the line.
The IPCC and most other agencies use linear regression to determine global temperature trends. Professor Phil Jones of the University of East Anglia recommends it in one of the Climategate emails. The method is appropriate because global temperature records exhibit little auto-regression, since summer temperatures in one hemisphere are compensated by winter in the other. Therefore, an AR(n) model would generate results little different from a least-squares trend.
Dr Stephen Farish, Professor of Epidemiological Statistics at the University of Melbourne, kindly verified the reliability of the algorithm that determines the trend on the graph and the correlation coefficient, which is very low because, though the data are highly variable, the trend is flat.
RSS itself is now taking a serious interest in the length of the Great Pause. Dr Carl Mears, the senior research scientist at RSS, discusses it at remss.com/blog/recent-slowing-rise-global-temperatures.
Dr Mears’ results are summarized in Fig. T1:

Figure T1. Output of 33 IPCC models (turquoise) compared with measured RSS global temperature change (black), 1979-2014. The transient coolings caused by the volcanic eruptions of Chichón (1983) and Pinatubo (1991) are shown, as is the spike in warming caused by the great el Niño of 1998.
Dr Mears writes:
“The denialists like to assume that the cause for the model/observation discrepancy is some kind of problem with the fundamental model physics, and they pooh-pooh any other sort of explanation. This leads them to conclude, very likely erroneously, that the long-term sensitivity of the climate is much less than is currently thought.”
Dr Mears concedes the growing discrepancy between the RSS data and the models, but he alleges “cherry-picking” of the start-date for the global-temperature graph:
“Recently, a number of articles in the mainstream press have pointed out that there appears to have been little or no change in globally averaged temperature over the last two decades. Because of this, we are getting a lot of questions along the lines of ‘I saw this plot on a denialist web site. Is this really your data?’ While some of these reports have ‘cherry-picked’ their end points to make their evidence seem even stronger, there is not much doubt that the rate of warming since the late 1990s is less than that predicted by most of the IPCC AR5 simulations of historical climate. … The denialists really like to fit trends starting in 1997, so that the huge 1997-98 ENSO event is at the start of their time series, resulting in a linear fit with the smallest possible slope.”
In fact, the spike in temperatures caused by the Great el Niño of 1998 is almost entirely offset in the linear-trend calculation by two factors: the not dissimilar spike of the 2010 el Niño, and the sheer length of the Great Pause itself. The headline graph in these monthly reports begins in 1997 because that is as far back as one can go in the data and still obtain a zero trend.

Fig. T1a. Graphs for RSS and GISS temperatures starting both in 1997 and in 2001. For each dataset the trend-lines are near-identical, showing conclusively that the argument that the Pause was caused by the 1998 el Nino is false (Werner Brozek and Professor Brown worked out this neat demonstration).
Curiously, Dr Mears prefers the terrestrial datasets to the satellite datasets. The UK Met Office, however, uses the satellite data to calibrate its own terrestrial record.
The length of the Pause, significant though it now is, is of less importance than the ever-growing discrepancy between the temperature trends predicted by models and the far less exciting real-world temperature change that has been observed.
Sources of the IPCC projections in Figs. 2 and 3
IPCC’s First Assessment Report predicted that global temperature would rise by 1.0 [0.7, 1.5] Cº to 2025, equivalent to 2.8 [1.9, 4.2] Cº per century. The executive summary asked, “How much confidence do we have in our predictions?” IPCC pointed out some uncertainties (clouds, oceans, etc.), but concluded:
“Nevertheless, … we have substantial confidence that models can predict at least the broad-scale features of climate change. … There are similarities between results from the coupled models using simple representations of the ocean and those using more sophisticated descriptions, and our understanding of such differences as do occur gives us some confidence in the results.”
That “substantial confidence” was substantial over-confidence. For the rate of global warming since 1990 – the most important of the “broad-scale features of climate change” that the models were supposed to predict – is now below half what the IPCC had then predicted.
In 1990, the IPCC said this:
“Based on current models we predict:
“under the IPCC Business-as-Usual (Scenario A) emissions of greenhouse gases, a rate of increase of global mean temperature during the next century of about 0.3 Cº per decade (with an uncertainty range of 0.2 Cº to 0.5 Cº per decade), this is greater than that seen over the past 10,000 years. This will result in a likely increase in global mean temperature of about 1 Cº above the present value by 2025 and 3 Cº before the end of the next century. The rise will not be steady because of the influence of other factors” (p. xii).
Later, the IPCC said:
“The numbers given below are based on high-resolution models, scaled to be consistent with our best estimate of global mean warming of 1.8 Cº by 2030. For values consistent with other estimates of global temperature rise, the numbers below should be reduced by 30% for the low estimate or increased by 50% for the high estimate” (p. xxiv).
The orange region in Fig. 2 represents the IPCC’s medium-term Scenario-A estimate of near-term warming, i.e. 1.0 [0.7, 1.5] K by 2025.
The IPCC’s predicted global warming over the 25 years from 1990 to the present differs little from a straight line (Fig. T2).
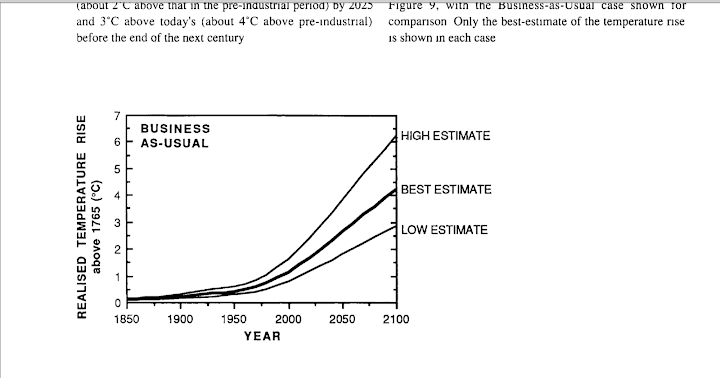
Figure T2. Historical warming from 1850-1990, and predicted warming from 1990-2100 on the IPCC’s “business-as-usual” Scenario A (IPCC, 1990, p. xxii).
Because this difference between a straight line and the slight uptick in the warming rate the IPCC predicted over the period 1990-2025 is so small, one can look at it another way. To reach the 1 K central estimate of warming since 1990 by 2025, there would have to be twice as much warming in the next ten years as there was in the last 25 years. That is not likely.
But is the Pause perhaps caused by the fact that CO2 emissions have not been rising anything like as fast as the IPCC’s “business-as-usual” Scenario A prediction in 1990? No: CO2 emissions have risen rather above the Scenario-A prediction (Fig. T3).

Figure T3. CO2 emissions from fossil fuels, etc., in 2012, from Le Quéré et al. (2014), plotted against the chart of “man-made carbon dioxide emissions”, in billions of tonnes of carbon per year, from IPCC (1990).
Plainly, therefore, CO2 emissions since 1990 have proven to be closer to Scenario A than to any other case, because for all the talk about CO2 emissions reduction the fact is that the rate of expansion of fossil-fuel burning in China, India, Indonesia, Brazil, etc., far outstrips the paltry reductions we have achieved in the West to date.
True, methane concentration has not risen as predicted in 1990 (Fig. T4), for methane emissions, though largely uncontrolled, are simply not rising as the models had predicted. Here, too, all of the predictions were extravagantly baseless.
The overall picture is clear. Scenario A is the emissions scenario from 1990 that is closest to the observed CO2 emissions outturn.

Figure T4. Methane concentration as predicted in four IPCC Assessment Reports, together with (in black) the observed outturn, which is running along the bottom of the least prediction. This graph appeared in the pre-final draft of IPCC (2013), but had mysteriously been deleted from the final, published version, inferentially because the IPCC did not want to display such a plain comparison between absurdly exaggerated predictions and unexciting reality.
To be precise, a quarter-century after 1990, the global-warming outturn to date – expressed as the least-squares linear-regression trend on the mean of the RSS and UAH monthly global mean surface temperature anomalies – is 0.27 Cº, equivalent to little more than 1 Cº/century. The IPCC’s central estimate of 0.71 Cº, equivalent to 2.8 Cº/century, that was predicted for Scenario A in IPCC (1990) with “substantial confidence” was approaching three times too big. In fact, the outturn is visibly well below even the least estimate.
In 1990, the IPCC’s central prediction of the near-term warming rate was higher by two-thirds than its prediction is today. Then it was 2.8 C/century equivalent. Now it is just 1.7 Cº equivalent – and, as Fig. T5 shows, even that is proving to be a substantial exaggeration.
Is the ocean warming?
One frequently-discussed explanation for the Great Pause is that the coupled ocean-atmosphere system has continued to accumulate heat at approximately the rate predicted by the models, but that in recent decades the heat has been removed from the atmosphere by the ocean and, since globally the near-surface strata show far less warming than the models had predicted, it is hypothesized that what is called the “missing heat” has traveled to the little-measured abyssal strata below 2000 m, whence it may emerge at some future date.
Actually, it is not known whether the ocean is warming: each of the 3600 automated ARGO bathythermograph buoys takes just three measurements a month in 200,000 cubic kilometres of ocean – roughly a 100,000-square-mile box more than 316 km square and 2 km deep. Plainly, the results on the basis of a resolution that sparse (which, as Willis Eschenbach puts it, is approximately the equivalent of trying to take a single temperature and salinity profile taken at a single point in Lake Superior less than once a year) are not going to be a lot better than guesswork.
Unfortunately ARGO seems not to have updated the ocean dataset since December 2014. However, what we have gives us 11 full years of data. Results are plotted in Fig. T5. The ocean warming, if ARGO is right, is equivalent to just 0.02 Cº decade–1, equivalent to 0.2 Cº century–1.
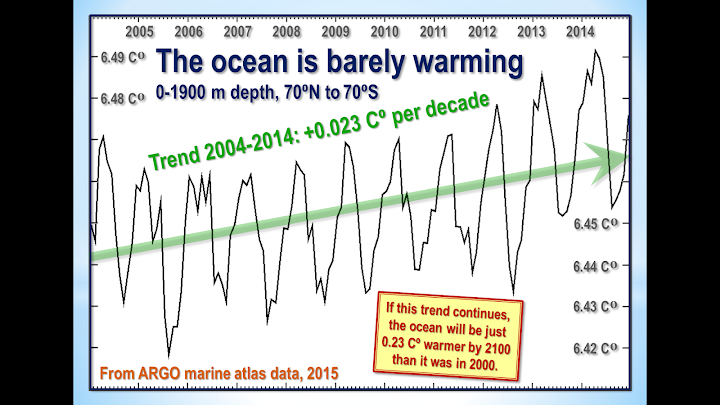
Figure T5. The entire near-global ARGO 2 km ocean temperature dataset from January 2004 to December 2014 (black spline-curve), with the least-squares linear-regression trend calculated from the data by the author (green arrow).
Finally, though the ARGO buoys measure ocean temperature change directly, before publication NOAA craftily converts the temperature change into zettajoules of ocean heat content change, which make the change seem a whole lot larger.
The terrifying-sounding heat content change of 260 ZJ from 1970 to 2014 (Fig. T6) is equivalent to just 0.2 K/century of global warming. All those “Hiroshima bombs of heat” of which the climate-extremist websites speak are a barely discernible pinprick. The ocean and its heat capacity are a lot bigger than some may realize.

Figure T6. Ocean heat content change, 1957-2013, in Zettajoules from NOAA’s NODC Ocean Climate Lab: http://www.nodc.noaa.gov/OC5/3M_HEAT_CONTENT, with the heat content values converted back to the ocean temperature changes in Kelvin that were originally measured. NOAA’s conversion of the minuscule warming data to Zettajoules, combined with the exaggerated vertical aspect of the graph, has the effect of making a very small change in ocean temperature seem considerably more significant than it is.
Converting the ocean heat content change back to temperature change reveals an interesting discrepancy between NOAA’s data and that of the ARGO system. Over the period of ARGO data, from 2004-2014, the NOAA data imply that the oceans are warming at 0.05 Cº decade–1, equivalent to 0.5 Cº century–1, or rather more than double the rate shown by ARGO.
ARGO has the better-resolved dataset, but since the resolutions of all ocean datasets are very low one should treat all these results with caution.
What one can say is that, on such evidence as these datasets are capable of providing, the difference between underlying warming rate of the ocean and that of the atmosphere is not statistically significant, suggesting that if the “missing heat” is hiding in the oceans it has magically found its way into the abyssal strata without managing to warm the upper strata on the way.
On these data, too, there is no evidence of rapid or catastrophic ocean warming.
Furthermore, to date no empirical, theoretical or numerical method, complex or simple, has yet successfully specified mechanistically either how the heat generated by anthropogenic greenhouse-gas enrichment of the atmosphere has reached the deep ocean without much altering the heat content of the intervening near-surface strata or how the heat from the bottom of the ocean may eventually re-emerge to perturb the near-surface climate conditions relevant to land-based life on Earth.
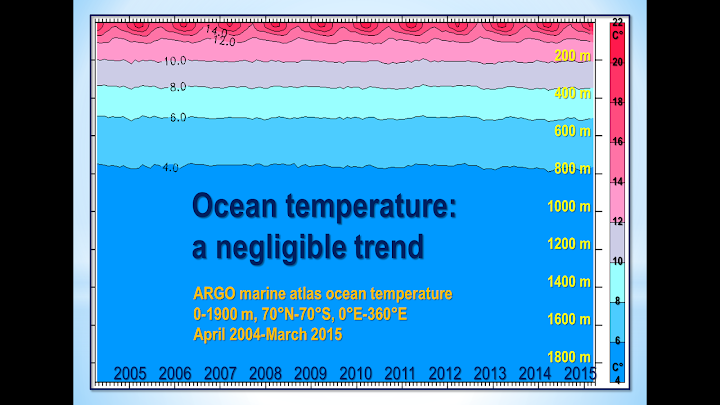
Figure T7. Near-global ocean temperatures by stratum, 0-1900 m, providing a visual reality check to show just how little the upper strata are affected by minor changes in global air surface temperature. Source: ARGO marine atlas.
Most ocean models used in performing coupled general-circulation model sensitivity runs simply cannot resolve most of the physical processes relevant for capturing heat uptake by the deep ocean.
Ultimately, the second law of thermodynamics requires that any heat which may have accumulated in the deep ocean will dissipate via various diffusive processes. It is not plausible that any heat taken up by the deep ocean will suddenly warm the upper ocean and, via the upper ocean, the atmosphere.
If the “deep heat” explanation for the Pause were correct (and it is merely one among dozens that have been offered), the complex models have failed to account for it correctly: otherwise, the growing discrepancy between the predicted and observed atmospheric warming rates would not have become as significant as it has.
In early October 2015 Steven Goddard added some very interesting graphs to his website. The graphs show the extent to which sea levels have been tampered with to make it look as though there has been sea-level rise when it is arguable that in fact there has been little or none.
Why were the models’ predictions exaggerated?
In 1990 the IPCC predicted – on its business-as-usual Scenario A – that from the Industrial Revolution till the present there would have been 4 Watts per square meter of radiative forcing caused by Man (Fig. T8):

Figure T8. Predicted manmade radiative forcings (IPCC, 1990).
However, from 1995 onward the IPCC decided to assume, on rather slender evidence, that anthropogenic particulate aerosols – mostly soot from combustion – were shading the Earth from the Sun to a large enough extent to cause a strong negative forcing. It has also now belatedly realized that its projected increases in methane concentration were wild exaggerations. As a result of these and other changes, it now estimates that the net anthropogenic forcing of the industrial era is just 2.3 Watts per square meter, or little more than half its prediction in 1990 (Fig. T9):

Figure T9: Net anthropogenic forcings, 1750 to 1950, 1980 and 2012 (IPCC, 2013).
Even this, however, may be a considerable exaggeration. For the best estimate of the actual current top-of-atmosphere radiative imbalance (total natural and anthropo-genic net forcing) is only 0.6 Watts per square meter (Fig. T10):

Figure T10. Energy budget diagram for the Earth from Stephens et al. (2012)
In short, most of the forcing predicted by the IPCC is either an exaggeration or has already resulted in whatever temperature change it was going to cause. There is little global warming in the pipeline as a result of our past and present sins of emission.
It is also possible that the IPCC and the models have relentlessly exaggerated climate sensitivity. One recent paper on this question is Monckton of Brenchley et al. (2015), which found climate sensitivity to be in the region of 1 Cº per CO2 doubling (go to scibull.com and click “Most Read Articles”). The paper identified errors in the models’ treatment of temperature feedbacks and their amplification, which account for two-thirds of the equilibrium warming predicted by the IPCC.
Professor Ray Bates gave a paper in Moscow in summer 2015 in which he concluded, based on the analysis by Lindzen & Choi (2009, 2011) (Fig. T10), that temperature feedbacks are net-negative. Accordingly, he supports the conclusion both by Lindzen & Choi (1990) (Fig. T11) and by Spencer & Braswell (2010, 2011) that climate sensitivity is below – and perhaps considerably below – 1 Cº per CO2 doubling.

Figure T11. Reality (center) vs. 11 models. From Lindzen & Choi (2009).
A growing body of reviewed papers find climate sensitivity considerably below the 3 [1.5, 4.5] Cº per CO2 doubling that was first put forward in the Charney Report of 1979 for the U.S. National Academy of Sciences, and is still the IPCC’s best estimate today.
On the evidence to date, therefore, there is no scientific basis for taking any action at all to mitigate CO2 emissions.
Finally, how long will it be before the Freedom Clock (Fig. T12) reaches 20 years without any global warming? If it does, the climate scare will become unsustainable.

Figure T12. The Freedom Clock edges ever closer to 20 years without global warming

2,024 Responses
It’s silly to use the alarmists’ terminology.
Specifically, in this article, “forcings.”
You show clearly that the actions or substances do not “force” the “climate” to do anything.
Why then call the actions or substances “forcings?”
For example: “Models predict rapid initial warming in response to a forcing. Instead, no warming at all is occurring”
If no warming at all is occurring, then there was no “forcing,” was there?
Call it man-made CO2, call it man-made methane, call it man-made soot. But do not call it a “forcing” if there was no effect.
Note the word “instead” in the cited passage.
The observed facts do not tell us there was no forcing. They tell us there may or may not have been a forcing, and that, if there was one, it was outweighed by other forcings in the opposite direction.
Kent is right.
“He who controls the language controls the masses”. – Saul Alinsky in Rules for Radicals
Not a pause that implies future warming, a plateau. Not climate change, anthropogenic global warming. Etc
lol! Nope. Neither a plateau nor a pause. Continued warming. You could try to redefine the word “warming” to mean “cooling”, but I think most people might find that a bit too Orwellian for their tastes…
earthobservatory.nasa.gov/blogs/earthmatters/files/2015/06/no-slow-down-in-global-warming-720×546.jpg
It is almost like the denialists know there is no science. They just trot out the junk that fox viewers have lapped up before.
No. That is just the latest altered data. Pretty soon the 1880’s will have had to have been an ice age.
I’m seeing conspiracy theory coming…..
Of course! Anthropogenic global warming is a secret plot that’s been maintained for over a century without detection until Interplanet Janet came along and figured it all out.
That makes perfect sense!
/s
climate.nasa.gov/evidence
Not to mention that even in the 70s the ‘warmistts’ were conspiring to silence the iceagers…. through consensus…. . (we’re on climdep, so the obligatory /s ….)
“The Myth of the 1970s Global Cooling Scientific Consensus”
http://journals.ametsoc.org/doi/abs/10.1175/2008BAMS2370.1
❝Consensus❞ has no meaning in science. Besides, the Global Cooling scare was promulgated by the media and not many scientists.
Yet we have a paper w Consensus in the title…..
https://uploads.disquscdn.com/images/6048870ded2d0a642876d3fda537b89d317f4903fa7eb444037b8090a503852e.jpg
The “CO2” knob isn’t as big as you think….
…so point to a single moment in Earth’s history when polar ice caps were able to withstand CO₂ so high.
You’ve been asked to do this multiple times, VooDude.
What’s the holdup?
http://www.nasa.gov/topics/earth/features/vapor_warming.html
Well, how about RIGHT NOW?
❝…Antarctica is not currently contributing to sea level rise, but is taking 0.23 millimeters per year away,…❞
https://uploads.disquscdn.com/images/870184797947789c33424fa949ac3609325786d08b13cc8736417e9b1dfcc4b5.jpg
❝… the Antarctic ice sheet [actually] showed a net gain of 112 billion tons [Gt] of ice a year from 1992 to 2001. That net gain slowed to [an increase of only] 82 billion tons [Gt] of ice per year between 2003 and 2008. … ❝Our main disagreement is for East Antarctica and the interior of West Antarctica – there, we see an ice gain that exceeds the losses in the other areas.❞
http://www.nasa.gov/feature/goddard/nasa-study-mass-gains-of-antarctic-ice-sheet-greater-than-losses
”Mass changes of the Antarctic ice sheet … Satellite (ICESat) data (2003–08) show mass gains from snow accumulation exceeded discharge losses by 82 ± 25 Gt a–1, reducing global sea-level rise by 0.23 mm a–1. European Remote-sensing Satellite (ERS) data (1992–2001) give a similar gain of 112 ± 61 Gt a–1. …”
Zwally, H. Jay, et al. 2015 “Mass gains of the Antarctic ice sheet exceed losses.” Journal of Glaciology
http://www.ingentaconnect.com/content/igsoc/jog/pre-prints/content-ings_jog_15j071
E. R. Thomas, J. S. Hosking, R. R. Tuckwell, R. A. Warren, and E. C. Ludlow 2015 “Twentieth century increase in snowfall in coastal West Antarctica” Geophysical Research Letters
http://onlinelibrary.wiley.com/doi/10.1002/2015GL065750/full
Greenland has been gaining SMB lately:
https://uploads.disquscdn.com/images/8309a6b2860f6c7377cbd7b0a09189560fe4ab97de86bb687aac9bd0ab35206b.jpg
https://uploads.disquscdn.com/images/19b5a3b7fc4e4c3b4d122ddc3d41019c873547633b6f1c13f533daff8df0b2a9.jpg
Greenland is being a “good boy” it seems. Not wee-wee-ing into the ocean (as much as before):
https://uploads.disquscdn.com/images/a06d6daadcb3ce400fc4714f0cb3eb8996c152099c6f4af8df96358383200c36.jpg
https://uploads.disquscdn.com/images/f31a0c09a2626e6b693e8301762f05935cb3b455653b8614afdd2a100b6300e3.jpg
That’s good!
Yes, there is one study that has found Antarctica is gaining ice, but it is contradicted by other studies.
The rest of your post is nonsense.
If the findings of the study were correct, they suggest the meltdown of Greenland is more than offsetting that gain, and that the gain is declining.
If you understand the polar ice sheets have never before in Earth’s history been able to withstand CO₂ so high, why would this surprise you?
http://www.nature.com/news/gains-in-antarctic-ice-might-offset-losses-1.18486
In soccer, this is called an “own goal” … https://uploads.disquscdn.com/images/4571d2f04ff9dd65081f80850f4e41e819bf4828246840a2f3e5f777eb0420ad.jpg
… your question wasn’t about
but “ice caps” and “CO2 so high”
https://uploads.disquscdn.com/images/d9e401069531a57c7200cd75118576bbba7db04aea9e3b07c67437f143b728a0.jpg
https://uploads.disquscdn.com/images/8449c4674f79644447b07cace2f62587d6dc7811ed3432cf9a6386cde694df33.jpg
https://uploads.disquscdn.com/images/0afe77137bf7cbae5f2e2a5630339b58a86319de441db52bb79dd82e62c97960.jpg
Martinez is also a “believer” in AGW. That is what the entire paper is about, paleo-CO2 forcings. However, she presents, perhaps unwittingly, the answer to your persistent question …
…but this propaganda piece isn’t about soccer, pumpkin. It’s about global warming. If you think there’s a stronger driver of planetary temperature than CO₂, name that driver and point to a single moment in Earth’s history it caused polar ice sheets to form with CO₂ as high as we have today.
Why haven’t you done that yet?
https://uploads.disquscdn.com/images/2380af6ac2b092cc85baa6b23b54164a96dab505bc80f7850d76cabbb159e4d2.gif
https://uploads.disquscdn.com/images/e08c77c6955bbbd089c9652092204a9fdaf26301e8f17cb01f195bedd271902e.jpg https://uploads.disquscdn.com/images/a06d6daadcb3ce400fc4714f0cb3eb8996c152099c6f4af8df96358383200c36.jpg
Old data…
The data you might produce could be very old! You have 4.5 billion years to choose from! Why is making that choice so difficult for you, VooDude?
https://uploads.disquscdn.com/images/ad8887d0b592fd0e4d5d55535894d0303ff78d4aceb125c770ea700cb0b0a8b5.jpg
It is nice to see that, even GRACE shows a recent gain in ice.
GRACE is the best gravity satellite we have, but GRACE couldn’t find its own asses using both hands. (The Terrestrial Reference Frame issue, and 1cm orbital accuracy isn’t enough)…
https://uploads.disquscdn.com/images/f1fcdc4b04bc7f4ce1e5774b653c2a17ef4f2b9083ef4e49bffef0de0db2ff44.jpg
❝… Antarctica … we see an ice gain that exceeds the losses in the other areas.❞
http://www.nasa.gov/feature/goddard/nasa-study-mass-gains-of-antarctic-ice-sheet-greater-than-losses
…and you cross out the negative number and add an arrow pointing up!!! No pumpkin, GRACE shows a decline in ice. No amount of photoshopping is gonna change that. Now why are you running like a coward from my question? When did some other climate driver override the warming effect of CO₂?
https://uploads.disquscdn.com/images/147e2c9db47cb45e06ced1ef3b9926e243c177958a672d8adb1e722a0900242e.png
Previously, warmer ocean waters have melted Greenland’s glaciers on-contact. Now, many glaciers have retreated away from direct contact with the oceans, (which reduces the influence of “warmer” water). Now, only the air temperature has a bearing on the ice. As we all know, but some of us won’t acknowledge, average global air temperature hasn’t been “warming” (RSS, UAH).
Recent observations have stated that the ice is no longer reaching the sea: “…the fact that most of the glaciers are land terminating…” (Sutterley, Tyler C., et al. 2014, “Evaluating Greenland…”). In the summer of 2008, observations indicated this was not the case, then: “The recent rapid increase in mass loss from the Greenland ice sheet … cause of this acceleration is increased melting at the ice–ocean interface” (Straneo, Fiammetta, et al. 2010 “Rapid circulation of warm subtropical waters in a major glacial fjord in East Greenland.” Nature Geoscience)
Greenland, Arctic “report card” https://uploads.disquscdn.com/images/a06d6daadcb3ce400fc4714f0cb3eb8996c152099c6f4af8df96358383200c36.jpg
And no pointing to any analysis of your claim about “altered data”…
Satellite data denier.
Elementary school students are taught the hydrological cycle. You know, the cycle that includes cloud formation.
”Most models are a within a factor of 2 of the observed means.” Double, or half, depending upon your viewpoint.
https://uploads.disquscdn.com/images/022c4cb56f767fec949dadcea190fad9fc152cc95e8cba42cbe595c9017188c3.jpg
Wyant, M. C., et al. 2015 “Global and regional modeling of clouds and aerosols in the marine boundary layer during VOCALS: the VOCA inter comparison.” Atmospheric Chemistry and Physics
http://www.atmos-chem-phys.net/15/153/2015/acp-15-153-2015.pdf
So, models just can’t do clouds, but clouds are very, very important. Clouds have a major role in the earth’s albedo. Stephens 2012 shows how less than a percent change in clouds, has an effect that is larger than all of “Global Warming”. Models’ clouds are somewhere in the 50% to 200% range, a factor of two… yet, the required accuracy is ½%
https://uploads.disquscdn.com/images/b59016cbdca367691c49fdf3586cdfe4a073a3d37cbfcc62a220c196aaad842a.jpg
The IPCC knew… (kinda like the recent ExxonMobil “what did they know, and when did they know it…):
https://uploads.disquscdn.com/images/3072dad2692617fe2b3862d3d8df11a4001fa28e77541b2f93af1dbdba171ff1.jpg
Trenberth 1999:
https://uploads.disquscdn.com/images/83ddc3dd5736591296c1408727265451a363a56fe80d138de8833e080adc104d.jpg
The hydrological cycle transports heat aloft via evaporation and advection of latent heat. Just in this one parameter, ignoring the albedo effect of clouds, Stephens 2012 tells us that the transport of latent heat is not adequately covered in the “energy budget”…
https://uploads.disquscdn.com/images/b9a1014e82f4733bcb23f6bd08db39eb012c1a61b96a27dbd4f98d6bac0042f6.jpg
Clouds cool the earth, and form, preferentially, when the sea surface temperature rises above a particular value. However, clouds also interfere with infrared transfer, much as greenhouse gases do. How well do the climatologists understand the infrared interference of clouds? Piss poor. Discounting the albedo effect, discounting the latent heat effect, the inaccuracy of “knowing” the value of the long-wave (infrared) effect is way too large to support the “energy budget” of ¾W/m^2 of “Global Warming”:
https://uploads.disquscdn.com/images/928cbff5932793c5cdc98b3da4b74a287e33b1ad500c0c35440492d91c7706d1.jpg
The transport of sensible heat is part of atmospheric convection – which is driven by cloud formation, part of the hydrological cycle. Ignoring the Albedo, the Latent Heat, and the Long-Wave cloud effect – so, assuming that the climatologists have those things absolutely correct (which is patently false) … the whole idea that the earth is warming at ¾W/m^2 is totally unsupported by this: https://uploads.disquscdn.com/images/8ee8ea0a2f5d26642f62ea03006582626f7059fc95ebb3b88cb1c6e8769b70d1.jpg
In fact, the “energy budget” is chock-full of holes. Just the basic “warming”, which Stephens 2012 pegs at 0.60W/m^2, has a tolerance:
https://uploads.disquscdn.com/images/6b3164d31dd9e4f472d8a6363b7523a3d14ad7a0296f4ec8ee0b6179b8573ba5.jpg
The models’ performance, back in the CMIP3 days, was worse than abysmal:
https://uploads.disquscdn.com/images/68cc1628cb22ba106d1ee017efdd85196a3736fb0311bd4d700e169a4dbab25f.jpg
Nice slideshow, perhaps we’ll see it published.
Where did you borrow it from?
https://uploads.disquscdn.com/images/4235cb36c62d482c707e83481e32e5964e1a94b38b0a59ea619650223d57fbce.jpg
The data are altered.
And a cartoon for a response…..
I think images are a very effective way to get a point across, actually, even if it’s just a graph! VooDude does tend to go overboard though, to be sure. It’s like sundried tomatoes: A little goes a long way.
https://uploads.disquscdn.com/images/9c02c6dfe138d4a53d73958eae52c316cea763060e068230e4f81f09fc84dda3.png
That Rules for Radicals bit is funny. It seems the number one distributor was Dick Armey giving it to his FreedomWorks minions, sort of as here’s what works, maybe we can use similar methods. The earlier Cato Institute suggested use of “Leninist” propaganda (and implied soft sabotage) was at least reworded into the 1996 Newt Gingrich/Frank Luntz GoPac memo (to hide its communist tactics, maybe) “Language: A Key Mechanism of Control”
Instead of going to all that work disguising the origin, Armey blames Saul Alinsky for using the tactics, while making sure his people know what the tactics are so they can use them, too.
Good analysis! Thanks!
Yes, Kent makes a valid point, you would should probably get your language light e.g. “tamperature datasets” is either an incorrect spelling or an embarrassingly bad pun to include in a ‘serious’ scientific discussion.
Very accurate pun actually.
And not a single source. Not a single example… Wonder why…
“other forcings in the opposite direction.”
Five datasets are cited. Try learning to read.
“Try learning to read” indeed.
“other forcings in the opposite direction.”,
List them.
Show us the range the research has found
You know; support your claims. Like 7th graders know to do: best resources, quotes, citations.
How to Evaluate Resources
The CRAAP Test* is a useful guide to evaluating resources. CRAAP is an acronym for the general categories of criteria that can be used to evaluate information you find. Use the CRAAP Test to decide if information is appropriate for your research! See also Evaluating Information from a Citation
CRAAP
Questions to consider
Currency
When was the information published or last updated?
Have newer articles been published on your topic?
Are links or references to other sources up to date?
Is your topic in an area that changed rapidly, like technology or popular culture?
Relevance
Does the information answer your research question?
Does the information meet the stated requirements of the assignment?
Is the information too technical or too simplified for you to use?
Does the source add something new to your knowledge of the topic?
Authority
What are the author’s credentials?
Is the author affiliated with an educational institution or prominent organization?
Can you find information about the author from reference sources or the Internet?
Do other books or authors cite the author?
Accuracy
Are there statements you know to be false?
Are there errors in spelling, punctuation, or grammar?
Was the information reviewed by editors or subject experts before it was published?
What citations or references support the author’s claims?
What do other people have to say about the topic?
Purpose
Is the author’s purpose to sell, persuade, entertain, or inform?
Is there an obvious bias or prejudice?
Are alternative points of view presented?
Does the author omit important facts or data that might disprove the claim?
Does the author use strong or emotional language?
https://www.gettysburg.edu/library/research/tips/webeval/index.dot
Research Process Rubric – Middle School
https://www2.uwstout.edu/content/profdev/rubrics/middlelschresearchrubric.html
The five datasets are plainly cited. And if “Robert” is unaware that “mainstream” science has tried to blame the Pause on two dozen mutually inconsistent types of forcing that are said to countervail against the supposedly large forcing from CO2, then he has only to read the second of my two papers in the Science Bulletin of the Chinese Academy of Sciences, where he will find 25 such papers listed. That, and not in a blog infested by climate Communists, is the place for citations.
Then it should be no problem quoting yourself . Where you list the “other forcings in the opposite direction.”,
And ideally, the levels of these forcings.
You know. Like how thr IPCC does in the fig 5 SPM
http://www.climatechange2013.org/images/figures/WGI_AR5_FigSPM-5.jpg
Asked and answered. And where is the evidence that the forcings listed in IPCC’s chart, which differ in major respects from earlier such charts, are accurate?
Ah.. countering with an new, different, unsupported assertion…
We want to give thanks for the continuation of posting unsupported assertions, it helps show the denialists’ lack of science.
“differ in major respects ”
When I refer to the earlier IPCC graphs, I expect people not to tell me that my assertion that there are major differences between the earlier graphs and the present graph is “unsupported”. It is supported by simply looking at the 2007 and 2013 versions of the graph of forcings. Do that, and go figure.
The term “forcing” is intended to give the impression that man’s CO2 is somehow “forcing” the climate to do something it otherwise wouldn’t. Make no mistake, these creeps use linguistics like that. They will NEVER admit that, either.
Can’t fool smart people like you
Should have added a /s. Here on climdep, some people don’t always get it without a sign.
Let me guess, your real name is Billy-Bob, Timmy-Ray or Bubba-Joe
https://uploads.disquscdn.com/images/420c4f791ce12d082973843623fcb9108d1f4c009a08339cd8f752584cefd3e5.jpg
… use the forcings…
Good lord when will this new facism end!! The worst president ever…the biggest science swindle of all time! Feels like life in a fun house when our president says this is the greatest national security threat, where his administration purposely and flagrantly use almost every federal resource to breach the Constitution and make a mockery of this proud , generous, beacon of liberty that so much blood was spilled for. People, I know most of you are like minded, but this is not just the misuse of science on the line, it’s something that makes the conspiracy theorist seem like the credible historians
The point we have been at for decades now is that even Exxon, like Big Tobacco et al, before it, KNEW of the dangers and used profits to fund criminal sociopaths to mislead the public on the science. Even Exxon and the Koch bros with unlimited resources have been unable to produce a credible study that disproves man made climate change. In fact, both of their studies came to the same conclusion as the consensus.
The only thing they have left is to attempt to create doubt; which takes time away from creating viable methods for mitigation, adaption to lessen the damage that is coming. Intentionally delaying the process for mitigation and adaption, so that fossil fuel boys can extend their profits, is a crime that will affect people, countries and economies.
“Doubt is our product, since it is the best means of competing with the ‘body of fact’ that exists in the minds of the general public. It is also the means of establishing a controversy.” — Brown & Williamson
Lying dip. Fossil fuel companies are not responsible for society using fossil fuel. Creeps like you are just trying to demonize them so we’ll accept your harsh tax-and-spend punishments.
Won’t work, fool.
Watch your back.
That’s jest plain bad advice, ah done gone and hurt ma neck!
Any fossil fuel company intentionally and knowingly obfuscating research into climate change constitutes criminal negligence and malicious intent at best, and a crime against humanity at worst. The Department of Justice has a moral obligation to prosecute Exxon and its co-conspirators accordingly.
This scandal—traveling under the hashtag #exxonknew—is just beginning to build. The Inside Climate News series of six pieces is set to conclude this week and be published as a book, but the LA Times apparently has far more reporting waiting to be released.
The investigation truly came home, when the The Dallas Morning News—read across the oil patch and hometown paper for Exxon—put the ICN investigation on its front page.
Bring on the RICO charges now.
http://www.dallasnews.com/business/business-headlines/20151004-qa-former-exxon-scientist-on-oil-giants-1970s-climate-change-research.ece
And it’s totally meaningless.
Yes, Apparently far right wingers think the lives of people on earth is “meaningless” as long as there is money to be made.
YOu still haven’t cited a single relevant quote… I’m waiting. Point me to a single smoking gun.
Oh, you must be confused. I’m not trying to convince you. That would be futile. I hope you rot in hell. I’m trying to show others the evidence.
If you’re a hardcore climate change denier, it must be rather demoralizing to learn that ExxonMobil’s own scientists expressed contempt for your views behind your back. If you’ve lost ExxonMobil’s own scientists, you’ve lost the scientific debate.
You aren’t showing any evidence moron. That’s my point. You keep posting the same two meaningless links. You wouldn’t know science if it bit you in the nose.
You are really stupid to think that some right wing blogger can disprove man made climate change, when even Exxon with all it’s resources couldn’t.
You have got be even more stupid to think you have some kind of credible study from some right wing denier blog that will disprove man made climate change, and yet you can’t get funding from Exxon to publish in some credible scientific journal.
There is no hard evidence of CAGW – not then, not now. There is only conjecture, which carries no weight in court. I say bring ’em in to court on both sides – Exxon, Tom Karl, Jag Shukla – under oath and cross examined. Get the truth out. End of the day it will be Karl and Shukla and a few others on trial for treason. And how sweet that day will be.
But they just want to think they are saving the world. Is there anything wrong with that ?
Not a bit – as long as they are not stealing my money and weakening the national security of my country to do it.
So, Exxon knows you are full of BS, yet you don’t?
“…no hard evidence…
. . .
…will be.”
No doubt Exxon with all their lawyers can tie this up for years, just as tobacco did. But with the former Exxon scientist coming forward along with the documents, the noose is tightening.
“Internal Fossil Fuel Industry Memos Reveal Decades of Corporate Disinformation” The fossil fuel industry—like the tobacco industry before it—is noteworthy for its use of active, intentional disinformation and deception to support its political aims and maintain its lucrative profits. The following case studies show that:
http://www.ucsusa.org/sites/default/files/attach/2015/07/The-Climate-Deception-Dossiers.pdf
The tobacco cases also set precedent, the exxon case may go a bit faster what with the data collected, the world view, ….
With tobacco there were millions of deaths each year, both smokers and non smokers, which provided hard data showing the difference between smoking and not smoking. There is no such thing with cli sci. There is no parallel universe earth with no human fossil fuel emissions to compare. Thus conclusions are conjecture only – no real data to point to. Cli Sci claims against Exxon will be laughed out of court so fast it will make even your thick head spin bobby. Cli Sci is just another ridiculous cult religion.
Sorry, but we have nearly two centuries of research spanning the globe and spanning millennia. Science done by scientists working in countries around the world. Data and its analysis that is accepted by virtual every scientific organization and government .
Your claims, on the other hand, are good examples of rhetoric. Blog inspired rhetoric. Thanks for showing us how thinon science the denialist position it.
Hell of a lot of good money wasted on this crap, that’s for sure. The only thing those wasted dollars have done is create a swarm of leeches that suck down ever more public funds to create more leeches. Time to call the exterminator. His name is Trump. It’s gonna be a great show, get some popcorn and enjoy!
Thanks for yet another set of unsupported assertions.
Please continue showing us you (and so many other denialists) don’t have a working sense of what is taught in terms of intellectual rigor and honesty:
Evaluating Information
How to Evaluate Resources
The CRAAP Test* is a useful guide to evaluating resources. CRAAP is an acronym for the general categories of criteria that can be used to evaluate information you find. Usethe CRAAP Test to decide if information is appropriate for your reserch!https://www.gettysburg.edu/lib…
Research Process Rubric – Middle School
. . . .
0 points
Presented content which was unfocused, poorly organized, showed little thought or effort and lacked supporting evidence
https://www2.uwstout.edu/conte…
True and they can’t claim that they didn’t know about the dangers of burning fossil fuels and man made climate change.
Very true….
Seems the real, hopefully fully prosecuted, conspiracy. Perhaps (I think) 7 non-political investigations to match the political ones they tried to create doubt about East Anglia with.
Yes bring on the RICO charges against this current administration and their czars. Been lied to by O, one too many times.
This has been the most current and transformative set of IPCC projected vs actual data comparisons that I have seen to date. The fallacy of the IPCC’s recent (AR-5) warming projections of 2.5-4.5 degrees/century are still shown to be gross over-estimates and the obvious conclusions imply that much of our current “climate angst” is being driven by a false narrative that threatens our emotional and existential security on a daily basis.
Which would all be very well if the evidence wasn’t stacking up to show that climate change continues:
Here is a recent graph showing the rise in average global temperatures provided by NASA:
http://climate.nasa.gov/vital-signs/global-temperature/
How can anyone be so ignorant? Even Exxon knows your BS is just BS!
The heat is hiding deep in the ocean depths…..like Godzilla. We are doomed.
No. They will scream louder and adjust the surface temperature record some more…. just like they always have done.
They can’t adjust it anymore and everyday the projections get further away from the observations. At some point it will be clear to everyone that their is no runaway warming. I think when the Arctic sea ice is back within 1sd then this thing is over. The Arctic sea ice is the easiest way for everyday people to see that nothing is happening. Within five years CAGW will be a punchline and Gore, Hansen, and their ilk will be completely discredited.
Interesting to read your statement that Arctic sea ice is the easiest way for everyday people to see that nothing is happening.
Here is a graph showing the retreat of arctic sea ice:
https://nsidc.org/images/arcticseaicenews/20111004_Figure3.png
And here is a graph showing how fast that is outstripping IPCC predicted ice retreat:
http://nsidc.org/icelights/files/2011/02/Decline_chart.png
Chart looks a couple years old. Dont worry the rebound continues.
I’ve added links to graphics to support my points.
If you feel that arctic ice is on the rebound, a link to some data or graphics would help you demonstrate that this not the product of a fevered imagination.
Piomass… dmi nsidc for that matter. Use an up to date one.
Thanks, that’s most useful
http://psc.apl.uw.edu/wordpress/wp-content/uploads/schweiger/ice_volume/BPIOMASIceVolumeAnomalyCurrentV2.1.png
Suggest coming back in 10 years time that you can make a more valid point that an undisputed observation that short term variability exists….. see also 1982 to 1986.
3 years of solid growth… even though we are in the middle of an El Nino.
1980 to 2010 is also short term variability… following massive global cooling from 1940 to 1975.
And if you look at the chart, we’re exactly as we were in 2007 so it’s also 8 years of no ice loss and Antarctica growing strong.
Oh goodie, lets play pick the cherries.
1982 – 1994 = 12 years no loss
2996 – 2003 = 7 years no ice loss
2007 – 2015 = 8 years no ice loss
Hey, even better lets add them up, so in a 35 year period we have 27 years of no ice loss, or put another way, only 8 years of ice loss.
Clearly this is an accurate reflection of what the overall graph tells us.
Please don’t interpret this as serious and start spreading it as a meme!
You just explained how there are roughly 60 year cylces in temperature… Now you are focusing on 30 years with ice…. We’re at the bottom of the cycle… And record ice growth in the South Pole. cognitive dissonance much?
Why doesn’t your graph include satellite data from the early seventies?
I’m thinking its because……
“The passive microwave sea ice record dates back to 1979, one of the longest environmental data sets we know of.”
http://nsidc.org/arcticseaicenews/faq/
Feel free to make a point anytime you feel like it.
The people that wrote the 1990 I.P.C.C. report felt that the early seventies data was important….they included it in their report. It shows that the ice extent was as low as it is today in the early seventies.
Well this is the only IPCC (or any) reference I can find to earlier 1970 ice which doesn’t seem to bear that out.
https://www.ipcc.ch/ipccreports/tar/wg1/images/fig2-14s.gif
Feel free to link to something that proves your statement is not wonky memory spit or a product of your imagination.
https://stevengoddard.files.wordpress.com/2014/07/screenhunter_1445-jul-30-09-15.gif
…
OK, that’s better.
So if you look at the lowest point on the graph approx 1974 it looks like the ice extent was slightly lower than any of the points between 74 & 89.
However if you compare this with the ice retreat post 1989, your statement about the ice extent in the early 1970’s being lower than today’s is demonstrably incorrect:
http://psc.apl.uw.edu/wordpress/wp-content/uploads/schweiger/ice_volume/BPIOMASIceVolumeAnomalyCurrentV2.1.png
The reality is that your graph starts with a year of peak ice. If it started in the early seventies then the trend would be flat.
Which is exactly why I suggest that anyone reading this compare and contrast the graph I linked to with the one you linked to in order to squeeze in another 6 years.
Taking the two graphs together covers the whole period you raise, and clearly demonstrates that you are talking nonsense.
Not so.
https://wattsupwiththat.files.wordpress.com/2012/03/arctic_sea_ice_1971-2012_c2day_and_ipcc.png
Drat, you got me there, I thought we were doing something fair like comparing like for like.
Soooooo, if you are deluded or deceitful or intellectually challenged enough to compare SUMMER ice in 1974 with WINTER ice in 2012 in order to scrape together the festering bones of an argument that there is no evidence of warming….
…. when to anyone with eyes to see its clear that your graph shows the consistent decline of Arctic sea ice over a quarter of a century, then there is little that any rational person can say…..
…. other than to observe that comparing snowballs with sun cream is unlikely to provide any sensible answer.
Well again no, because despite the fact that in his argument Mr Monckton is cherry picking cherry picked cherries, he then has to go on and admit (and you can almost hear the embarrassed “er” and shuffling of feet)….
“From next month on, the Pause will probably shorten dramatically and may disappear altogether for a time. However, IF there is a following la Niña, as there often is, the Pause MAY return at some time from the end of next year onward.”
Even when he turns his back to the other data sets and shouts blah, blah, blah I can’t hear you he knows that his argument if failing.
However, never one to let reality get in the way, Mr Monckton immediately suggests ignoring any such rise as a short term blip, presumably even while he still grips in desperation to 1998 as a reflection of the norm.
Nothing to be embarassed about at all. Except the failed models. The surface temp record is nothing but an exercise in confirmation bias
The surface temp record is nothing but an exercise in confirmation bias….. except that THE surface temperature record is actually four surface temperature records prepared by four independent organizations in three different countries all of which are mostly arriving at similar conclusions:
http://skepticalscience.com//pics/temp_disagreements.png
No. They are four different tweaks to the same data.
So four independent groups of climate scientists independently evaluate the same raw data and independently come to very similar conclusions ….
….. and you think that this is evidence of what exactly?
Confirmation bias. All adjustments. Past colder. Present hotter.
Why the divergence from the satellite data?
One possible reason is that they are looking at different things, the four data sets are records of surface temperature, the RSS is lower troposphere i.e. one part of the atmosphere.
What is interesting is that the four surface temperature data sets give pretty close readings even though they were prepared by different organizations some of which are in different countries:
http://i.imgur.com/sMM62OM.png
1940 used to be a lot hotter than 1980. What happened. See hansen et al. 1981
If you expect a response then please provide a link to whatever is twisting the elastic in your undergarments.
Well no, because Mr Monckton is using a highly selective presentation of information to distort the overall picture.
Note that he says, “The UAH dataset shows a Pause almost as long as the RSS dataset.”….. but does not show you the actual data, this is for the simple reason that its clear to anyone looking at it that the UAH data set shows warming across the period during which Mr Monckton categorically states in his banner headline that there has been NO WARMING:
He for anyone interested in reality and not ideological illusion is the missing graph:
http://woodfortrees.org/plot/uah/from:1997/to:2015/plot/uah/from:1997/to:2015/trend
Get real.
I don’t know how much realer I can get than providing a link to the data.
Feel free to reciprocate when you have something to say worth hearing.
The ice is rebounding. Of course the graph that you provided doesn’t show the last couple of years and it doesn’t show the 1970’s. So it is just a cherry pick.
Feel free to fill in the information that supports your side of the argument.
Just read my past posts.
Read your catalog of past posts?
Frankly I’d rather have my genitals waxed.
If you can see the point in an exchange of views then put forward a position and back it up with some sort of evidence…. as you did with the ice graph.
Sorry to hear about your warts. Thanks for sharing.
For that matter, I would rather have genital warts than read your back catalog!
Thanks for not sharing!
Apparently your wish came true.
Seriously……. I’m feeding you insult gold here and that is the best you can come up with?
You might at least have a go at a bad pun, how about Wartsupwiththat?
…… or AGW …. alarmist’s genital warts…..
Frankly your pithy retorts are as flat as the temperature trend and earth surface you would have us believe in.
https://stevengoddard.files.wordpress.com/2014/07/screenhunter_1445-jul-30-09-15.gif
You say, that my graph doesn’t show rebound, yet present a graph with a 1990 cut off in isolation.
Here is the most up to date graph I can find:
http://psc.apl.uw.edu/wordpress/wp-content/uploads/schweiger/ice_volume/BPIOMASIceVolumeAnomalyCurrentV2.1.png
I see natural variation, but think its a bit premature to describe this as a full on recovery.
http://nsidc.org/data/seaice_index/images/daily_images/N_bm_extent_hires.png
And here is a similar image with some context.
This one was taken Sept 11 – 2015.
The ice extent on that day was the 4th lowest since 1979, the year when satellite recording began.
https://nsidc.org/news/newsroom/2015-arctic-sea-ice-minimum
I’m not really sure how that fits in with your idea of a dramatic long term rebound.
As I have shown the satellite record goes back to the early seventies.
Er….. not yet you haven’t!
You might be correct, but all you have shown is that a record of some sort exists for the early 1970’s.
The graph that you linked to shows two data sets stitched together at 1979, with a fracture suggesting that they are not fully calibrated against each other.
https://wattsupwiththat.files.wordpress.com/2012/03/arctic_sea_ice_1971-2012_c2day_and_ipcc.png
Look closely at that join and tell me that the data is a good fit.
It is not a record of some sort. It is the satellite record that was in the 1990 ipcc report. That is a fact.
OK, lets go with that.
Your graph shows two satellite data sets that for some reason (format / calibration / advances in technology?) don’t quite fit comfortably together.
The earlier set shows level or even rising ice extent followed by a period of protracted decline.
So what caused the rise?
So now your are going to argue over the details while missing (or denying) the big picture. The ice is the same as it was forty years ago. Deal with it.
Summer – Winter
Summer – Winter
Summer – Winter
Small – Far Away
Small – Far Away
Small – Far Away
https://www.youtube.com/watch?v=dS12p0Zqlt0
And now your true colors are shown.
Yeah the ice melts every year.
Yes …. and?
And it freezes back every year. There is no long term trend that is driven by CO2. If there was then how could the ice rebound when CO2 is at a record high.
And that is probably the closest we will come to agreement.
It is very unlikely that there will be any rebound, what has happened within the past few years is within the limits of the type of natural variation that can be clearly seen on the records dating back 25+ years.
If you came back in 10 years and the ice was still growing, you would have a strong argument, but at present you have nothing.
The whole thing is within natural variation. Which is why the volume was just as low in the early seventies or the thirties. Think about it.
If you really, really, really think that you can compare summer ice in 1974 with winter ice in 2012 then you are not competent.
I hope for your sake that you don’t think that, and this is an elaborate joke. One way or the other, my part in our ‘conversation’ is at an end.
The truth hurts. You should be happy that there isn’t a crisis.
You win.
We have entered a zone were basic laws of reality no longer apply.
I can’t raise any argument against a comment stupid enough to look at a sheep and insist its a piece of candy floss.
Calling me names won’t change the fact that the ice is still there.
Even Exxon knows that’s BS.
The point we have been at for decades now is that even Exxon, like Big Tobacco et al, before it, KNEW of the dangers and used profits to fund criminal sociopaths (like the authors) to mislead the public on the science.
Someone should tell the Arctic sea ice that refuses to melt.
Looks like it is melting just fine to me. Even Exxon knows that.
No it is actually rebounding and it is at the same level as forty years ago.
It’s tough on the sociopath deniers with no values that don’t care about the lives of others and want to create doubt on the science, when even Exxon is calling BS on you. Hope you all rot in hell.
You don’t know anything about me.
See for yourself:
http://nsidc.org/data/seaice_index/images/daily_images/N_bm_extent_hires.png
Cool pic, must be from one of NASA’s satellites right? Amazing how they can do that science stuff. Let’s see what your source has to say about the melting of the Arctic.
“Through 2015, the October sea ice extent has declined 6.9% per decade over the satellite record.”
http://nsidc.org/arcticseaicenews/
Even Exxon knows your BS is just BS. 🙂
You’re thick the ice was just as low in the early seventies or the thirties. It is cyclical. It has nothing to do with CO2 levels. Do you have any idea just how cold it is up there?
It’s never been about the science, even Exxon knew that. How can anybody be so ignorant to think that if Exxon et. al. could not overturn the science with some credible alternative that “a right wing blogger” can with some right wing pseudo science from a right wing blog? Exxon would pay you billions to help fund and publish a credible study that disproved man made climate change.
If anyone has some credible study that will disprove man made climate science, they would have no problem getting funding from Exxon et. al. to complete the study and publish it in credible journals. That research would be worth billions maybe even trillions to the fossil fuel boys.
Hell, even the Koch bros tried funding a legit science study to overturn the science – and failed – only to prove that the science was right all along. (The BEST Study)
How can anyone not know that? The deniers are just immoral people with no values that are willing do people harm, even let people die, as long as there is profit to be made. These people are the most vile among us, with no motivation other than greed and profit.
http://insideclimatenews.org/content/Exxon-The-Road-Not-Taken
zzzzzzzzzzzz
This makes the climate cultists sound like a broken record……
Its good that on occasion we can agree!
Warming is continuing…..
https://www.google.co.uk/search?q=japanese+meteorological+agency+temperature+graph&espv=2&source=lnms&tbm=isch&sa=X&ved=0CAcQ_AUoAWoVChMI5KiTxKD8yAIVizsaCh3q6wv2&biw=1202&bih=805&dpr=0.9#imgrc=hHYH8yhngdIrMM%3A
Warming is continuing…..
http://www.giss.nasa.gov/research/news/20110112/509796main_GISS_annual_temperature_anomalies.gif
Warming is continuing…..
http://www.metoffice.gov.uk/media/image/m/p/compare_datasets_hadsst3_logo_large3.png
Warming is continuing…..
https://www.ncdc.noaa.gov/sotc/service/global/global-sfc-radiosonde-temp/201001-201012.gif
Warming is continuing…..
http://www.woodfortrees.org/plot/uah-land/from:1980/to:2015/mean:12/plot/uah/from:1980/to:2015/trend
Warming is continuing…. etc.
Yes we have been warming since the end of the Little Ice Age in the late 1800s that started well before the broad use of hydrocarbons. We are not warming at a faster rate than any of the previous warm periods (Holocene Optimum, Roman Warm, medieval Warm) since the end of the last great ice age around 12,000 years ago. In fact we are cooler than those previous warm periods. The Earth is always either warming or cooling, it is rarely static and unchanging. Just because it warms doesnt mean it was caused by man, it is what our planet does. Do you see any periods of unchanging temp on the graph below?
It’s never been about the science. Even Exxon knows your BS is just BS. Monckton is a paid killer for the fossil fuel boys.
Lord Monckton’s Rap Sheet
https://bbickmore.wordpress.com/lord-moncktons-rap-sheet/
JMAC it is not BS, it is factual do a little research for yourself about historic temperatures throughout the Holocene (last 12,000 years). Look how warm it was during the Holocene optimum compared to today, and not related to CO2. Or go farther back and look at temp variations since we entered into the great ice age 800,000 years ago. Look how warm it was during the last inter-glacial period (EEmian). It was 3-4 degrees warmer than we are currently and it wasn’t due to CO2, it was natural. So we are being told that recent warming is unprecedented when it isn’t even close to the truth, the whole subject has been politicized. I don’t endorse Monckton any more than I do AL Gore. I have a brain for myself and can research for myself, plus degrees in Geology and Geophysics and I have studied past climates for over 30 years. We cant make a judgment on 100 years of highly adjusted temperature data when our earth has 5 billion years of constant change. 40 or 50 years of warming consistent with past warming is no more significant than 40 or 50 years of cooling.
BS even Exxon knows your BS is just BS.
prove me wrong instead of just typing an idiotic response. Is that all you got?
Better question. Why would anybody bother with your BS when even Exxon knows it’s BS?
Couldn’t see a graph below.
That aside, there are elements of truth in what you say but a lot of effort has been expended in the years since Callendar suggested the idea of AGW in the late 1930’s to unpick natural and anthropocentric strands of climate change. Your blunt assertion is starkly contradicted by almost every major scientific institution on Earth.
Here is NASA on the Scientific Consensus:
http://climate.nasa.gov/scientific-consensus/
Note their links to other organizations that agree with their position.
My assertions on past Holocene & ice age temperatures are fact, just research temperature reconstruction from ice core data, it is extremely well accepted science. Research the Roman and Minoan warm periods as compared to today. The so called consensus doesn’t change what I stated, it is accurate. My point is the Earth’s climate is and has always been highly variable, and much more than what we see today. I maintain the recent 20th century warming is dominantly natural as it started before the broad use of hydrocarbons, but I don’t deny mans activity has had some influence on that warming and we should continue to stride to reduce our impact on the planet. On top of that there are multiple factors that influence warming/cooling on our planet including Green House Gas, Earths orbit/Milankovitch cycles, Solar Irradiance, Ocean currents (PDO/ADO), winds, dust, volcanic activity, etc. CO2 is 400 ppm (0.04%) of our atmosphere and mans contribution is roughly 5% of that, and the computer models that predict warming are continually overstated because they rely too much on the influence of CO2. Its almost impossible to solve a complex equation with so many variables. Look at this article http://dspace.mit.edu/handle/1721.1/89054 from MIT Earth, Atmospheric, and Planetary
Sciences and it is examining computer projections of warming vs the satellite temperature data. In summary it says the models overstate heating. Also when they remove other natural factors from the recent satellite temperature data, specifically volcanic cooling and El Nino warming there is virtually no warming shown since 1993 (Figure 1 C). This article is also co-authored by NASA/GISS with the aim of trying to explain why there has been no significant warming in the L. Troposphere since the late 1990s despite rising levels of CO2, and that is a fact. And finally consensus doesn’t change the debate, the foundation of science is debate, especially a subject as complex as out earths climate. True science is never settled, as Einstein said ” No amount of experimentation can prove me right, a single experiment can prove me wrong”.
Thank you for putting in the effort to make a serious point. As its a complicated subject, I’ll break my response into a series of posts:
CO2 is probably the best place to start. The amount of natural CO2 in the atmosphere is roughly in equilibrium i.e. the amount being generated closely matches that absorbed.
http://www.esrl.noaa.gov/research/themes/carbon/img/carboncycle.gif
Your observation about 5% human generated CO2 is WILDLY misleading. The figure is not fixed, instead human beings are adding a (relatively) small amount of CO2 each year that gets added to and builds up in the system.
This graph by NASA shows nearly half a million years of a carbon cycle that rises and falls though approx 110ppm repeating approximate every 100,000 years. Then right at the end, (the part that is alarming scientists) …. in less than 50 years human activity has almost doubled the range of variation and reconfigured the atmosphere in a way that has never been encountered by human beings.
http://climate.nasa.gov/system/content_pages/main_images/203_co2-graph-080315.jpg
What is more alarming, is that this line is set to keep rising.
Any scientists who can look at the NASA chart and advise with a straight face that this is not a potential concern is not telling you the truth. This concern is real and it is not new. In 1965 scientists were already delivery the following prescient warning Lyndon Johnson:
“Through his worldwide industrial civilization, Man is unwittingly conducting a vast geophysical experiment.”
I appreciate the discussion. Your chart goes back only 400,000 years which does encompass humans on this planet, but is a small fraction of earth’s history. But I agree what man has put in the atmosphere is in addition to the natural carbon cycle, and how it behaves after that point is really not well understood, but 400 ppm is not unprecedented (see below). One other human factor is the vast deforestation that has occurred particularly in the rain forests, and would of had capacity to absorb additional CO2, but you don’t really hear much about that side of the equation. My point is that 20th century warming is consistent with cyclical recent warming periods of the Holcene, and is less in magnitude and equal in slope/rate; so to place the warming on man alone is not logical. What would you say was the cause of recent (last 10,000 years) past warming and cooling events? Are those factors still in place today? What was the cause of the extreme warming at the end of the last ice age when temps rose 13-15 degrees C and sea level rose 300ft, and caused vast ice sheets to retreat to the poles? That was only 12,000 years ago, a virtual blink of the eye in geologic time.
But also keep in mind that the temperature effect of CO2 in the atmosphere is logarithmic, not linear. There are many technical papers that support this. So the first molecule of CO2 in the atmosphere has a greater heat absorptive capacity than the second, and so on. If it were linear the earth would have overheated long ago when CO2 was much higher than today, and if CO2 was the only driver of heat. The chart below (i hope it shows thru) goes back 600 million years when CO2 was well above 1000 ppm, and there is a disconnect between heat and CO2. Also note how low the CO2 concentration is now as compared to the last 800 million years. Graphs in regards to this subject can be very misleading as it really depends on your starting point. Here is a link to my graph if it doesn’t post.
http://www.paulmacrae.com/wp-content/uploads/2008/06/co2-levels-over-time1.jpg
I ran across this article a few months back and I found it very interesting. It is from the Program for Climate Model Diagnosis and Intercomparison (PCMDI) at Lawrence Livermore/MIT and GISS (no lightweights). Title is :” Volcanic Contribution to Decadal Changes in Tropospheric Temperature” by BD Santer et.al. The goal was to compare climate models to the satellite temperature records, but after statistically removing the ENSO and volcanic events that have a strong influence (positive and negative) on global temps over that time.So basically they were looking for temp trends from GHG, and other factors. Figure 1C on page 22 shows the satellite LT temp trend with ENSO and volcanic events removed (~1degreeC/100 years), and shows no warming since 1993. One of their conclusions is ” We show that climate model simulations without early 21st century volcanic forcing overestimate the tropospheric warming observed
since 1998.” I found this article very significant but rarely have seen it referenced. Any thoughts or comments?
Here a link to the article http://dspace.mit.edu/handle/1721.1/89054
Never referenced because it doesn’t fit with government propoganda.
I do wonder for how much longer the CAGW zealots will be able to keep presenting their ‘science’ as fact in the face of overwhelming evidence to the contrary. Sooner or later even they will have to realise the game is up and the ruse has been rumbled.
I dunno, with the likes of the BBC’s pro-CAGW hive-mind mentality (and most other msm in the western hemisphere at least) perhaps they’ll get another five years out of the deception. Another five years of stealing taxpayer’s money to fund their on-going research into faeries and unicorns. It defies all common sense.
Which might be a valid question if Mr Monckton was showing the whole picture (i.e. telling the truth), but he is choosing a single data set showing just one part of the atmosphere and playing down the parts which don’t support his viewpoint.
Here is NASA’s take on whether or not the world has warmed since 1998:
http://woodfortrees.org/plot/gistemp/from:1997/to:2015/plot/gistemp/from:1997/to:2015/trend
Frog. 1b shows the small warming on the mean of three terrestrial datasets.
So why then does your headline state …..
….. NO global warming AT ALL for 18 years and 9 months – A NEW RECORD (?) – The PAUSE LENGTHENS again?
Don’t be childish. The head posting is quite detailed, and it explains exactly what is meant by the headline.
It’s a genuine question, you have answered me several times here in posts that you admit to other data sets showing warming, yet your headline is as crudely, bluntly certain as it is misleading.
Don’t be childish. The headline is accurate. Indeed, there has been no statistically-significant warming on any of the major datasets for a decade or two.
Even Exxon knows your BS is BS.
Too bad the satellites don’t know it yet.
Q&A: Former Exxon scientist on oil giant’s 1970s climate change research
The scientists when I was there were making a genuine effort to understand the science. By the late 1970s, global warming was no longer speculative. There was direct evidence it was not the same type of carbon that was in the atmosphere a hundred years ago. We were looking for something that was a uniquely Exxon contribution to the science, and we had discussions with scientists at Columbia Univ
What was the nature of Exxon’s research into climate change?
At the time, the work had only just begun in earnest to really understand the problem rather than make broad-based estimates. If we were to figure out how much atmospheric carbon levels had changed, we needed to know how much CO2 the ocean was absorbing. The ocean, when it gets cold, absorbs CO2, but when it gets warm it releases it, just like a seltzer bottle that’s warm will bubble over.
How did you go about measuring carbon levels in the middle of the sea?
Exxon had a fleet of oil tankers traveling back and forth across the oceans. The great thing was the ships always ran the same routes. So we designed the equipment and installed it on board. You could make measurements as the ship was going back and forth, measuring CO2 levels in both the water and in the air at different points in time.ersity, where I was studying….
http://www.dallasnews.com/business/business-headlines/20151004-qa-former-exxon-scientist-on-oil-giants-1970s-climate-change-research.ece
What is your point. Anyone with basic chemistry knowledg3 knows that water absorbs CO2. Basic water like the ocean even more. It then forms carbonate salts and falls to the bottom of the ocean. Making limestone.
Seriously, do you think this is some kind of smoking gun? Everyone knows when you burn carbon you get more CO2 and it has to go somewhere. And your link didn’t work for me. But your posts is so idiotic and entertaining, I can’t wait to find out the rest of this spellbinding interview… LOL.
Link seems to work just fine. http://www.dallasnews.com/business/business-headlines/20151004-qa-former-exxon-scientist-on-oil-giants-1970s-climate-change-research.ece
Bear in mind, that I’m not trying to convince you that you’re wrong. That would be futile. I’m trying to show the evidence to everyone else. In fairness, you’re probably doing a pretty good job all by yourself of convincing people of how even Exxon knows your BS is just BS.
In an effort to deceive the public about the reality of global warming, ExxonMobil has underwritten the most sophisticated and most successful disinformation campaign since the tobacco industry misled the public about the scientific evidence linking smoking to lung cancer and heart disease.
As this report documents, the two disinformation campaigns are strikingly similar. ExxonMobil has drawn upon the tactics and even some of the organizations and actors involved in the callous disinformation campaign the tobacco industry waged for 40 years.
http://www.ucsusa.org/sites/default/files/legacy/assets/documents/global_warming/exxon_report.pdf
Again. what in that article is a smoking gun. It’s basic chemistry. It is barely even negative as the chemical engineer says the ocean wasn’t playing as big a role as they thought.
What were you trying to convince anybody with that article?
Does Exxon control the satellites that show no warming for 18 years.
DO YOU HAVE ANY IDEA HOW MUCH THE TEMPERATURE RECORD HAS BEEN ALTERED JUST SINCE 1981. 1890-1980 warming has tripled since 1981. DO YOU KNOW THAT?
Do you research? Read Hansen et. al. 1981. Look at the global temperature chart in that paper…. compare it to today’s… It is completely unrecognizable… Why do you think that is? Because Hansen is an unbiased scientist who hasn’t been arrested three times or more?
Even Google knows your BS is just BS.
Google’s chairman, Eric Schmidt…
“The facts of climate change are not in question anymore. Everyone understands climate change is occurring, and the people who oppose it are really hurting our children and our grandchildren and making the world a much worse place. And so we should not be aligned with such people — they’re just, they’re just literally lying.”
http://www.theguardian.com/environment/2014/sep/23/google-to-cut-ties-with-rightwing-lobby-group-over-climate-change-lies
What reviewed papers on climate change has Google’s chairman authored?
I’m guessing not one in China.
It is indeed unlikely that the chairman of Google has had even one, let alone two, papers published in the prestigious bulletin of the Chinese Academy of Sciences. For one who seems head-bangingly fascinated by authority, citing the chairman of Google as an authority seems odd.
Meanwhile, the world continues to fail to warm at anything like the predicted rate.
I’m afraid you are getting a bit befuddled old pudding, I think you are talking about jmac.
As to warming at the predicted rate ….
https://pbs.twimg.com/media/CMyMTjjWgAEeQvp.jpg
….. and what was that you were saying about expected warming? Oh yes …….
“The current el Niño, as Bob Tisdale’s distinguished series of reports here demonstrates, is at least as big as the Great el Niño of 1998. The RSS temperature record is beginning to reflect its magnitude.
From next month on, the Pause will probably shorten dramatically and may disappear altogether for a time. ”
….. by which time we might expect to see actually temperatures running close to the heart of the modeled range, at least for a while, as no one with any knowledge or sense would expect a complex system tor progress smoothly without variation.
Why do you paid climate-Communist trolls, who bully everyone who dares to question the Party Line in the hope of deterring others who would otherwise have spoken out by now, fail to quote even the head posting properly? As that posting clearly demonstrates, even a large el Nino will not be at all likely to bring the temperature trend since 1990 anywhere close even to the least warming rate that was then predicted.
I’m guessing not one in China.
Nope there wasn’t anything more than this earth-shattering news that water absorbs CO2… Wow. How informative. Dumbed down so even a 5th grader is totally dubious to any significance. WOW. Clearly you never studied chemistry. That’s about the first thing you learn. Why the DI water you use has a pH of 5.5 or so instead of 7.
So, Exxon knows you are full of BS, yet you don’t? Am I right?
The deniers are just ignorant or immoral people with no values, that are willing do people harm, even let them die, as long as there is profit to be made. These people are the most vile among us, with no motivation other than greed and profit. I hope they all rot in hell for delaying meaningful action on an issue that is a danger to all of us on this planet.
You are the ones killing Africans by not letting them have real power supplies… Global warming hasn’t killed anyone. Not a single person… It’s probably saved thousands by not freezing them to death. The CLIMASTROLOGISTS are the murderers.
You are so clueless you couldn’t even tell that the article was totally informationless.
Even Google knows you are just a bunch of liars, hurting our children and our grandchildren and making the world a much worse place.
Google’s chairman, Eric Schmidt…
“The facts of climate change are not in question anymore. Everyone understands climate change is occurring, and the people who oppose it are really hurting our children and our grandchildren and making the world a much worse place. And so we should not be aligned with such people — they’re just, they’re just literally lying.”
http://www.theguardian.com/environment/2014/sep/23/google-to-cut-ties-with-rightwing-lobby-group-over-climate-change-lies
Another leftist who also likes importing cheap labor from other countries. Another globalist in short. Another liar. Another fool. Another commie just like you.
“commie” = pretty stupid
Dayum that commie, tree hugging, hippie, liberal Marxist, New World Order Exxon and their bought and paid for, grant hungry, hoaxing scientists. 🙂
Your little diatribe against capitalism gave you away Honey.
Apparently far right wingers and their think tanks like the Heartland Institute think it is ok for a company or anyone to knowingly sell a product that they know can do harm (even cause death) to you and your friends. And use profits made from said product, to sponsor disinformation about the peer reviewed science warnings about the dangers of the product. They call that capitalism, especially when they get to have society pay for the damage done. The deniers are just immoral people with no values, that are willing do people harm, even let them die, as long as there is profit to be made. These people are the most vile among us, with no motivation other than greed and profit.
The liars are the Climastorlogists.
http://pubs.giss.nasa.gov/abs/ha04600x.html
Here is the 1981 Temps. Compare them to today.
You are personally responsible for the death of millions of AFricans. It’s a war crime all the lying the Climastrologists too.
Exxon knows it’s never been about the science and that your BS is just BS. Desperate times for the liars – as Google calls you.
You use this product…. you are just as gulity as they are. or more.
No one should be allowed to knowingly sell a product that causes people harm when used as directed, and then use profits from such sales to mislead the public on the science of the harmful nature of the product. People and corporations involved in knowingly misleading the public about the science are criminal sociopaths who don’t care about the lives of others, as long as there is money to be made.
Who is selling anything that knowingly does anyone harm… Except your communist propoganda?
That would be Exxon. Even Exxon knew about man made Climate Change decades ago, then just like big tobacco did, in order to prolong their profits started spending money to finance the blogs, opinion pieces, political campaigns, and think tanks to promote anti-science and cause doubt in folks minds and delay action.
http://insideclimatenews.org/news/15092015/Exxons-own-research-confirmed
Are the satellites lying too?
Even Exxon and Google knows you are lying and your only hope is to try to create doubt, just like Big Tobacco did.
“Doubt is our product, since it is the best means of competing with the ‘body of fact’ that exists in the minds of the general public. It is also the means of establishing a controversy.” — Brown & Williamson
YOU ARE THE TOBACCO COMPANY IN THIS CASE.
Ruining the lives of millions of Africans which could be brought out of poverty.
You are the ones killing AFricans… You are the hypocrite that is killing AFricans. You should get the death penalty.
Tough times for the ignorant and liars like you who have no sympathy for the lives of others as long as there is money to be made.
Exxon knew about man made Climate Change decades ago, then just like big tobacco did, in order to prolong their profits started spending money to finance the blogs, opinion pieces, political campaigns, and think tanks to promote anti-science and cause doubt in folks minds and delay action.
http://insideclimatenews.org/content/Exxon-The-Road-Not-Taken
You are the ones living on fossil fuel while telling the rest of the world, they can’t have it anymore. Hypocrites to the max. THE MAX… Pounding a way on your plastic laptops powered by fossil fuel… driving your car places every day no doubt. Telling poor people in the rest of the world to go and die.
Looks like Even Google knows you are just a bunch of liars, hurting our children and our grandchildren and making the world a much worse place.
Google’s chairman, Eric Schmidt…
“The facts of climate change are not in question anymore. Everyone understands climate change is occurring, and the people who oppose it are really hurting our children and our grandchildren and making the world a much worse place. And so we should not be aligned with such people — they’re just, they’re just literally lying.”
http://www.theguardian.com/environment/2014/sep/23/google-to-cut-ties-with-rightwing-lobby-group-over-climate-change-lies
The first of three times you post the same stupid factless, dataless tripe.
The point we have been at for decades now is that even Exxon, like Big Tobacco et al, before it, KNEW of the dangers and used profits to fund criminal sociopaths to mislead the public on the science.
Even Google calls you a bunch of liars. I hope you all rot in hell.
Knew what exactly? The iPCC still doesn’t know anything more than it knew 25 years ago… maybe less.
Have you looked up Hansen, et al. 1981 yet? Or are you too afraid?
You can download the PDF here.
http://pubs.giss.nasa.gov/abs/ha04600x.html
Even Exxon knows it’s never been about the science.
Apparently far right wingers and their think tanks like the Heartland Institute think it is ok for a company or anyone to knowingly sell a product that they know can do harm (even cause death) to you and your friends. And use profits made from said product, to sponsor disinformation about the peer reviewed science warnings about the dangers of the product. They call that capitalism, especially when they get to have society pay for the damage done. The deniers are just immoral people with no values, that are willing do people harm, even let them die, as long as there is profit to be made. These people are the most vile among us, with no motivation other than greed and profit.
I post NASA links, you right the communistic diatribe while letting millions of Africans suffer. Sad Little human you are… Are you going to ever post facts… you are starting to bore me with your stupidity
NASA, yeah they seem to be pretty good at that whole science thing. Let’s see what they have to say. Oh, my goodness, they say the same thing Exxon does.
http://climate.nasa.gov/evidence/
Did you compare the chart from today to the chart of 1981 yet?
Why would anyone be so stupid to waste their time looking at some chart from a right wing blogger.
It’s never been about the science, even Exxon knew that. How can anybody be so ignorant to think that if Exxon et. al. could not overturn the science with some credible alternative that “a right wing blogger” can with some right wing pseudo science from a right wing blog? Exxon would pay you billions to help fund and publish a credible study that disproved man made climate change.
Hansen is a right wing blogger? You are completely idiotic.
word salad
ARe the satellites lying too?
Even Google knows you are lying and your only hope is to try to create doubt, just like Big Tobacco did.
“Doubt is our product, since it is the best means of competing with the ‘body of fact’ that exists in the minds of the general public. It is also the means of establishing a controversy.” — Brown & Williamson during the The Tobacco wars.
You are the ones denying and lying about the satelilte data.
You are the ones killing AFricans by condemning them to more and worse poverty.
YOU ARE THE TOBACCO COMPANIES.
Have you looked at the temp charts in Hansen, et. al 1981 yet. HEre’s the link.
http://pubs.giss.nasa.gov/abs/ha04600x.html
Can you read a chart? Your communist education looks like it was lacking.
Exxon knows it’s never been about the science, only ignorant and immoral people who don’t care about the lives of others pretend it is.
Even Exxon knew about man made Climate Change decades ago, then just like big tobacco did, in order to prolong their profits started spending money to finance the blogs, opinion pieces, political campaigns, and think tanks to promote anti-science and cause doubt in folks minds and delay action.
http://insideclimatenews.org/content/Exxon-The-Road-Not-Taken
Did you actually read this article? All it is is about some scientist stating the opinions of a few other scientists… Not about any research Exxon had done… You are an idiot fool. You probably can’t even read… only know contro-C control-V
There are many scientists that worked on the Exxon project coming forward now. Here is another one. Katherine Hayhoe
“We’ve known for a long time that Exxon Mobil is one of the chief financial supporters of front groups who sow doubt on climate change and elected officials who vote against climate legislation. If you haven’t heard this before, put some popcorn in the microwave and pull up Merchants of Doubt (film) on Netflix. It will tell you all you need to know.
What most people didn’t realize, until recently, was that Exxon was also doing cutting edge climate research and using it as input to their business plan. At the same time they were paying people to tell us it was all a bunch of hooey.
Were they really doing legitimate, top-notch climate science? Yup, they absolutely were. I know, because I was doing it with them.
My master’s thesis work, and 7 subsequent journal articles, examined the contribution of methane to human-induced climate change. One of my primary collaborators, and the source of at least some of my funding as a graduate student (the bulk coming from scholarships and federal grants), was Exxon. We did the work, we published it in journals like Climatic Change, and we presented it at scientific conferences.
Were the scientists I was working with aware of what else Exxon was spending money on, at the time? No, I’m pretty sure most of them were not. Were the people who directed the research program, and who were responsible for conveying the results of our research to those who set company policy, aware? Yes, in hindsight I’m pretty sure most of them were. And that is why this is such an appalling story.
It’s one thing to honestly doubt the reality of something that will affect your business and your bottom line. It’s a very different thing to be entirely convinced of its reality, to the point where you are making business decisions based on its reality, and as part of your business strategy, decide that deceiving the average person is the best and most profitable course of action.
https://www.facebook.com/katharine.hayhoe/posts/1620770621481152
Have you looked at Hansen, et al. 1981 yet?
You have got be really stupid to think that some right wing blogger can disprove man made climate change, when even Exxon with all it’s resources couldn’t.
You have got be even more stupid to think you have some kind of credible study from some right wing denier blog that will disprove man made climate change, and yet you can’t get funding from Exxon to publish in some credible scientific journal.
Google calls you a bunch of liars.
Even Exxon knew about man made Climate Change decades ago, then just like big tobacco did, in order to prolong their profits started spending money to finance the blogs, opinion pieces, political campaigns, and think tanks to promote anti-science and cause doubt in folks minds and delay action.
http://insideclimatenews.org/content/Exxon-The-Road-Not-Taken
I guess that makes you a satellite-data denier then. And we know there is nothing worse than a denier.
Even Exxon knows you are just trying to create doubt with Lord Moncktons myth (Monckton is a paid shill for the fossil fuel boys and Heartland Institute – who also denied (still denies) the science about the cancer causing effects of tobacco.
So you are saying the satellites don’t say the temperature has been stable? What are you saying about the satellites? So yoaure a denier?
Monckton controls the data coming from the satellites? I don’t think you could understand anything. You have shown no science knowledge at all except to appeal to authority. which isn’t science.
It’s never been about the science, even Exxon knew that. How can anybody be so ignorant to think that if Exxon et. al. could not overturn the science with some credible alternative that “a right wing blogger” can with some right wing pseudo science from a right wing blog? Exxon would pay you billions to help fund and publish a credible study that disproved man made climate change.
Right… we know it’s not about the science for you communists. It’s about control. We have been saying that for years.
The satellites are controlled by a right wing blog?
Exxon calling BS on you again.
You are really stupid to think that some right wing blogger can disprove man made climate change, when even Exxon with all it’s resources couldn’t.
You have got be even more stupid to think you have some kind of credible study from some right wing denier blog that will disprove man made climate change, and yet you can’t get funding from Exxon to publish in some credible scientific journal.
So all you have is ad hom attacks… No data…No nothing.
Please… tell me… where was the smoking gun? That interview was bumpkus and you are too stupid to know any better.
The question isn’t whether we are making more CO2 or whether the concentration is rising…. It is.
The question is… what does it do to the climate? And so far, absolutely nothing, you know why? Because CO2 absorbs the same infrared frequencies that wator vapor does and it becomes effectively saturated at levels much lower than we are at now.
That is why all the models have been wrong.
Even Google knows your kind are just a bunch of liars, hurting our children and our grandchildren and making the world a much worse place.
Google’s chairman, Eric Schmidt…
“The facts of climate change are not in question anymore. Everyone understands climate change is occurring, and the people who oppose it are really hurting our children and our grandchildren and making the world a much worse place. And so we should not be aligned with such people — they’re just, they’re just literally lying.”
http://www.theguardian.com/environment/2014/sep/23/google-to-cut-ties-with-rightwing-lobby-group-over-climate-change-lies
Another leftist who also likes importing cheap labor from other countries. Another globalist in short. Another liar. Another fool. Just like you. Are you going to post any facts or data or just appeal to the same stupid authorities all day long.
Even Exxon and Google know you are a bunch of liars really hurting our children and our grandchildren and making the world a much worse place. And your response is to double down on stupid.
They know the satellites are lying too? Oh no… They are just stupid…. And actually Exxon said no such thing… You are too stupid to even understand what Exxon said…. or Even exxon’s ex-scientist who didn’t seem so bright himself.
Even the Koch bros know you are lying.
Hell, even the Koch bros tried funding a legit science study to overturn the science – and failed – only to prove that the science was right all along. (The BEST Study)
How can anyone not know that? The deniers are just immoral people with no values that are willing do people harm, even let people die, as long as there is profit to be made. These people are the most vile among us, with no motivation other than greed and profit.
“Doubt is our product, since it is the best means of competing with the ‘body of fact’ that exists in the minds of the general public. It is also the means of establishing a controversy.” — Brown & Williamson
It’s what happens when welfare kings and queens outnumber productive citizens at the voting booth. It will end when productive citizens wake up and stop allowing public leeches on society to vote, either by barring them, deporting them, or killing them. I’m fine with any of the above. Of course obummer wants to give 11 million illegal alien leeches instant citizenship, that’s 11 million votes to continue the madness. It will change soon – either Trump will be elected and clean out the leeches, or productive people will leave and the leeches will starve.
It’s more like 20 million. Because just like they can’t verify Obamacare applications… they won’t be able to verify that anyone has actually been here or not… they will hand them out like candy. if we let them.
Just in time to destroy any credibility of the Paris Conference…. I suggest we get all of the warmists at the conference to help cut CO2. They need to hold their breaths for an hour. If they can rise from the dead, then we will listen to them.
Except that Mr Monckton has zero credibility, as he systematically misrepresents the issue by a highly selective editing of the available information. For example HADCRUT4 is one of the datasets that he fails to mention or that this shows warming during the period that he asserts with blunt certainty that non has occurred.
http://woodfortrees.org/plot/crutem4vgl/from:1997/to:2015/plot/crutem4vgl/from:1997/to:2015/trend
Liar. He has a Hadcrutch chart in the article. He even mentions methane which is a big reason why the models could be wrong. Real scientists change their hypothesis when the experiment fails.
Apologies, you are partially correct, Mr Monckton does indeed mention HADCRUT4 though the graph is a combined mean lumped in with other surface datasets.
Hardly sits well with the banner headline though, no warming, …..er…… um……. apart from these guys!
When you can explain why 1940 used to be hotter than 1980 and now its much cooler.
This does not make sense as a piece of english language let alone raising a valid point.
Feel free at any point to clarify if its a question or statement, and/or add enough information to give some hint on what you are talking about.
That is climastrology for you. Read Hansen et. al 1981 and look at the temp. graph. It’s on Nasa’ s website.
1940 is hotter than 1980.
As far as I’m aware, there has never been any doubt or even debate that temperatures do not rise in a direct linear fashion. If you look at the temperatures for the whole C20th there seems to be a 30 year cycle of switching back and forward:
1880 – 1910 stable
1910 – 1945 warming
1945 – 1970 cooling
1970 – 2000 warming
For this reason I was not remotely surprised by the possibility of a ‘pause’ or ‘hiatus’ in warming, and in fact had thought it likely that we would see stable temperatures until 2030 followed by some serious warming.
That we are not seeing a pause in the surface temperatures is worrying.
As to why temperature rises and falls while CO2 rises, the influence of the PDO seems a likely driver. Throughout much of the C20th temperatures and PDO seemed to react in a similar way, with temperature peeling away from PDO towards the end of the century.
http://www.woodfortrees.org/plot/gistemp/from:1900/to:2015/mean:12/plot/jisao-pdo/from:1900/to:2015/mean:12/scale:0.2/offset:-0.5
This peeling away is important. If my suggesting is correct and the PDO has a large impact on surface temperatures then with the PDO now in its cooling phase we might expect to be seeing a much more pronounced pause or cooling period.
If the PDO in cooling period is no longer able to restrain warming, then we are potentially in real difficulties when it switches to warming mode, i.e. the 1930’s are likely to be a tough time.
While I guess you’re a lot smarter than your average Climastrologist and computer model. That’s why none of us believe them. They are either lying, stupid or both.
Nope, my views are simply based on a fair rather than an ideologically driven reading of what climate scientists have been saying calmly and consistently for decades.
All the models have bern wrong period. And 15 more years of a pause, which you are predicting makes it more so. Period.
I’m not predicting anything. I am not a scientist.
All I said was that I would not have been surprised by a pause, even one lasting another 15 years, and that I find the lack of one ominous.
As to the models, it is blunt and premature to state that they are wrong. They are running at the low side of the range of possibilities at present but as we appear to be in the grip of a strong El Nino event, it is likely that temperatures will rise, as suggested by the abrupt rise in temperatures recorded on this NASA record ….
http://climate.nasa.gov/vital-signs/global-temperature/
…. which is likely to bring temperatures towards the center of the model prediction ranges. I can’t see anything out there yet that composites most recent model predictions with most recent temperature, so neither of us can say for certain we are correct.
If you take away the meddling they are very wrong. If you look at the satellite data they are very very wrong.
We’ll also be greatful for every Hiroshima bomb of heat we stored when we hit the Maunder-like minimum in 15 years.
That’s a conversation to pick up in 15 years time.
Warming is likely to bring less severe weather if it works like most Climastrologists think… by warming the poles first.
Feel free to develop this thought into something more than wishful thinking.
So far it’s worked. Severe weather is way down.
Yup
http://www.usatoday.com/story/weather/2014/09/02/polar-vortex-climate-change/14973047/
http://www.bbc.co.uk/news/world-latin-america-34614864
http://www.climatecentral.org/news/how-global-warming-made-hurricane-sandy-worse-15190
http://www.nytimes.com/2015/08/21/science/climate-change-intensifies-california-drought-scientists-say.html
Like I said, feel free to develop your thought into something more than wishful thinking.
Ahhh. Peer-reviewed newspapers?
Tell me what was responsible for the 200 year drought in the Southwest 800 years ago?
What California is experiencing is only significant because so many people live there. You have no historical perspective. NONE. That and it will all be over probably in 3 more months.
I showed you mine, now its only polite to show me yours. Feel free to link to something credible when you can scrape up enough energy.
Google historic California droughts.
You’re the idiot here criticizing the work of a real scientist. you should be doing the research before showing your ignorance.
Have you used that thing called google yet? Have you informed yourself. Or do you want me to post the 300 links?
On you go then.
http://pubs.giss.nasa.gov/abs/ha04600x.html
Here’s the link so you can see how the 1981 temperature chart has been modified. All of course in the name of science. LOL.
Yet all four datasets are totally independent. Yep. Right.
OK so now we have a link to a paper that is nearly 35 years old, that I am in no way interested in reading, so …..
…… if you feel that it is misrepresent data then you’ll need to point it out, as my interest in an early document now decades out of date does not stretch very far at all.
OF course not, You have no interest in seeing how big you have been duped. Your fine with trusting the consensus and not doing your own research… Understood… go about your merry ignorant way.
http://pubs.giss.nasa.gov/docs/1981/1981_Hansen_etal_1.pdf
Again, the raw data doesn’t show the warming of which you speak.
The fact that the data used to say 1940 was hotter then 1980 but now all datasets show 1980 hotter is proof that the data is not independent.
Sorry to rain on your conspiracy theory but that’s not true.
This from the NASA website shows 1940 is warmer than 1980
http://climate.nasa.gov/vital-signs/global-temperature/
Also, this from Woodfortrees:
http://www.woodfortrees.org/plot/gistemp/from:1900/to:2015/mean:12/plot/jisao-pdo/from:1900/to:2015/mean:12/scale:0.2/offset:-0.5
And these are 4 independent summaries of the raw data by 4 independent institutions all in agreement the warming continues:
http://climate.nasa.gov/system/content_pages/main_images/1309_Temp_anomaly.jpg
i showed you the Hansen paper. In 1981…. 1940 was hotter.
The data is not independent.
No you didn’t you alluded to it…..
….. and I in turn linked to two recent data sets that record 1940 as hotter than 1980.
Hansen may have said something different but all that shows is that there is independence and debate among the scientists studying this issue and they are not lock step propagandist as you suggest.
No.. Hansen now buys off on the data…. It’s being constantly adjusted. If you were paying attention and looking into history, you would know that. 1880-1980 warming has tripled since 1980. Showcase example of confirmation bias if not fraud.
What happened to the global cooling you referenced from 1940-1975?
Were you lying… or was it erased…. to make the hockeystick.
Not hidden, not erased, its right where it always was for anyone to see.
http://climate.nasa.gov/scientific-consensus/
http://www.woodfortrees.org/plot/gistemp/from:1900/to:2015/mean:12/plot/jisao-pdo/from:1900/to:2015/mean:12/scale:0.2/offset:-0.5
In the 1970’s they were saying it had cooled about .6 or .7C. I don’t see that drop… Were scientists too stupid to be able to read thermometers accurately?
That’s a pause… not cooling. 0.2C cooling is noise. Again, reference Hansen et. al. 1981 and every newspaper and magazine from the time. The temperature data is totally incompatible with the ice data as well. If the 1890’s were really 1C cooler, we would have been in an ice age.
As we’ve reached a point where you have to split hairs between the words ‘pause’ and ‘cooling’ or go back almost 35 years to drum up some tired outrage, it is really the end of any useful of vaguely interesting discussion.
End.
Because you can’t account for the changes… And without all those temp modifications you have nothing. The satellites have called your bluff.
For that to be true, 4 independent scientific institutions in 3 separated countries would have to be engaged in an elaborate decade long fraud that involved considerable co-ordination between them and required the entire scientific establishment turning a blind eye.
Feel free to either provide some proof to back up this stunning conspiracy theory ….. until then I’ll stick it in the file labelled “Delusional Ranting”.
What happened to Hansen’s data? If all four datasets are independent… what happened to the chart in Hansen, et. al 1981?
I neither know nor care.
Feel free to explain its relevance or for that matter why you can’t come up with anything more interesting or convincing than what you feel is a single error(?) in a single decades old scientific paper.
It shows how the temperature record of today… doesn’t look anything like it did 35 years ago. And you can see all the changes have been in one direction. Past gets colder… present gets hotter. Yet you claim all four datasets are independent… How can that be… if they all deviate from the true historic original datasets?
It’s okay… I know you’re not interested. You’re happy being a dumb ignorant fool.
And all it takes is peer pressure and confirmation basis… no conspiracy or fraud needed…. but some of them probably know the gig is almost up.
So, no proof, just more delusional keyboard slap and wishful thinking from a back room grunt ….
….. if you can come up with something more substantial I’d be interested in seeing it, until then, this is just a bit dull and childish.
End
Monckton is another shill from the Heartland Institute. He will lie for money. This short entertaining video should set anyone straight who doubts that he is anything but a hired killer and a snake-oil salesman.
https://www.youtube.com/watch?list=PL82yk73N8eoX-Xobr_TfHsWPfAIyI7VAP&v=fbW-aHvjOgM
Point me to one lie in this article. ONE.
Bear in mind, that I’m not trying to convince you that you’re wrong. That would be futile. I’m trying to show the evidence to everyone else. In fairness, you’re probably doing a pretty good job all by yourself.
That video speaks volumes to the type of people that have been lying and trying to create doubt about the science.
Even Google calls you just a bunch of liars, hurting our children and our grandchildren and making the world a much worse place.
Google’s chairman, Eric Schmidt…
“The facts of climate change are not in question anymore. Everyone understands climate change is occurring, and the people who oppose it are really hurting our children and our grandchildren and making the world a much worse place. And so we should not be aligned with such people — they’re just, they’re just literally lying.”
http://www.theguardian.com/environment/2014/sep/23/google-to-cut-ties-with-rightwing-lobby-group-over-climate-change-lies
When are you going to start posting evidence? I’m waiting to be enthralled.
So even Exxon and Google know you are a bunch of liars really hurting our children and our grandchildren and making the world a much worse place. And your response is to double down on stupid.
Email from Former Exxon Employee Lenny Bernstein http://www.ucsusa.org/sites/default/files/attach/2015/07/Climate-Deception-Dossier-Leonard-Bernstein-Email.pdf
Deception Dossier #1: Dr. Wei-Hock Soon’s Smithsonian Contracts https://s3.amazonaws.com/ucs-documents/global-warming/Climate-Deception-Dossier-1_Willie-Soon.pdf
Deception Dossier #2: American Petroleum Institute’s “Roadmap” Memo http://www.ucsusa.org/sites/default/files/attach/2015/07/Climate-Deception-Dossier-2_API-Climate-Science-Communications-Plan.pdf
Deception Dossier #3: Western States Petroleum Association’s Deception Campaign http://www.ucsusa.org/sites/default/files/attach/2015/07/Climate-Deception-Dossier-3_WSPA-ppt.pdf
Deception Dossier #4: Forged Letters from the Coal Industry to Members of Congress http://www.ucsusa.org/sites/default/files/attach/2015/07/Climate-Deception-Dossier-4_ACCCE-forged-letters.pdf
Deception Dossier #5: Coal’s “Information Council on the Environment” Sham http://www.ucsusa.org/sites/default/files/attach/2015/07/Climate-Deception-Dossier-5_ICE.pdf
Deception Dossier #6: Deception by the American Legislative Exchange Council http://www.ucsusa.org/sites/default/files/attach/2015/07/Climate-Deception-Dossier-6_ALEC.pdf
Deception Dossier #7: The Global Climate Coalition’s 1995 Primer on Climate Change Science http://www.ucsusa.org/sites/default/files/attach/2015/07/Climate-Deception-Dossier-7_GCC-Climate-Primer.pdf
Please… Point out to me the smoking gun in each of these cases…. The first one… Corporations are out to make money and keep up their image…. Duhhhhh.
Please be specific so I can address specific points… Please start with the most damning.
You kill more Africans with your hyprocrisy than Global Warming ever will.
Even Exxon and Google knows you are lying and your only hope is to try to create doubt, just like Big Tobacco did.
“Doubt is our product, since it is the best means of competing with the ‘body of fact’ that exists in the minds of the general public. It is also the means of establishing a controversy.” — Brown & Williamson
Posting it a hundred times doesn’t make it any less false. You communist hypocrite pig. African Killer.
Exxon = communist now = pretty stupid comment.
Desperate times for the liars – as Google calls you.
It’s never been about the science, even Exxon knows that.
Apparently far right wingers and their think tanks like the Heartland Institute think it is ok for a company or anyone to knowingly sell a product that they know can do harm (even cause death) to you and your friends. And use profits made from said product, to sponsor disinformation about the peer reviewed science warnings about the dangers of the product. They call that capitalism, especially when they get to have society pay for the damage done. The deniers are just immoral people with no values, that are willing do people harm, even let them die, as long as there is profit to be made. These people are the most vile among us, with no motivation other than greed and profit.
You are right. For communists like you, it’s about the power and how nice it feels to think in your puny little insecure mind that you are saving the world with your stupidity.
It’s Exxon calling your BS, well BS!
Exxon = communists = ignorant
Where did Exxon call my BS. Give me the exact quote and a link.
Oh, I doubt Exxon has ever even heard of you. But they know your BS is just BS, as does Google and the Koch bros.
http://insideclimatenews.org/content/Exxon-The-Road-Not-Taken
Hansen et.al 1981 says it’s all BS.. Have you looked at it yet?
You are really stupid to think that some right wing blogger can disprove man made climate change, when even Exxon with all it’s resources couldn’t.
You have got be even more stupid to think you have some kind of credible study from some right wing denier blog that will disprove man made climate change, and yet you can’t get funding from Exxon to publish in some credible scientific journal.
Are the satellites lying too you moronic communist.
communist = pretty stupid too.
Dayum that commie, tree hugging, hippie, liberal Marxist, New World Order Exxon and their bought and paid for, grant hungry, hoaxing scientists. 🙂
Even Exxon and Google knows you are lying and your only hope is to try to create doubt, just like Big Tobacco did.
“Doubt is our product, since it is the best means of competing with the ‘body of fact’ that exists in the minds of the general public. It is also the means of establishing a controversy.” — Brown & Williamson
YOu are killing AFricans by the millions. More than global warming will ever kill.
Hypocrite. You gave away your colors in your anti-capitalist rant.
Have you looked at the 1981 temp graph yet? COWARD.
http://pubs.giss.nasa.gov/abs/ha04600x.html
Even Exxon, Google and the Koch bros know it has never been about the science.
Do you seriously think that you have info of some credible scientific study that disproves man made climate change? How stupid of you not to get Exxon et al and Koch bros to pay you billions for such a study?
The deniers are just immoral people with no values that are willing do people harm, even let people die, as long as there is profit to be made. These people are the most vile among us, with no motivation other than greed and profit.
And you ignore the satellite data and have zero explanation for the deviation between the satellite data and the highly skewed temperature record.
OK, setting aside your crude assumptions on what I am or am not ignoring, here is an overlay of RSS, GISS & UAH between 1980 & 2015 with the trend lines added for that period.
http://www.woodfortrees.org/plot/gistemp/from:1980/to:2015/mean:12/plot/rss/from:1980/to:2015/mean:12/plot/uah/from:1980/to:2015/mean:12/offset:-0.2/plot/gistemp/from:1980/to:2015/trend/plot/rss-land/from:1980/to:2015/trend/plot/uah/from:1980/to:2015/trend/offset:-0.2
RSS drops slightly after 2000 relative to the other two but the overall trend lines are very similar.
This short term variation in the sets is hardly the killer evidence you seem to think it is, and even at that, Mr Monckton admits that he is expecting to see a kick up in RSS within the next two years.
Considering 1980 came at the end of a period of global cooling…. It most certainly is significant.
1979/80 to present is also the period of time that is covered by the RSS & UAH data sets, so is significant in that respect.
Global cooling between 1945 and 1970 is a whole other issue, important in its own right but of less relevance to the specifics of this article.
Very relevant to this article. VERY relevant.
Fig. 1b of the head posting shows the small warming on the mean of the three terrestrial datasets. One of them is HadCRUT4. Try learning to read.
Mobius, you have loops in your brain…..Lord Monckton is a very brilliant antagonist who is very careful in the vetting of his information….. it is your HADCRUT4 et al that have selectively been pruned to remove all mitigating temperature information. The University of East Anglia (CRU) is the laughing stock of the entire scientific community after the release of their severely warped leftie emails….. we all know that their info (also helped by the Hadley Center) is carefully modified to support AGW….. why on Earth would anyone still believe those wack jobs.
Monckton is a fantasist.
https://www.youtube.com/watch?v=hl2lShU6zD0
He is only person I’ve ever heard of that the UK House of Lords has felt compelled to write and publish a letter to publicly stating that he is a liar and demanding that he stops lying.
https://www.youtube.com/watch?v=hl2lShU6zD0
The UK House of Lords are complicit in AGW. AGW is complete and utter hogwash. Monckton knows this and combats it.
I didn’t know it was possible to type with your tongue!
Wow !! You know that talking to yourself in jibberish is a serious psychological problem. You need help. I think Loopy that you should hold your breath for 10 minutes as an exercise to reduce you carbon footprint. Let me know how that works out for you. HA HA HA HA HA HA
I should really be more specific. Look at the two graphs in his article showing IPCC predictions. You may notice they show different times spans?
If you composite them together you see that Monckton uses different starting points for the 1990 & 2005 graphs, so he is not comparing like for like but manipulating the information to exaggerate the mismatch between the green line and the RSS data set.
The purple line allows a like for like comparison. This is typical of the man.
https://uploads.disquscdn.com/images/429e8f823a3acc483aedb6b5da094e8a9dc4c0a9d2e658336072cecb6a6a8593.jpg
So, with all the skill of a second rate magician Mr Monckton is engaged in clumsy misdirection.
He focuses heavily on one data set dealing with one part of the atmosphere with only a brief and dismissively worded reference to any of the other data sets that do not support his argument.
So, just for the record, here is the temperature record from the Japanese Meterological Agency which clearly shows warming during the last 18 years, 9 months, 3 days, 1 hour, 30 seconds…… or whatever figure Monckton has to use to try and make his claims stack up.
https://img.washingtonpost.com/wp-apps/imrs.php?src=https://img.washingtonpost.com/blogs/capital-weather-gang/files/2014/11/oct_wld.png&w=1484
No misdirection at all. He tells both sides of the story. Even noting how one of the reasons the models would be off is because they overestimated methane concentrations.
You are a blind delusional fool.
Read Hansen et. al 1981…. Look at the temperature charts… What happened to them?
I would have no objection to Mr Monckton if he laid the information out clearly e.g. setting terrestrial and satellite data sets side by side, then explain that between 2000 & present 2 of the data sets show warming and one does not.
Instead he launches into his banner headline of no warming, dwells a lot on RSS, dismisses GISS as fraudulent and then, perhaps most tellingly, mentions UAH but …….. er um does not let you see the graph itself…… I wonder why ……. could it be because UAH actually shows warming and is closer to GISS than RSS.
In fact, if Monckton laid his information out as follows I would be less inclined to dismiss him as a pedller of snake oil.
http://www.woodfortrees.org/plot/gistemp/from:1980/to:2015/mean:12/plot/rss/from:1980/to:2015/mean:12/plot/uah/from:1980/to:2015/mean:12/offset:-0.2/plot/gistemp/from:1980/to:2015/trend/plot/rss-land/from:1980/to:2015/trend/plot/uah/from:1980/to:2015/trend/offset:-0.2
Spare me the righteous indignation. In most of the article, he averages RSS and UAH together… You didn’t read it… You skimmed it at best. A quote:
To be precise, a quarter-century after 1990, the global-warming outturn to date – expressed as the least-squares linear-regression trend on the mean of the RSS and UAH monthly global mean surface temperature anomalies – is 0.27 Cº, equivalent to little more than 1 Cº/century. The IPCC’s central estimate of 0.71 Cº, equivalent to 2.8 Cº/century, that was predicted for Scenario A in IPCC (1990) with “substantial confidence” was approaching three times too big. In fact, the outturn is visibly well below even the least estimate.
RSS and UAH start in 1980… after a 35 year period of global cooling. So seeing a trend upward after that for a few years should be expected. THE FACT IS THEIR IS NO EXPLANATION for the divergence… Except that the surface temps keep getting fudged every other week.
Again thank you for deciding my reaction for me, and back in the world of reality I’m not remotely indignant, I’m simply making a point that 4 terrestrial data sets are broadly in agreement:
http://climate.nasa.gov/system/content_pages/main_images/1309_Temp_anomaly.jpg
I’m also pointing out that the UAH data set is in pretty close agreement with them, and that the RSS shows a small recent divergence that is hardly enough to tear down 30+ years of scientific research.
http://www.woodfortrees.org/plot/gistemp/from:1980/to:2015/mean:12/plot/rss/from:1980/to:2015/mean:12/plot/uah/from:1980/to:2015/mean:12/offset:-0.2/plot/gistemp/from:1980/to:2015/trend/plot/rss-land/from:1980/to:2015/trend/plot/uah/from:1980/to:2015/trend/offset:-0.2
Again you have no evidence that surface trends are being falsified nor do you make any reference to the fact that the satellite records also have to be adjusted to allow for a range of factors including the cross calibration of different satellites.
As to the divergence, there is temporary variation in all the data sets even the terrestrial ones based on largely the same raw data. If there divergence were to continue for another 10 years or become more pronounced you might have a point but you are at least 5 years away from being able to make a valid point……… while even Monckton admits that he is expecting to see a rise in the RSS figures shortly.
If we accept your argument that AGW is not occurring I’m at a loss to understand why warming post 1980 is an absolute given.
Ultimately though it comes down to whether we trust our scientific establishment or put or faith in a backroom grunt like yourself cheerleading for a notoriously eccentric fantasist…..
http://farm6.staticflickr.com/5509/14208730053_2999c0d7e3_o.jpg
……. who the UK House of Lords has taken the EXTRAORDINARY steps of writing to and publishing their letter effecting calling him a liar……
http://www.parliament.uk/business/news/2011/july/letter-to-viscount-monckton/
…… and who has no qualms about parading his slender grasp of reality in public:
https://www.youtube.com/watch?v=hl2lShU6zD0
Stick with your fantasist if you want, I prefer science and reality.
Why did the temp record look so different 35 years ago in Hansen et. al, 1981.
I guess scientists were too dumb to read thermometers back then.
Having finally found the correct graph, there are minor variations but nothing that contradicts the main thrust of modern graphs>
The pause / cooling between 1940 & 1970 is evident on both graphs.
Yep. Sure. And the total warming has nearly tripled
The UAH dataset shows no warming for 18 years 6 months.
Here is a plot of the UAH data sheet from 1995 to as close to present as is available.
I’ve overlaid trend lines for 1997, 1998 & 1999 to present and every single one shows a rise.
http://www.woodfortrees.org/plot/uah/from:1995/to:2015/plot/uah/from:1997/to:2015/trend/plot/uah/from:1998/to:2015/trend/plot/uah/from:1999/to:2015/trend
So unless you are trying to say that the hottest point of an extreme year is typical, then I don’t see where you are getting the no warming from.
The UAH dataset shows no warming at all for 18 years 6 months from May 1997 to October 2015. The basis for calculation of these graphs is clearly explained in the head posting. Try reading it. The start-date for each zero-trend graph is simply the earliest date from which a zero trend runs. Not exactly a difficult concept to understand, is it?
The further graphs supplied in the head posting show that the discrepancy between the rates of warming predicted by the IPCC and the rates that are actually observed continues inexorably to widen. For some of the reasons why this exaggeration is happening, read my papers in the Science Bulletin of the Chinese Academy of Sciences.
Hmmmmm, can’t see where you’ve explained UAH without lumping it in with RSS except in the “Key Facts About Global Temperatures” bit where you include a UAH graph that clearly shows warming.
To make it do anything else you would have to work really hard. I tried with a 1997, 1998 & 1999 trend line and they ALL SHOW WARMING.
.
http://www.woodfortrees.org/plot/uah/from:1995/to:2015/plot/uah/from:1997/to:2015/trend/plot/uah/from:1998/to:2015/trend/plot/uah/from:1999/to:2015/trend
The gap between model predictions and observed temperatures continues to widen. Don’t really see that, recent warming is bringing the temperatures back towards the center of the predictions.
https://pbs.twimg.com/media/CMyMTjjWgAEeQvp.jpg
MY paper’S’ …… you’ve had more than one paper published in China? Do the ACTUAL CLIMATE SCIENTISTS whose coat tails you hung off not get really peeved by your arrogant dismissal of their contribution?
It is a simple matter to anyone but a bought-and-paid-for climate-Communist crook to calculate the least-squares linear-regression trend on the UAH temperature data for the past 18 years 6 months. The trend is zero (or actually a tad below zero).
As to my papers on climate sensitivity, they are proving highly popular with the scientists who read the Science Bulletin of the Chinese Academy of Sciences. The first paper is, by a factor ten, the most-downloaded paper in the entire 60-year archive of that distinguished journal of the world’s largest academy of sciences.
You missed a trick.
I was using the wrong information (thank you to Odin2 ….. presumably heir to Odin 1).
Apparently UAH5 has been replaced by UAH6, the first showing a rise and the second not:
https://bobtisdale.files.wordpress.com/2015/04/figure-24.png
Strange that you reject the terrestrial data sets because they have been ‘tampered’ with but are more than happy to include this one which has also been adjusted.
Time and again, a close look or a scratch of the surface reveals the type of dishonesty in what you do or say that the UK Government skewered you for in public.
http://www.parliament.uk/business/news/2011/july/letter-to-viscount-monckton/
Not true; UAH shows a warming trend of 0.104c per decade since 1997. http://www.ysbl.york.ac.uk/~cowtan/applets/trend/trend.html
You must be referring to the heavily adjusted and officially unrecognised UAHv.7.0 dataset. The humongous adjusts on this data set have not been peer reviewed, unlike the minor corrective tweaks to the their other based data.
The warming trend from May 1997 to October 2015, a period of 18 years 6 months, is a zero trend on the UAH v.6 dataset. There is no v.7.
Cherry-picking dishonesty. You have deliberately chosen a period which least represents the true overall warming trend in the data. A year or two either side, and the data shows virtually the same warming trend as the entire dataset – a perfect illustration that short term trends are not robust. You know this perfectly well, and your cherry-picking nonsense is about as effective an admission of your intention to deceive as it’s possible to make, without actually stating it outright.
https://a.disquscdn.com/uploads/mediaupload/tmp/4da10997a42bed09840fa28e4a536b04d51a60cbc7768b430e3630cb/original.jpg?w=800&h
Well done!
(Now we’re going to be named as co-conspirators..
“As Lenin used to say, where should we be without the useful idiots? It is not a crime to be an idiot. But it is a crime knowingly and persistently to lie with the intention of deceiving others, either with intent to profit or with intent to cause loss. Several of the paid climate-Communist trolls here are now well known to the authorities, who are marshaling the evidence. No small part of that evidence is to give the trolls fair warning that if they depart from the truth in future they may face jail. Then, if they persist in their lies and deceptions, their intent can be more easily demonstrated.
Since the fraud of which these creeps are a willing and profiteering part is arguably the largest fraud ever perpetrated, their punishment will not be small when they are eventually brought to book. They can expect long prison sentences. And that will serve them right. They thought anonymity would protect them. Well, it won’t.”
https://disqus.com/home/discussion/climatedepot/no_global_warming_at_all_for_18_years_9_months_a_new_record_8211_the_pause_lengthens_again_just_in_t/#comment-2350370887 )
I think and I hope that a lot of people will have a long memory on this issue.
There are signs that may be the case.
http://www.saffronwaldenreporter.co.uk/news/saffron_walden_student_wins_art_prize_1_4078710
Great piece of sculpture!
Don’t be childish, and don’t be repetitive. The basis on which the calculation for the graphs in the head posting are conducted, including the determination of the start date by calculation, is explicitly and carefully set out in the head posting. The truth is that by now there should be 0.3 degrees/decade warming, if the IPCC were correct in 1990, but for the last couple of decades there has been more like zero, and the warming rate since the satellite data began in 1979, is equivalent to little more than 0.1 degrees/decade, little more than a third of the IPCC’s predicted rate.
Every six months at WattsUpWithThat I prepare an analysis of all the principal terrestrial and satellilte datasets over all timescales, so that the complete picture is available for those who want it. These monthly reports concentrate on the RSS dataset, which reports first each month, and they constitute a valuable resource for those who are genuinely interested in what is actually happening to global temperature. So don’t be silly.
Monckton stacks one dishonesty on top of another, see also his double standards in happily accepting the adjusted UAH v.6 data set while rejecting ALL of the terrestrial ones because they have been adjusted.
Of course – anything that appears to lessen the actual warming rate, Monckton and his co-conspirators welcome with open arms, unquestioned. It’s so transparent…
At times it seems there is no comment so daft, no fact so shaky or no tactic so low that they will not embrace it to shore up a failing argument.
What we definately have are the UAH V.5 & UAH v.6 datasets which provide different interpretations of the same information.
Much of the argument for using satellite records is that they are direct observations and yet here we have a very clear example of them being adjusted or ‘tampered with’.
https://bobtisdale.files.wordpress.com/2015/04/figure-24.png
Do you think that this intervention by scientists invalidates UAH v.6?
For some time I had been concerned that UAH was running hot. I had conveyed those concerns to the operators of the dataset. They had themselves realized some corrections needed to be made. They made them.
There is a simple calibration test one can use. Because the lower troposphere occupies the lower 5 km of the atmosphere (or thereby, and varying with latitude), heat transfer by evaporative-convective processes should lead to a greater warming with altitude, as far as the mid-troposphere, than at the surface. Accordingly, on the basis of well-understood physical principles, the surface temperature change should be about 83% of the mean lower-troposphere temperature change and only 33% of the temperature change in the mid-troposphere (Santer et al., 2003, cited by IPCC, 2007). Yet the terrestrial tamperature datasets do not – as they should – show less warming than the satellite datasets: they show more warming.
And the amount of extra warming they show is approximately equal to the sum of the urban heat island effect (quantified in Michaels & McKitrick, 2007, as an overstatement of land surface temperature changes by double) and those elements in the terrestrial-temperature corrections that appear fictional and inadequately justified by science.
Bottom line: since the warming rate in the quarter-century since October 1990 is only 0.25 Celsius (mean of UAH and RSS datasets), the mean of the surface datasets should be 0.2 Celsius – equivalent to a centennial rate of only 0.8 Celsius. Not exactly a problem.
So is Spencer’s data set peer reviewed?
On the other point, I have an admission…..
……strange though it may seem, it would not in any way surprise me if you are correct and there has been a recent pause in the rise of surface temperatures, given that the C20th was marked by 30 year long periods of warming followed by 30 year long periods of stability or even cooling e.g.
1880 – 1910 stable
1910 – 1945 warming
1945 – 1970 cooling
1970 – 2000 warming
http://climate.nasa.gov/system/content_pages/main_images/1309_Temp_anomaly.jpg
If that were indeed a pattern and projected forward it might go something a little like this
2000 – 2030 stable / cooling
2030 – 2060 warming
I had been wondering about this for about 5 years and was very interested to recently come across the excellent Wood for Trees site which allows us plebs to check the data ourselves.
What I found really interesting from this was the similiarities between surface temp and the PDO throughout much of the C20th century.
https://uploads.disquscdn.com/images/b2abb2d951fbd956508d5f5ad6d2584188d34cf310dcd87120f0bad73abbceab.jpg
Interesting that your reliance on the RSS and unchecked UAH v.6 data sets would fit this pattern pretty well.
Oh, and having put forward this idea, had a quick browse, and here is a real scientists saying something very similar:
https://scripps.ucsd.edu/news/new-take-global-warming-hiatus
Here is a quote from Shang-Ping Xie in the article that seems pretty appropriate to our discussion.
“Because of natural cycles of various timescales, global temperature rises in a staircase-like manner instead of shooting up straight”
The furtively anomymous “The” is apparently incapable of determining a least-squares linear-regression trend on a time-series. The trend on the UAH v.6 time-series shows no global warming, at all, for 18 years 6 months from May 1997 to October 2015. Try doing your own research rather than lifting it from propaganda sites.
Had you done your own research, you would perhaps have discovered by now (for this is at least the third cut-and-paste of the same posting by you, which is a breach of site rules) that there is no UAH v.7.
Conclusion: whichever climate-Communist advocacy group is paying you $98,000 p.a. to troll for totalitarianism at sites like these in the hope of scaring off others who might otherwise find the courage to express dissent from the Party Line on climate is not getting good value for its money.
My anonymity is perfectly reasonable. I make no false claims as to my identity. For instance, I wouldn’t claim to have been a science advisor to Margaret Thatcher if I hadn’t been nor would I claim to be a member of the House of Lords if I weren’t.
I admit my mistake re. UAH v7. I meant the one you quote from, UAH v6. This data set is not officially recognised as the gigantic adjustments to UAH v5.6 have not been peer reviewed. There appears to be no just cause for these adjustments other than to eliminate the 0.104c per decade warming trend recorded by UAHv5.6.
You do yourself no favours by calling me out on my anonymity but then claiming you know I am paid by communists. I can confidently and honestly say I receive no payment from any group or person regarding what I write or say about climate change. Christopher Monckton can make no such claims, having been paid by the fossil fuel funded heartland institute.
Delivering cheap insults from behind a cloak of anonymity is cowardice. You are no more an expert on the peerage than you are on the climate. According to the legal opinion I obtained when I had received notice from journalists that the Clot of the Parliaments had opined that I was not a member of the House, the Clot is wrong and I am a member, albeit without the right to sit and vote. There is nothing the Clot can do about it.
As to the advice I gave to Margaret Thatcher, I advised her on a number of scientific questions during my period at the Downing Street policy unit from 1982-1986. It is not clear to me on what basis you assert the contrary: but it is certainly no basis in fact.
You have at least conceded that there is no version 7 of UAH. However, version 6 is close to the RSS dataset, which is peer-reviewed, so no doubt in due time Dr Christy and Dr Spencer at UAH will give an account of their changes in a reviewed journal in the usual way.
If you behave like a paid climate-Communist troll I am entitled to state that that is what you are. By directing falsehoods and insults at me from behind a cloak of craven anonymity you are certainly a coward.
LOL – Monckton is citing a clot as an authority. One clot citing another… hohoho
You mean to say that Spencer has not even explained why he ‘tampered’ with his data set and yet you still accept it?
I think your pith helmet is on a little tight.
http://farm6.staticflickr.com/5509/14208730053_2999c0d7e3_o.jpg
LOL! So cruel!
…but funny as well…
“Oh, the grand old Duke of York”…
Is Chris a birther as well? It’s difficult to keep track of the crazy…
It’s a conspiracy of the Clot of Parliaments and the paid Climate-Communist Trolls! lol!
Glad you like my Gilbert & Sullivan costume. I wear it for Victorian evenings around the piano.
But, on any view, that is off topic. The fact that there has been no global warming for 18 years 9 months is the toplc. And on that topic you appear to have nothing to say: an admission, perhaps, that the head posting is in all respects true.
Yes I do like your Gilbert & Sullivan costume, it’s very fitting….. though not in the supply of blood to the brain sense.
Oh, and here are four terrestrial data sets prepared by four different scientific institutions on three different continents, all of which show warming in the last 18 years & 9 months:
http://climate.nasa.gov/system/content_pages/main_images/1309_Temp_anomaly.jpg
Lord Haw Haw Monckton does not set out to do himself favours.
He sets out to bait, happy to insult others though at times his bottom lip comes out for a quiver when people are rude back to him.
As far as anonymity is concerned, he is perfectly happy for the Heartless Institute et al. to channel secret funds through anonymous channels, presumably because a little bit falls into his pockets to sweep him off on round the world junkets and keep him in sherry.
Why do you accept the UAH v.6 figures when they have been tampered with?
I was one of those who asked for a re-examination of the dataset because statistical tests showed it was running artificially hot. Those of us who thought that were right: indeed, the proprietor of this website, when the new version came out, contacted me to say I had called it correctly.
So, a well known classicist peddler of nonsense, gets the thumbs up from the political ideologue who runs a propaganda project for a conservative think tank ……… spare me your self adulation, and let us all know when anyone gets round to peer reviewing Spencer’s latest offering.
No, UAH shows a warming trend of 0.104c per decade since 1997. http://www.ysbl.york.ac.uk/~cowtan/applets/trend/trend.html
It seems the mods won’t allow me to inform you that v.7.0 of this dataset has been massively adjusted and that these adjustments are not officially recognised as they have not been peer reviewed, unlike the minor corrective tweaks to the surface data. Odd.
UAH shows a warming trend of zero from May 1997 to October 2015, using the standard least-squares linear-regression model recommended by the IPCC and by Phil Jones at East Anglia.
And I’m not surprised that the moderators would not allow you to inform me about v. 7 of the dataset. The last adjustment, several months ago, took the series from v. 5.6 to v. 6.0, where it is at the moment. As part of my usual due diligence before adopting the new version, I wrote to Dr Roy Spencer, who keeps the dataset, and he confirmed what I had long suspected: that there had been some errors in his data that did not exist in the RSS data. When the UAH data were corrected for that error and for various other, smaller errors, the result was the new dataset. Dr Spencer made no attempt to push the data in one direction or another: in his words, in a splendid email to me, “It is what it is.”
I do congratulate Planet8788 on having given the paid climate-communist trolls who regularly infest sites such as this a run for their money. The purpose of the environmental-Socialist extreme advocacy groups that pay them is to ensure that here, as everywhere else, anyone who expresses skeptical opinions is terrorized into silence by a barrage of co-ordinated, lavishly-funded hate-speech. The technique, invented by Goebbels and perfected by Ion Mihai Pacepa, former head of the Desinformatsiya directorate of the KGB, does work well to silence dissenters, who, not being paid as the climate-Communist trolls are, eventually tire of trying to express their own legitimate viewpoint. By methods such as this, a kind of dismal, enforced “consensus” has been inflicted on the world.
The reason why the totalitarian trolls are so very angry with me is that I can’t be silenced, and they have at last begun to discover that even their systematic attempts to trash my reputation (see e.g. my Wikipedia entry, which is vile untruth artfully dressed up) have backfired on them, because third parties watching this debate, and not participating because they fear that they will be subjected to the same hate speech, threats etc. that every effective climate skeptic is compelled to endure, are beginning to realize that in my case, as in many others, the hate speech is a little too shrill and a little too obviously co-ordinated, with a few key web pages that can be endlessly linked to, etc.
But the money for climate hysteria is beginning to run dry, and no small part of the reason is the failure of the usual suspects to produce credible, scientifically serious answers to the growing and now embarrassingly large discrepancy between prediction and reality.
So, well done Planet8788. You have been more than usually persistent and courageous in facing down these paid climate-Communist trolls, who spread their poisonous hate-speech and their ingenious falsehoods from behind a cowardly safety-curtain of anonymity. However, the prosecuting authorities are now taking a real interest in the many complaints from skeptics that a serious and elaborately-coordinated fraud has been practised, and their net is beginning to widen to take an interest in how the climate-Communist advocacy groups have paid large sums in fraudulent attempts to silence dissenters from the Party Line.
I confidently expect that, in due course, some of the regular merchants of falsehood who appear over and over again on these threads, often making rebarbatively repetitive cut-and-paste postings, will discover that the anonymity they thought they enjoyed will not protect them from eventual prosecution as the fraudulent aspects of the climate scam begin to reach the criminal courts.
That is not to say that every believer is a fraudster. Far from it. As Lenin used to say, where should we be without the useful idiots? It is not a crime to be an idiot. But it is a crime knowingly and persistently to lie with the intention of deceiving others, either with intent to profit or with intent to cause loss. Several of the paid climate-Communist trolls here are now well known to the authorities, who are marshaling the evidence. No small part of that evidence is to give the trolls fair warning that if they depart from the truth in future they may face jail. Then, if they persist in their lies and deceptions, their intent can be more easily demonstrated.
Since the fraud of which these creeps are a willing and profiteering part is arguably the largest fraud ever perpetrated, their punishment will not be small when they are eventually brought to book. They can expect long prison sentences. And that will serve them right. They thought anonymity would protect them. Well, it won’t.
“paid climate-communist trolls “
“…environmental-Socialist extreme advocacy groups that pay them “…
“..a barrage of co-ordinated, lavishly-funded hate-speech. The technique, invented by Goebbels…”
” climate-Communist trolls”
“…a kind of dismal, enforced “consensus” has been inflicted…”
I am grateful to Robert for his acknowledgement of the dismal effect that his bullying in these threads appears calculated to achieve. It is failing, though.
Last poll I saw showing even Republicans not quite so wiling to follow their ‘party line”….
I don’t get my science from opinion polls; I get it from studying the theory and the data, and reading papers in the learned journals, and sitting at the feet of learned professors and doctors. I certainly don’t get it from some political party or another. But the Republican Party has shown itself uniquely courageous in standing up to the sneering hate-speech of the climate Communists and stating, quietly but firmly, that the science is not settled.
Thank you….
” Republican Party has shown itself uniquely courageous in standing up to the sneering hate-speech of the climate Communists”
“The understanding of anthropogenic warming and cooling influences on climate has improved since the TAR, leading to very high confidence[7] that the global average net effect of human activities since 1750 has been one of warming, with a radiative forcing of +1.6 [+0.6 to +2.4] W m–2 (see Figure SPM.2). {2.3, 6.5, 2.9}”
SPM AR 4
“Continued emissions of greenhouse gases will cause further warming and changes in all components of the climate system. Limiting climate change will require substantial and sustained reductions of greenhouse gas emissions. ”
SPM AR5
“…the science is not settled.”
Oh, who to accept? Some blogger who won’t cite anything or the well researched statements of a team of scientists with demonstrated expertise in their specialized fields?
Don’t shift your ground. You denied that there were major differences between the forcing charts in AR4 and AR5. Now that you have looked at both graphs and seen some major differences, you suddenly drop all mention of the graphs and talk about Man having caused some warming instead. Not very intellectually honest, are you? Not very competent, either.
Meanwhile, the world continues not to warm by very much.
Actually, if you read, I asked for the evidence.
Then obfuscation…..
The evidence is in the two graphs. Compare them.
https://disqus.com/home/discussion/pbsnewshourformsrodeo/has_exxon_mobil_mislead_the_public_about_its_climate_change_research/#comment-2355657106
“totalitarian trolls are so very angry with me “
“spread their poisonous hate-speech “
“rebarbatively repetitive cut-and-paste “
“As Lenin used to say, …”
“Several of the paid climate-Communist trolls here are now well known to the authorities, who are marshaling the evidence”
“They can expect long prison sentences. And that will serve them right. ”
Must have been talking about Exxon.
Or maybe those ’19 year’ posts.?
And previously, you claimed I made 150k, amended to 155k, then amended with 35k expense account.
And named an organization.
And then showed no evidence.
“Several of the paid climate-Communist trolls here are now well known to the authorities, who are marshaling the evidence. “
Since you lurk behind an incomplete name, because you are too cowardly to declare who you are, I shall say exactly what I like about you, and you will have to take it, because it is not directed at a person: merely at a cult. That cult employs useful idiots like you to disrupt these threads with numbingly repetitive, futile and hate-filled comments.
Meanwhile, the world continues not to warm at anything like the predicted rate. And that is a fact that you should no longer seek to deny. It is the truth, as even the IPCC has accepted.
Again, said wo evidence;
“..not to warm at anything like the predicted rate. “
Asked and answered. All the evidence, in detail, with references, is in the head posting. Get someone to read it to you, or perhaps to draw some nice pictures if that’s easier for you to understand. I hear your library burned down the other day. Both books were burned – and one of them hadn’t even been colored in. So grow up, and accept the overwhelming evidence that the predictions made in the Holy Books of IPeCaC were false.
Is this you pretending that the IPCC is working to their 25 year old projections without acknowledging that within 5 years they had revised these and that their subsequent projections where significantly more accurate.
http://sciencepolicy.colorado.edu/prometheus/archives/IPCC%20Verification%2090-95-01-07%20vs%20Obs.png
So did you know that and just fancy sticking the lie in anyway or was it a case of not actually looking at the information for 25 years yet thinking you were competent to make a valid point?
Try getting Nanny to read the head posting to you in words of one syl-la-ble. You will see that not one but two graphs comparing IPCC’s exaggerated predictions with real-world data are given: one commencing in 1990, another in 1995. Both show that the predictions are considerable exaggerations.
Your graph above, which is not sourced, leading to the suspicion that it comes from a climate-Communist website, displays the various predicted trends, but does not display the changing actual trends to provide a proper comparison. The trend in both predictions and in observed temperatures has fallen, so that even the IPCC’s more recent predictions continue to be very substantial exaggerations.
It would be better if, instead of parroting the climate-Communist talking points that have long since been discredited (and some of them are the subject of fraud investigations), you did a little thinking. To you and your paymasters, perhaps, this is a childish propaganda war. To skeptics, this is a scientific question, and that requires a combination of study, understanding, and intellectual honesty.
Well Lord Haw Haw, if your own Nanny had spent some time instilling a sense of honesty into you instead of beating out any trace of socialism, perhaps you would not be distorting information to shore up your failing argument:
https://uploads.disquscdn.com/images/429e8f823a3acc483aedb6b5da094e8a9dc4c0a9d2e658336072cecb6a6a8593.jpg
As this doctored piece of nonsense demonstrates, you are a dab hand at manipulating graphs to show what you want them to.
GIven you obvious ‘skill’, I wonder that instead of complaining, you don’t just rustle up your own version showing the observed trend lines relative to the IPCC projection lines.
Perhaps I could then respond by providing another graph showing the rather closer match between the IPCC projections and the terrestrial data sets.
So, basically you are saying you are just making up stuff.
Interesting to see what you say next time you take questions at one of your slideshows.
“Since you lurk…
. . . .
…and hate-filled comments.”
What I am saying is this. Some years ago I was made aware that various climate-Communist advocacy groups were spending very large sums of money trying to trash my reputation, because they had concluded that my commentaries on the climate question were proving effective in high places (I advise several governments). So they set up a number of people to follow me and my writings full-time. They paid them a lot of money to do this. And they indulged in various interesting techniques to see to it that my speeches did not go viral on the internet.
On one occasion, I received a phone-call from Texas A&M University, from a professor who used to monitor the internet there. He told me had had come across clear evidence that someone (he did not know who) had spent at least $250,000 trying to stop a single speech of mine from attracting more than the 5 million hits it had already received on YouTube, spread across several sites.
Till then I had no idea of the lavish funding that these environmental-Socialist advocacy groups had available to them, still less of what vast sums they were willing to spend to try to silence me. Well, all that money was wasted. It got to the point where the sheer hatred shown to me by the climate Communists became so obvious to all that hard-Left websites are now the best recruiting-agent for the truth: people read the hate-speech about me and realize its perpetrators have gone way too far, and that nearly all of them are anonymous cowards like you – the lowest of the low.
So they contrast the detailed scientific answers I give to comments with the yah-boo from the likes of you, and they draw their conclusions. And their conclusions are not at all favorable to the climate-Communist cause. Which is why I take the trouble from time to time to reply in detail on these threads.
The fact, the undeniable fact, is that the rate of global warming since 1990 is a small fraction of the rate predicted by the IPCC in that year. It is all set out in the head posting. And when ordinary, unprejudiced, non-socialist, freedom-loving, open-minded people read these postings, they can see for themselves who is trying to tell the truth – and it isn’t you. You are paid a lot, and paid to lie, but the money is wasted, because you are so bad at it.
“Some years ago I was made aware …”
Vague, unsupported assertion.
“..various climate-Communist advocacy groups…”
Unnamed.
And semantically loaded namecaĺing.
“were spending very large sums of money ”
No numbers €, £, ¥..
“..trying to trash my reputation, ..”
No examples.
“…because they had concluded..”
No evidence.
” that my commentaries on the climate question were proving effective in high places”
No evidence
” (I advise several governments).”
No evidence.
And that is just the first sentence…..
Don’t be childish. When you are asked to produce evidence, you run a mile.
The science is clear: the world is not warming at anything like the predicted rate. See the head posting for details. And the fact of the long pause in global warming, almost unknown two years ago, is now known to all, thanks in no small part to these regular monthly updates. So you are going to have to produce some serious science if you wish to refute the evidence. Behaving like a small and more than usually unintelligent child will convince no one but yourself and – one hopes – your climate-Communist paymasters, who must be becoming more than a little concerned at your ineffectiveness, your repetitiveness, your stupidity, and your obvious lack of any knowledge of or interest in objective scientific truth.
D. Moynihan, “Everyone is entitled to his own opinion, but not to his own facts.”
monckton, “..I shall say exactly what I like…”
I am entitled to any facts I like about a hate-speaking, paid climate Communist troll who is too terrified and craven and cowardly even to admit who he is. That is the conspicuous fact: the cowardliness of those who post their hate speech here under pseudonyms. Most well-run websites ban trolls like you from making rude comments about your betters unless you are prepared to say who you are. But you are not man enough to admit who you are. You snipe childishly from behind a contemptible curtain of anonymity.
Most well run website would not allow your nonsense web space.
Many well-run websites print these graphs, which is why they have gained such a very large currency, and why they appear so often on television. After all, that is why your climate-Communist paymasters pay you to try – unsuccessfully – to disrupt the discussion threads here. The huge audience now watching these exchanges is 94% supportive of the truth as expressed in the head posting.
If anyone has some credible study that will disprove man made climate science, they would have no problem getting funding from Exxon et. al. to complete the study and publish it in credible journals. That research would be worth billions maybe even trillions to the fossil fuel boys.
Hell, even the Koch bros tried funding a legit science study to overturn the science – and failed – only to prove that the science was right all along. (The BEST Study)
At this point, the deniers are just immoral people with no values that are willing do people harm, even let people die, as long as there is profit to be made. These people are the most vile among us, with no motivation other than greed and profit.
I had to keep looking to make sure that screw was posted by ‘monckton’. Out of context, many of the statements fit to what Lord Monckton and Exxon have been doin.
And both well documented.
The Climate Deception Dossiers (2015)
Internal fossil fuel industry memos reveal decades of disinformation—a deliberate campaign to deceive the public that continues even today.
http://www.ucsusa.org/global-warming/fight-misinformation/climate-deception-dossiers-fossil-fuel-industry-memos
https://youtu.be/fbW-aHvjOgM
Monckton is a criminal sociopath and pitiful excuse for a human being. As long as he can make money, he doesn’t give one slime ball about the lives of others. He is just that slimy. Those right wing values voters version of hell was made for him.
The point we have been at for decades now is that even Exxon, like Big Tobacco et al, before it, KNEW of the dangers and used profits to fund criminal sociopaths to mislead the public on the science. Even Exxon and the Koch bros with unlimited resources have been unable to produce a credible study that disproves man made climate change. In fact, both of their studies came to the same conclusion as the consensus.
The only thing they have left is to attempt to create doubt; which takes time away from creating viable methods for mitigation, adaption to lessen the damage that is coming. Intentionally delaying the process for mitigation and adaption, so that fossil fuel boys can extend their profits, is a crime that will affect people, countries and economies.
“Doubt is our product, since it is the best means of competing with the ‘body of fact’ that exists in the minds of the general public. It is also the means of establishing a controversy.” — Brown & Williamson
I hope that some of the invetigations that seem to be in the offing start to shine a light on the network of funding agencies used by the likes of Exxon & the Kochs.
It would be really useful to have the full extent and nature of these exposed to public scrutiny.
Jmac, as usual, puts its foot in its mouth. The problem is indeed that climate “science” – or at least the notion that global temperatures are rising as predicted, when it is blindingly obvious that they are not – is man-made. It is fabricated. The evidence, however, is clear. The world is not warming as predicted, and even Dr Muller, the author of the BEST study, acknowledges that that is the case. Shortly before he published the results, I met him at the Los Alamos climate conference, at which he and I both gave talks. He seemed surprised when I told him what the results of his research would be. I said that he would broadly find the terrestrial data accurate. He asked what I thought of that conclusion. I said it did not much concern me, for at that time I had little reason to doubt the accuracy of the terrestrial data.
However, there has been considerable tampering since then, on a scale that does seem more than a little suspicious. Close analysis of the changes suggests that they were co-ordinated between the three longest-standing terrestrial datasets with the intention of falsely eradicating the pause in global warming, which all three datasets had previously shown. Suddenly, all three of them ceased to show that result, while the two satellite datasets continued to show it.
So, try making some scientific points rather than trotting out the tired climate-Communist insults you are paid to make. Those insults may well deter others from joining these threads, and no doubt that is your fell intent, for totalitarians have never believed in free speech, and when they are losing an argument, as they have completely lost this one, they resort to various tactics to try to deny or delay the truth. But, as the apocryphal Book of Esdras says, “Great is truth, and mighty above all things.” The world is not warming at anything like the predicted rate, and that fact, which cannot legitimately be denied, casts more than a little doubt upon the future predictions of doom that the climate Communists peddle.
I’m calling BS. What Los Alamos climate conference. Who sponsored the conference? Were you a paid speaker?
At scientific conferences, speakers are paid by their institutions. Having no institution, I was not paid.
When was the conference? Who sponsored it? What did you do to have such a nice retirement, that you can fly around the world at your own expense?
Perhaps you have not heard of the Los Alamos National Laboratory. They organize a climate conference every few years. I attend several such scientific conferences every year, including an annual visit to the seminars on planetary emergencies of the World Federation of Scientists. This year I shall also be going to a scientific conference in Paris, and another in Essen. For my work on climate sensitivity and on climate economics is interesting to those who are genuinely curious to know the truth, and the vast majority of scientists try to keep an open mind on subjects they have not themselves studied, so they are intrigued to hear a well-marshalled case for the skeptical position.
What I did was to be very successful with a series of inventions that other people thought were mad. But they worked. And they were profitable. For it is one thing to be able to invent something, and quite another to bring it to market successfully.
Monckton, nobody could make this stuff up.
1. Monckton claimed that he has developed a cure for Graves’ Disease, AIDS, Multiple Schlerosis, the flu, and the common cold. This is no joke–he actually filed applications to patent a “therapeutic treatment” in 2008, 2009, 2010, 2011, 2012, and 2013. Bluegrue speculates that Monckton is likely filing his applications and then letting them lapse after a year without paying the fees necessary to have the Patents Office take the process forward. That way, he can claim he has filed for a patent, but never has to have the Patent Office determine whether his “therapeutic treatment” is patentable (or pay any fees). Is it homeopathy? Massive doses of vitamin C? The world waits with bated breath.
2. The list of diseases cured by Monckton’s miracle tonic expands from time to time. At one point he claimed, “Patients have been cured of various infectious diseases, including Graves’ Disease, multiple sclerosis, influenza, and herpes simplex VI.” At another time he said, “Patients have been cured of various infectious diseases, including Graves’ disease, multiple sclerosis, influenza, food poisoning, and HIV.” Maybe some of you physicians out there can help me interpret this, but it looks to me like Monckton is claiming that his Wonder Cure will 1) wipe out any virus without harming the patient, and 2) cure auto-immune disorders that may (or may not) have initially been triggered by a viral infection. It is unclear to me whether bacterial infections are supposed to be affected since, for instance, food poisoning could be caused by either. [UPDATE: Monckton apparently is saying the miracle cure should be effective against both viral and bacterial infections, as well as prions.]
Off topic. Asked and answered. Get over it.
“Get over it!” ……….. was that the cure you invented?
What about flights, accommodation & expenses for your Heartless junket or the Australia trip.
None of your business, and off topic. However, my last Australia trip was a three-month Christian mission that I preached to the Pentecostal churches of the state of Victoria. And that was paid for by the love-offerings of the large congregations that attended my popular sermons. As for the American trip, I visited several destinations and the cost was, therefore, divided among those audiences before whom I had the honor to speak. All of this is quite normal, and it happens a thousand times as often for believers as it does for questioners.
None of my business …….. or in other words, the expenses were pretty generous thank you, a wee bit of a velvet lining to the old pocket eh?
The world is not warming as predicted ……….. only when you lie by omission and ignore model projects that are less than 25 years old.
Get Nanny to read the head posting to you in words of one syl-la-ble. Fig. 3 shows the IPCC predictions made in 2007, just eight years ago. Failed again. If you were only interested in the truth, you would be interesting yourself. But you are only interested in peddling the climate-Communist propaganda you are paid to peddle, and that is merely laughable, though no doubt profitable.
Meanwhile, millions in Africa starve and die of disease because environmental Communism won’t allow them cheap, clean, reliable, base-load coal-fired electricity. Just as the environmental Communists killed 50 million with their half-assed ban on DDT, now they are killing tens of milliions more by denying them electricity. It is time to make all forms of totalitarianism illegal on the ground of the crimes against humanity that they have committed and, alas, continue to commit.
My word you are right!
Apologies, I was so caught up in observing that one of your posts which stated …..
“Meanwhile, the rate of warming since 1990, on all three longest-standing terrestrial datasets and on both satellite datasets, is below the IPCC’s least warming rate predicted in 1990. That will continue to be the case if the coming el Nino is followed by a la Nina.”
……..contained such a deceptive omission of the subsequent predictions that I forgot to look at your many graphs.
However, I was studying these with renewed interest when it struck me as interesting that they had different starting dates and I was curious to see what would happen if you overlaid them, so here you go, a composite:
https://uploads.disquscdn.com/images/429e8f823a3acc483aedb6b5da094e8a9dc4c0a9d2e658336072cecb6a6a8593.jpg
So you have raised the green line showing the 2005(7?) prediction, exaggerating the mismatch between this and the RSS data set, whereas the purple line allows a like for like comparison against the 1990 IPCC prediction.
Bickmore was right, you pile on a dense layer of information, but just look carefully at it and there is always the error, or the lie.
How fantastic it would have been to be a fly on the wall at the meeting where the results were presented.
No kidding! Just found this article, thanks to some unwitting denier. You may have seen it already. dated Oct 23
How Exxon Shaped the Climate Debate – Steve Coll
http://www.pbs.org/wgbh/pages/frontline/environment/climate-of-doubt/steve-coll-how-exxon-shaped-the-climate-debate/
There is a strange pleasure to be had when a denier presents you with something genuinely interesting that they haven’t realized skewers their nonsense.
Thanks, for passing on the link, looks really good, I’ll try and read it over the next couple of days.
Nothing really new in it but it was from 2012 and it does mention Heartland specifically. Maybe the author has some solid evidence somewhere though.
Dayum that commie, tree hugging, hippie, liberal Marxist, New World Order Exxon and their bought and paid for, grant hungry, hoaxing scientists. 🙂
Even Exxon is calling BS on your BS.
The only comment mentioning me that any senior executive of Exxon Mobil has made, as far as I know, was by Rex Tillerson, the then newly-appointed chief executive, in 2006, when I had published a letter to Crowe and Boxer telling them not to try to stifle the free speech that the United States Constitution guarantees to its citizens. He said to one of his board meetings: “That letter seems to have gone everywhere.”
Apart from that, I’m not sure what you’re talking about. However, no serious scientist would dispute that the temperature records are as I display them to be, for it is a simple matter to download the data, perform the calculations and publish the graphs, which will not look any different to mine. So don’t be childish. If you have a serious scientific point to make, then make it. If all you can do is repeat mere yah-boo, then don’t bother.
I’m talking about your childish fetish for calling people “communists”. Even Exxon knows your BS is just BS. And I seriously doubt you ever met Rex Tillerson. Prove it, show us some written documentation, otherwise I call BS on that too, since everything else you say is BS.
And where did I say I’d met Rex Tillerson?
I call the anonymous, paid, climate-Communist trolls that infest these sites cowardly anonymous paid climate-Communist trolls for the good and sufficient reason that that is what they are. It is an unfailing mark of the Socialist – whether National Socialist, Communist Socialist or Environmentalist Socialist – to believe whatever Party Line is handed down, and to go on believing it and parroting it for long after it has reached its sell-by date.
If there had been a little more intelligent comment from jmac or Robert or CB or Icarus62 or any of the others who appear not only here but on dozens of other threads with depressing regularity and still more depressing lack of the slightest interest in the objective truth, one would suspect that perhaps they were not, after all, paid trolls. But they are – and lavishly paid at that. And all for nothing. For, in order to get this particular scam going, it was necessary for the climate Communists to make lurid predictions. They first did so in the late 1980s, and the IPCC joined in the fun in 1990.
But now, inevitably, those prejudiced and baseless predictions are not coming to pass. On the satellite data, there has been no global warming for 18 years 9 months. The terrestrial data would have shown something similar, had there not been a co-ordinated arrangement between the controllers of the datasets to make adjustments that had the effect of falsely getting rid of the Pause that all of them had shown until a couple of years ago. The RSS and UAH data continue to show the Pause, but the three terrestrial datasets, with less universal coverage and inadequate standardization of methodology and equipment, do not. Something is wrong somewhere, and my postings provide the data that allow people who are interested in the truth to see the data for themselves and draw their own conclusions.
And I do not thing the climate-Communist trolls would waste so much of their time with their hate-speech here unless they and their paymasters in the various lavishly-funded environmental-Socialist advocacy groups did not think these graphs were wrecking what little is left of the credibility of the Party Line.
In the end, like it or not, those original exaggerated predictions will prove to be the undoing of the IPCC. For they will not come to pass. And, in your heart of hearts, you begin to suspect that that may be true.
Well, if even Exxon knows your BS is just BS, are they communists too. 🙂 Didn’t you have one paper you couldn’t get published anywhere except by some sort of Communist China organizations?
Did you see the sixth chart in this article.
Monckton lays out all the data… You didn’t even read it.
https://lh3.googleusercontent.com/-mJ0fi3TjmgY/VjpQRyxyeCI/AAAAAAACa8g/6S1GhkYdLg0/s720-Ic42/monckton1980.png
So this is the tampered with chart that you elsewhere advise that Spencer has not given out any reason for changing.
How is this different from the terrestrial data sets that you reject because they have been altered?
Notice that is .4C since 1980 soooo…. .4 degrees cooling after 1940… and now .4 C warming after 1980.. No NET global warming. NONE.
grunt & sniff.
Fig. 1b plainly shows the small warming on the mean of the three longest-standing terrestrial datasets.
This does not contradict my post or its comment on you presenting the information in a skewed way e.g. you will note that I did not explicitly mention that you include the RSS graph either.
My argument is simple, if you want to understand what is happening, then compare the information on a like for like basis without scary mood music telling you what to think.
As an example here is an overlay showing the GISS, RSS & UAH data sets with trend lines.
http://www.woodfortrees.org/plot/gistemp/from:1980/to:2015/mean:12/plot/rss/from:1980/to:2015/mean:12/offset:-0.1/plot/uah/from:1980/to:2015/mean:12/offset:0.25/plot/gistemp/from:1980/to:2015/trend/plot/rss-land/from:1980/to:2015/trend/offset:-0.1/plot/uah/from:1980/to:2015/trend/offset:0.25
Can heartily recommend the Woodfortrees site. You don’t have to take my word or Monckton’s for anything but can check yourself.
The graphs since 1979 show warming at a rate equivalent to just 1.2 K/century: but that is well below half of the central estimate predicted by IPCC in 1990.
And determining a trend from 1979 tells us nothing about whether a trend from 1997 to the present has been accurately determined. The trend since 1997 is zero, even though the anthropogenic forcings that are supposed to be driving the warming are supposed to be increasing at what is supposed to be an accelerated rate.
The widening discrepancy between prediction and observation, between theory and practice, does not inspire much confidence in the over-politicized process of the IPCC. There is at present no basis whatsoever for alarm about Man’s influence on climate.
The graphs since 1979 …… that seems a bit vague, best to look at some, first, one of the early ones ….
http://www.npr.org/news/graphics/2015/09/gr-climate-report-137-300.png
…. that actually looks pretty accurate, what about another, again some older models ….
https://i.guim.co.uk/img/static/sys-images/Guardian/Pix/pictures/2013/10/1/1380599335494/ProjvsObs450.jpg?w=605&q=85&auto=format&sharp=10&s=8303b34642b603f93bd359c55da93ed5
…. which again look pretty good, so what about more up to date models ….
https://pbs.twimg.com/media/CMyMTjjWgAEeQvp.jpg
…. running a bit low but as you yourself admitted in the article we are heading into a strong El Nino period that is likely to bring temperatures back towards the center of the model predictions.
As the head posting makes quite clear, even a strong el Nino will not bring global mean surface temperature up even to the lower bound of the prediction that the IPCC made in that year. The scare was based on the original predictions. Those predictions have now been proven to have been wild exaggerations. On the CMIP5 models, the much-adjusted recent predictions, one would not expect to see more than 0.5 degrees’ warming by 2100, which is scarcely a problem, is it?
Deeply dishonest misdirection.
Yes the initial predictions where high but the IPCC addressed this by the second cycle of research and publishing.
Don’t you think you should give an accurate overview of the issue if you want people to understand.
This chart is a really useful summary:
http://sciencepolicy.colorado.edu/prometheus/archives/IPCC%20Verification%2090-95-01-07%20vs%20Obs.png
The above chart is deliberately misleading – indeed, it is the subject of an ongoing fraud investigation. The reason why it is fraudulent is that those who compiled it deliberately omitted to show the trend-lines of observed temperature change alongside those of predicted change; for, had they done so, it would have been apparent to all that each of the successive predictions of the IPCC has been excessive – a fact that the graph you reproduce was falsely intended to conceal.
Of course, this is a relatively small fraud, but it is part of a connected series of far more serious frauds that the security services and police forces of several nations have been investigating ever since the Climategate emails that let so much daylight into the corruption of the academic climate-science establishment.
One should try to find peer-reviewed sources wherever possible. Reviewers would – and certainly should – have made the points I have made about the self-evident defects in the above graph.
What a load of old tosh. The graph shows a range of IPCC predictions against the actual recorded temperatures. Anyone wanting to make a further point can add trend lines.
For it to be fraudulent it would have to misrepresent the information
………. and on that point your own graphs as displayed in figs 2 & 3 are a much better example of fraud.
A close look reveals something very odd about the second one, so I overlaid them:
https://uploads.disquscdn.com/images/429e8f823a3acc483aedb6b5da094e8a9dc4c0a9d2e658336072cecb6a6a8593.jpg
You have hiked up the green line showing the IPCC temperature predictions from 2005 exaggerating the difference between this and the RSS data set.
The purple line positions the 2005 prediction line with the same starting point as the 1990 red prediction line allowing a like for like comparison and aligning more closely with the overlay with all the prediction lines I posted previously.
http://sciencepolicy.colorado.edu/prometheus/archives/IPCC%20Verification%2090-95-01-07%20vs%20Obs.png
On another note, your grand investigation of Climategate fraud has had 6 years to work it out, so where are the prosecutions? Or is this just one more lie from the big book of Monckton fantasies?
Or perhaps the 9 separate investigations that cleared the scientists of any wrong doing in this ludicrous non scandal are more relevant.
Fig. 1b shows the small warming rate on the mean of the HadCRUT4, GISS and NCDC datasets. Try learning to read the head posting.
And I said that you FOCUS on one data set and have a BRIEF AND DISMISSIVELY worded reference to the others.
Given the central importance of the temperature data sets I would describe combining three data sets into one, while ignoring the Japanese Meteorological Association’s information all together as a very BRIEF summary of a lot of core information.
Don’t blub. If you want to produce your own graphs, write your own software or borrow someone else’s. My graphs, which are correctly determined and presented, show quite well – on all datasets, even the terrestrial tamperature datasets in which no one can now place any credence – that global warming (if it is happening at all) is not happening at anything like the predicted rate. Some of the reasons for the ever-growing and damaging discrepancy are to be found in my published scientific papers.
Graphs?
Here is a summary of the 4 main terrestrial data sets all of which show warming post 1998:
http://climate.nasa.gov/system/content_pages/main_images/1309_Temp_anomaly.jpg
Here is the UAH data set from 1995 to 2014 with the trend lines for 1997,1998 & 1999 overlaid, all showing warming post 1998:
http://www.woodfortrees.org/plot/uah/from:1995/to:2015/plot/uah/from:1997/to:2015/trend/plot/uah/from:1998/to:2015/trend/plot/uah/from:1999/to:2015/trend
Here is an overlay of temperature trends on model projections.
https://pbs.twimg.com/media/CMyMTjjWgAEeQvp.jpg
Interesting that even you agree that we are likely to see warming in the months ahead that would bring the temperature trend back towards the center of the model projections.
“The current el Niño, as Bob Tisdale’s distinguished series of reports here demonstrates, is at least as big as the Great el Niño of 1998. The RSS temperature record is beginning to reflect its magnitude.
From next month on, the Pause will probably shorten dramatically and may disappear altogether for a time. “
Why do the paid climate-Communist trolls endlessly repeat the lies they are paid so handsomely to tell from behind a safety-blanket of anonymity? The warming of the coming months will not even lift global temperatures to the lower bound of the extravagant 1990 prediction, equivalent to a near-linear warming of 1 degree by 2025, that was made by the IPCC in 1990.
And if you are incapable of determining the least-squares trend on the UAH data from May 1997 to October 2015, a period of 18 years 6 months without any global warming, precisely as I had said, then don’t parade your ignorance here. Go and learn some math.
It’s a mark of how pathetically threadbare your argument is that you have to resort to such a cheap trick to come anywhere close to making a point.
For anyone interested in reality, Monckton here is referring to the IPCC’s VERY FIRST projections carried out TWENTY FIVE Years ago.
What Monckton DOES NOT TELL YOU is that the IPCC corrected their projections in 1995, significantly reducing the projected warming, nor
does he tell you that the IPCC further refined their projections three more times over the following 20 years. This diagram provides a neat summary.
http://sciencepolicy.colorado.edu/prometheus/archives/IPCC%20Predictions%2090-95-01-07.png
And this one shows the current model that Monckton doesn’t like, related to temperature showing the most recent temperature rise as reflected in the terrestrial data sets that Monckton really, really, really doesn’t like.
https://pbs.twimg.com/media/CMyMTjjWgAEeQvp.jpg
All surface temperature data show a statistically significant warming trend since 1997 http://www.ysbl.york.ac.uk/~cowtan/applets/trend/trend.html
The rate of warming since February 1997 is exactly as I have shown it in the head posting. It is a warming of 0.21 degrees. This counts, statistically speaking, as “barely significant”, since the published combined coverage, bias and measurement uncertainties are 0.16 degrees. It is equivalent to just 1.1 degrees/century, which is little more than one-third of the 2.8 degrees/century predicted by IPCC, as its central estimate, in its 1990 First Assessment Report.
The central point is not only that the two datasets with the most complete coverage – RSS and UAH – show no global warming at all for getting on for 19 years, but also that the terrestrial tamperature datasets, despite numerous adjustments that account between them for just on half of all 20th-century warming, still show so very much less warming than had been predicted.
In anticipation of being called childish …… liar, liar, pants on fire.
When I was six I was taught not to chant Socialist slogans such as yours. You are unable to refute any of the fact stated above, and, accordingly, you tacitly concede that they are correct. So kill the sloganizing, learn some science, and grow up.
This is the same Heartland Institute the Tobacco companies used to deny the science that tobacco causes cancer. Millions died. These people are the most vile among us. They have no values whatsoever, and are willing to lie their butts off about anything, as long as there is money to be made.
Even Exxon knew about man made Climate Change decades ago, then just like big tobacco did, in order to prolong their profits started spending money to finance the blogs, opinion pieces, political campaigns, and think tanks to promote anti-science and cause doubt in folks minds and delay action.
http://insideclimatenews.org/content/Exxon-The-Road-Not-Taken
And you guys are letting Africans die like they are animals.
Get your facts straight Jmac!
It was already well established in the late 1950’s that smoking caused cancer. In 1964 the Surgeon General recognized smoking could cause lung cancer. The Heartland Institute didn’t even exist back then. It was founded in Chicago in 1984. GET EDUCATED!
Banerjee the lead reporter of that article from Inside Climate News stated: “We never said Exxon stopped its research, nor suppressed the results.”
Exxon didn’t know about AGW decades ago, because there was no scientific certainty. Even today there isn’t any empirical evidence that CO2 is the driver of climate.
In response to Inside Climate News, Exxon spokesman Alan Jeffers responded, showing that the article was inaccurate and left out numerous examples where Exxon is still conducting research.
https://www.documentcloud.org/documents/2487075-jeffers-statement.html
Did you know that Inside Climate News is funded by anti-oil and gas foundations?
No bias there what so ever! s/.
Did you know that even Exxon knows your BS is BS?
Apparently far right wingers and their think tanks like the Heartland Institute think it is ok for a company or anyone to knowingly sell a product that they know can do harm (even cause death) to you and your friends. And use profits made from said product, to sponsor disinformation about the peer reviewed science warnings about the dangers of the product. They call that capitalism, especially when they get to have society pay for the damage done. The deniers are just immoral people with no values, that are willing do people harm, even let them die, as long as there is profit to be made. These people are the most vile among us, with no motivation other than greed and profit.
So i take it you don’t use any electricity made by coal/oil/or gas?
Ahhhh now the truth comes out.. you are just an ignorant socialist utopian.
Even Google says you are just a bunch of liars, hurting our children and our grandchildren and making the world a much worse place.
Google’s chairman, Eric Schmidt…
“The facts of climate change are not in question anymore. Everyone understands climate change is occurring, and the people who oppose it are really hurting our children and our grandchildren and making the world a much worse place. And so we should not be aligned with such people — they’re just, they’re just literally lying.”
http://www.theguardian.com/environment/2014/sep/23/google-to-cut-ties-with-rightwing-lobby-group-over-climate-change-lies
Another leftist who also likes importing cheap labor from other countries. Another globalist in short. Another liar. Another fool.
So even Exxon and Google know you are a bunch of liars really hurting our children and our grandchildren and making the world a much worse place. And your response is to double down on stupid.
Exxon certainly hasn’t said that. And Schmidt is your communist butt buddy… Totally not a climate scientist… nor a chemist. Are the satellites lying too? Did the Koch bros. program them?
Even the Koch bros know you are lying.
Hell, even the Koch bros tried funding a legit science study to overturn the science – and failed – only to prove that the science was right all along. (The BEST Study)
How can anyone not know that? The deniers are just immoral people with no values that are willing do people harm, even let people die, as long as there is profit to be made. These people are the most vile among us, with no motivation other than greed and profit.
“Doubt is our product, since it is the best means of competing with the ‘body of fact’ that exists in the minds of the general public. It is also the means of establishing a controversy.” — Brown & Williamson
The satellites are lying too?
You are the ones killing AFricans.. The Kochs build hospitals.
You are nothing but a big fat communist hypocrite.
Exxon = communist now = pretty ignorant comment.
Desperate times for the liars – as Google calls you.
Following monckton’s lead….
“You are nothing but a big fat communist hypocrite.”
only a communist keeps repeating the same mindless propoganda.
monckton prefers “climate communist”, so your “communist” is weak sauce.
My old Republican party does most of that now (I left when the Cato Institute suggestion to use “Leninist” propaganda, and implied soft sabotage, seemed to be so corruptly implemented in the 1996 Newt Gingrich/Frank Luntz GoPac memo, “Language: A Key Mechanism of Control).” See http://www.informationclearinghouse.info/article4443.htm
Though implemented by the Republican party for political purposes, it seems the model Exxon likes as they try to create doubt about their own science now. Why not ask their original scientists whether they think the current efforts are science, politics, or just plain propaganda for profit?
Well, we are at monckton’s homesite…. and the sycophants are following his best examples….
“…communist butt buddy.”
When the troll starts to post something of substance. I will respond with something of substance.
Another example…”troll”
monckton claims he knows I earn 155k +35k in expense account and even names my employer….
That sounds like trolling….
Still waiting for a post of any substance…. It’s getting kind of old.
Thanks for yet another set of unsupported assertions.
Please continue showing us you (and so many other denialists) don’t have a working sense of what is taught in terms of intellectual rigor and honesty:
Evaluaing Information
How to Evaluate Resources
The CRAAP Test* is a useful guide to evaluating resources. CRAAP is an acronym for the general categories of criteria that can be used to evaluate information you find. Use the CRAAP Test to decide if information is appropriate for your research!https://www.gettysburg.edu/lib…
Research Process Rubric – Middle School
. . . .
0 points
Presented content which was unfocused, poorly organized, showed little thought or effort and lacked supporting evidence
https://www2.uwstout.edu/conte…
And more examples of copy pasting…
Ill stop when you stop.
ExxonMobil gave millions to climate-denying lawmakers despite pledge
Under pressure from shareholders, company promised eight years ago to stop funding climate denial – but financial and tax records tell a different story
“Exxon funded the Mississippi senator Roger Wicker, who cast the single no vote earlier this year against a symbolic “sense of the Senate” resolution that climate change was real and not a hoax. The resolution passed 98-1. Wicker, who received $14,000 from Exxon, voted no.”
http://www.theguardian.com/environment/2015/jul/15/exxon-mobil-gave-millions-climate-denying-lawmakers
That’s meaningless tripe. Not science.
“Warming of the climate system is unequivocal, and since the 1950s, many of the observed changes are unprecedented over decades to millennia. The atmosphere and ocean have warmed, the amounts of snow and ice have diminished, and sea level has risen. {1.1}
Each of the last three decades has been successively warmer at the Earth’s surface than any preceding decade since 1850. The period from 1983 to 2012 was likely the warmest 30-year period of the last 1400 years in the Northern Hemisphere, where such assessment is possible (medium confidence). The globally averaged combined land and ocean surface temperature data as calculated by a linear trend show a warming of 0.85 [0.65 to 1.06] °C 2 over the period 1880 to 2012, when multiple independently produced datasets exist (Figure SPM.1a). {1.1.1, Figure 1.1}” SPM ipcc.ch
In 1981, The 1940’s were the hottest… The temperature record has been massively manipulated.
Read Hansen et. al 1981. See what it looked like then.
Said wo a cite.
Well done!
No, wait…
University of Wisconsin – Stout
Research Process Rubric – Middle School
0 points
“Presented content which was unfocused, poorly organized, showed little thought or effort and lacked supporting evidence.”
https://www2.uwstout.edu/content/profdev/rubrics/middlelschresearchrubric.html
I schooled you on Antarctica… Now I am going to school you again.
http://pubs.giss.nasa.gov/abs/ha04600x.html
Note page 961. NASA again.
Tell us exactly how much. When. Where.
Seems a bit odd that in a field full of new research, you have to go back a third of a century to show us something you think sports your claim….
How much what?
Page 961. Temperature chart.
Compare it to today’s.
Is that hard to understand? It will show you how much it has been adjusted.
Oh, eyeballing.. so sciency.
You can take out your ruler if you want.
Or you could do an analysis of the data.
And show the sources that have been informing your opinion.
I have analyzed it. It is a chart. It shows 1940 being much hotter. It shows significant cooling after 1940. That cooling has been erased.
You can’t read a chart? You are just as smart as that other dolt on here aren’t you.
Show us the “I have analyzed it”. Funny how you can’t cite something actually published….
Actually, not funny.
I am citing published work you moron. Hansen, et al. 1981. I posted the link 5 times.
LOOK AT IT YOU FUCKING MORON.
“LOOK AT IT YOU FUCKING MORON.”
https://disqus.com/home/discussion/climatedepot/no_global_warming_at_all_for_18_years_9_months_a_new_record_8211_the_pause_lengthens_again_just_in_t/#comment-2347661775
“You can take out your ruler if you want.”
https://disqus.com/home/discussion/climatedepot/no_global_warming_at_all_for_18_years_9_months_a_new_record_8211_the_pause_lengthens_again_just_in_t/#comment-2347594700
Still banging on about a 35 year old research paper?
The reason no one is looking at the paper is because it is 3 decades old and at this stage utterly, utterly, utterly irrelevant!
It is completely relevant and aleays will be. All the modifications correspons perfectly with CO2 concentrations.
All 4 independent [hahahahah) databases have been modified the same way.
So you have analyzed the chart on P961 of the geriatric report.
It shows approx. 0.5 deg C temp rise between 1880 & 1940 followed by a fall of approx 0.4 deg C between 1940 & 1970.
Here are the collected modern terrestrial charts:
https://a.disquscdn.com/get?url=http%3A%2F%2Fclimate.nasa.gov%2Fsystem%2Fcontent_pages%2Fmain_images%2F1309_Temp_anomaly.jpg&key=tQU3_OETqJ4TazpYud5dWg
They differ from the Hansen chart during the early C20th but the rise in temp between 1880 & 1940 is approx. 0.5 deg C, followed by a fall of approx 0.4 deg C between 1940 & 1970.
So basically two charts prepared 35 years apart separated by over 3 decades of scientific & computer technology development show very similar information.
This is what you have been wittering on about.
This is beyond idiotic.
The total temp change has more than doubled.
I know, you don’t want to be bothered by such facts. Then you have to explain them.
Hansen, et. al 1981
And the best published analysis is ?
“You can take out your ruler if you want.”
https://disqus.com/home/discussion/climatedepot/no_global_warming_at_all_for_18_years_9_months_a_new_record_8211_the_pause_lengthens_again_just_in_t/#comment-2347594700
I know… I expected that you could read a chart from a published paper… my bad.
They aren’t independently produces. What happened to Hansen et. al 1981?
???
Look it up… It’s on the NASA website. Look at the temperature chart. THis was right before he turned into a raving lunatic and started changing the record drastically. (ACtually he had already started probably.)
Thanks for yet another set of unsupported assertions.
Please continue showing us you (and so many other denialists) don’t have a working sense of what is taught in terms of intellectual rigor and honesty:
Evaluating Information
How to Evaluate Resources
The CRAAP Test* is a useful guide to evaluating resources. CRAAP is an acronym for the general categories of criteria that can be used to evaluate information you find. Use the CRAAP Test to decide if information is appropriate for your research!https://www.gettysburg.edu/lib…
Research Process Rubric – Middle School
. . . .
0 points
Presented content which was unfocused, poorly organized, showed little thought or effort and laced supporting evidence
https://www2.uwstout.edu/conte…
Thanks for yet another set of unsupported assertions.
Please continue showing us you (and so many other denialists) don’t have a working sense of what is taught in terms of intellectual rigor and honesty:
Evaluating Information
How to Evaluate Resource
The CRAAP Test* is a useful guide to evaluating resources. CRAAP is an acronym for the general categories of criteria that can be used to evaluate information you find. Use the CRAAP Test to decide if information is appropriate for your research!https://www.gettysburg.edu/lib…
Research Process Rubric – Middle School
. . . .
0 points
Presented content which was unfocused, poorly organized, showed little thought or effort and lacked supporting evidence
https://www2.uwstout.edu/conte…
Thanks for yet another set of unsupported assertions.
Please continue showing us you (and so many other denialists) don’t have a working sense of what is taught in terms of intellectual rigor and honesty:
Evaluating Information
How to Evaluate Resources
The CRAP Test* is a useful guide to evaluating resources. CRAAP is an acronym for the general categories of criteria that can be used to evaluate information you find. Use the CRAAP Test to decide if information is appropriate for your research!https://www.gettysburg.edu/lib…
Research Process Rubric – Middle School
. . . .
0 points
Presented content which was unfocused, poorly organized, showed little thought or effort and lacked supporting evidence
https://www2.uwstout.edu/conte…
“…communist butt buddy…
“https://disqus.com/home/discussion/climatedepot/no_global_warming_at_all_for_18_years_9_months_a_new_record_8211_the_pause_lengthens_again_just_in_t/#comment-2347415217
Thanks for yet another set of unsupported assertions.
Please continue showing us you (and so many other denialists) don’t have a working sense of what is taught in terms of intellectual rigor and honesty:
Evaluating Information
How to Evaluate Resources
The CRAAP Test* is a useful guide to evaluating resources. CRAAP is an acronym for the general categories of criteria that can be used to evaluate information you find. Use the CRAAP Test to decide if information is appropriate for your research!https://www.gettysburg.edu/lib…
Research Process Rubric – Middle School
. . . .
0 points
Presented content which was unfocused, poorly organized, showed little thought or effort and lacked supporting evidenc
https://www2.uwstout.edu/conte…
Your kind are killing more Africans than Global warming ever will.
The deniers are just immoral people with no values that are willing do people harm, even let people die, as long as there is profit to be made. These people are the most vile among us, with no motivation other than greed and profit.
“Doubt is our product, since it is the best means of competing with the ‘body of fact’ that exists in the minds of the general public. It is also the means of establishing a controversy.” — Brown & Williamson
Yep… You are the satellite data denier… and you describe yourself perfectly… Congratulations.
Exxon knows your BS is just BS. Desperate times for the liars – as Google calls you.
You may have already seen this from the Union of Concerned Scientists
The Climate Deception Dossiers (2015)
Internal fossil fuel industry memos reveal decades of disinformation—a deliberate campaign to deceive the public
http://www.ucsusa.org/global-warming/fight-misinformation/climate-deception-dossiers-fossil-fuel-industry-memos
The evidence just keeps on mounting. Lot of evidence there in those dossiers.
ExxonMobil gave millions to climate-denying lawmakers despite pledge
Under pressure from shareholders, company promised eight years ago to stop funding climate denial – but financial and tax records tell a different story.
““In 2008 we will discontinue contributions to several public policy groups whose position on climate change could divert attention from the important discussion on how the world will secure energy required for economic growth in an environmentally responsible manner,” Exxon said in its 2007 Corporate Citizenship report.”
http://www.theguardian.com/environment/2015/jul/15/exxon-mobil-gave-millions-climate-denying-lawmakers
Thanks for the link. Kinda surprised ‘snowball’ Inhofe works so hard for what exxon pays him, …
That’s only the amount in that one traceable document. But of course Inhofe has been stump broke for fossil fuel boys for years.
I was figuring that ‘snowball’ has convinced himself that he believes what he’s shoveling so it doesn’t seem so much a bribe. Then the acountants cut back on the payments….
Yes, and with Citizens United in place it is difficult to track the PAC money.
So now Citizens United is controlling the satellites?
It’s reassuring to watch you represent the side of the deniers. Find another wingnut who’s out of bullets, and form a self-esteem building club.
Out of bullets… I don’t need any… you are already full of holes.
You are just ignorant or you are a truly vile person that doesn’t care about the well being of others. And yes, you are out of bullets. Even Exxon knows it.
You are killing AFricans every day.
Enviroliars have been trying to explain “the pause” for the last dozen years or so… now, funny enough, they’ve decided to just announce there was no pause. These guys have no respect for themselves.
http://realclimatescience.com/wp-content/uploads/2015/11/2015-11-07-03-21-221.png
Record ice growth this fall in the Arctic… All those Hiroshima bombs of heat doing their thing. Now above 2005 levels for area… 19 years with no warming. 10 years with no melting.
Greenland also having a second stellar year of snowfall.
JMAC,
When are you going to post actual facts? Never… Got it.
I’m going to dissect this post which the anti-capitalist JMAC troll down below keeps posting. Here is the link.
http://insideclimatenews.org/news/15092015/Exxons-own-research-confirmed-fossil-fuels-role-in-global-warming
It quotes an Exxon “scientist” giving a presentation. Apparently these neo-communists think this is some type of smoking gun because they are brain dead.
“In the first place, there is general scientific agreement that the most likely manner in which mankind is influencing the global climate is through carbon dioxide release from the burning of fossil fuels,” Black told Exxon’s Management Committee, according to a written version he recorded later. It was July 1977 when Exxon’s leaders received this blunt assessment, well before most of the world had heard of the looming climate crisis. A year later, Black, a top technical expert in Exxon’s Research & Engineering division, took an updated version of his presentation to a broader audience. He warned Exxon scientists and managers that independent researchers estimated a doubling of the carbon dioxide (CO2) concentration in the atmosphere would increase average global temperatures by 2 to 3 degrees Celsius (4 to 5 degrees Fahrenheit), and as much as 10 degrees Celsius (18 degrees Fahrenheit) at the poles. Rainfall might get heavier in some regions, and other places might turn to desert.”
Just like now… all of this is pure speculation. The past has been cooled more than present has warmed. UTTER GARBAGE.
ExxonMobil gave millions to climate-denying lawmakers despite pledge
Under pressure from shareholders, company promised eight years ago to stop funding climate denial – but financial and tax records tell a different story
“Exxon funded the Mississippi senator Roger Wicker, who cast the single no vote earlier this year against a symbolic “sense of the Senate” resolution that climate change was real and not a hoax. The resolution passed 98-1. Wicker, who received $14,000 from Exxon, voted no.”
http://www.theguardian.com/environment/2015/jul/15/exxon-mobil-gave-millions-climate-denying-lawmakers
Did you read the article? There is no warming. The satellites say so. And the only warming in the surface temperature record is MANN-Made.
Yes, Monckton makes that claim.
No actual scientist says that, even the guys in charge of those satellites.
That should give you a clue.
Though I doubt it does…
That’s because the guy in charge of satellits would probably get fired. The data is what the data is… and even the guy in charge of the satellites doesn’t have a good explanation… If he does… what is it? WHAT IS IT?
Start by reading how the sat data Ned adjusting. On the sat website.
“WHAT IS IT?”
Not every other week like the surface data. They are on rev 6. Surface record on rev. 6000… all in one direction. Whatever it takes to support global warming.
Meanwhile sea ice stable. Antarctic ice stable. yada yada yada.
Thanks for yet another set of unsupported assertions.
Please continue showing us you (and so many other denialists) don’t have a working sense of what is taught in terms of intellectual rigor and honesty:
Evaluating Information
How to Evaluate Resources
The CRAAP Test* is a useful guide to evaluating resources. CRAAP is an acronym for the general categories of criteria that can be used to evaluate information you find. Use the CRAAP Test to decide if information is appropriate for your research! https://www.gettysburg.edu/library/research/tips/webeval/index.dot
Research Process Rubric – Middle School
. . . .
0 points
Presented content which was unfocused, poorly organized, showed little thought or effort and lacked supporting evidence
https://www2.uwstout.edu/content/profdev/rubrics/middlelschresearchrubric.html
Arctic Ice Volume about the same as 2007 according to PIOMAS. http://neven1.typepad.com/
Arctic Sea Ice Area… about the same as 2005 according to DMI. (see chart below).
Satellites show temperatures stable for almost 19 years. (see this article).
https://www.nasa.gov/content/goddard/antarctic-sea-ice-reaches-new-record-maximum
Antarctic Sea ice reached a peak in 2014.
Antarctica gaining ice overall.
http://www.usatoday.com/story/weather/2015/11/04/antarctica-ice-global-warming-climate-change/75155630/
Despite all this, Climastrologists keep continually calling it the hottest month ever….
The data tampering has been massive. Here is Hansen’s paper from 1981. http://pubs.giss.nasa.gov/abs/ha04600x.html
Look at what the temperature record looked like then. Compare it to what it looks like now. If ice is stable now, 1890’s must have been an ice age.
Even Exxon knew about man made Climate Change decades ago, then just like big tobacco did, in order to prolong their profits started spending money to finance the blogs, opinion pieces, political campaigns, and think tanks to promote anti-science and cause doubt in folks minds and delay action.
http://insideclimatenews.org/content/Exxon-The-Road-Not-Taken
What did they know? Don’t just put a link.
We don’t know anything except that the temperature record has been mangled. And all the models have been way off.
So, Exxon knows you are full of BS, yet you don’t? Am I right?
You are the one denying the satellite data, the sea ice data. The Great Lakes data.
You still haven’t summarized for me, or anyone, what exactly Exxon knew….
You are too stupid too even be able to write a scientific sentence. the best you can do is: I hate capitalism.
Ah, still using insults instead of citations…
Has he called you a communist yet? This guy is apparently some kind of wannabe understudy to Monckton, as you well know that is one of Moncktons fall back positions. 🙂
As of now, it looks like you are the sole recipient….
Bummer. lol
Hansen et. al, 1981… Page 961
Capitalism? Apparently far right wingers and their think tanks like the Heartland Institute think it is ok for a company or anyone to knowingly sell a product that they know can do harm (even cause death) to you and your friends. And use profits made from said product, to sponsor disinformation about the peer reviewed science warnings about the dangers of the product. They call that capitalism, especially when they get to have society pay for the damage done. The deniers are just immoral people with no values, that are willing do people harm, even let them die, as long as there is profit to be made. These people are the most vile among us, with no motivation other than greed and profit.
Satellites = NO warming
Surface Temp. Record = massively manipulated.
Exxon doesn’t know squat…
Climastrologists dont know squat.
every model has been wrong… Just like AR5 showed.
Hmmm, Chapter 9 says you are lying.
Which would be a real good reason why you didn’t actually quote the source
Previously spewed by planet8788, “…every model has been wrong… Just like AR5 showed.”
http://judithcurry.com/2014/01/06/ipcc-ar5-weakens-the-case-for-agw/
This increase in confidence in the main conclusions in the AR5 SPM seems unwarranted based on the text, figures and analyses in the main WG1 Report, and also in comparison with the conclusions from the AR4. Several key elements of the report point to a weakening of the case for attributing the warming of human influences:
Lack of warming since 1998 and growing discrepancies with climate model projections
Evidence of decreased climate sensitivity to increases in CO2
Evidence that sea level rise in 1920-1950 is of the same magnitude as in 1993-2012
Increasing Antarctic sea ice extent
Low confidence in attributing extreme weather events to anthropogenic global warming
Ah, the unpublished blogging v the rest of the scientific community…
Gee, so hard to decide..
Wait, no.
Evaluating Information
How to Evaluate Resources
The CRAAP Test* is a useful guide to evaluating resources. CRAAP is an acronym for the general categories of criteria that can be used to evaluate information you find. Use the CRAAP Test to decide if information is appropriate for your research!See also Evaluating Information from a Citation
CRAAP
Questions to consider
Currency
When was the information published or last updated?
Have newer articles been published on your topic?
Are links or references to other sources up to date?
Is your topic in an area that changed rapidly, like technology or popular culture?
Examples:
Outdated Information: http://www.vegsource.com/harris/b_cancer.htm
Current Website: http://www.nytimes.com/
Relevance
Does the information answer your research question?
Does the information meet the stated requirements of the assignment?
Is the information too technical or too simplified for you to use?
Does the source add something new to your knowledge of the topic?
Examples:
Questionable Depth:
http://seawifs.gsfc.nasa.gov/OCEAN_PLANET/HTML/popsci.html
http://www.timeforkids.com/
Authority
What are the author’s credentials?
Is the author affiliated with an educational institution or prominent organization?
Can you find information about the author from reference sources or the Internet?
Do other books or authors cite the author?
Examples:
Example of why you should examine the URL and the sponsoring organization:
http://www.python.org/~guido/
Example of a more reputable website:
http://heinzhome.heinzctrinfo.net/index.html
Accuracy
Are there statements you know to be false?
Are there errors in spelling, punctuation, or grammar?
Was the information reviewed by editors or subject experts before it was published?
What citations or references support the author’s claims?
What do other people have to say about the topic?
Examples:
Example of why sources should be verified:
http://www.improbable.com/airchives/classical/cat/feline-nov2001.html
Purpose
Is the author’s purpose to sell, persuade, entertain, or inform?
Is there an obvious bias or prejudice?
Are alternative points of view presented?
Does the author omit important facts or data that might disprove the claim?
Does the author use strong or emotional language?
Examples:
Examples of websites with possible bias:
http://www.zip4tweens.com/
http://www.beefnutrition.org/
http://www.chevron.com/globalissues/climatechange/
Information used courtesy of University of Maryland University College Library and Creighton University Library; modified by Gettysburg College Musselman Library August 2012
https://www.gettysburg.edu/library/research/tips/webeval/index.dot
Judith Curry is published. Thank you very much… She is much more qualified than you.
You are clueless.
Not the blog post you cited.
Now you are doing logical fallacies.
I give you Lord Monckton a paid shill for the fossil fuel boys, the man that created the myth about the lack of warming for the ignorant denier blogs. A short video of the sociopath in action.
https://www.youtube.com/watch?list=PL82yk73N8eoX-Xobr_TfHsWPfAIyI7VAP&v=fbW-aHvjOgM
That should be reposted early and often!
I believe that the emerging story of what Exxon knew, and when they knew it, shows that the differences have never really been about the science questions – even the major oil companies knew the basic science truths 4 decades ago. They simply made a moral decision that the lives of the next ten thousand generations of human beings were not as important as their own profits, and we are now witnessing the early impacts of that decision.
At this point the deniers are just immoral creatures with no values that are willing do people harm, even let people die, as long as there is profit to be made. These people are the most vile among us, with no motivation other than greed and profit.
Nobody knows it now. That’s why the IPCC can’t nail down the number.
Even Exxon knows it and Google says you are just a bunch of liars, hurting our children and our grandchildren and making the world a much worse place.
Google’s chairman, Eric Schmidt…
“The facts of climate change are not in question anymore. Everyone understands climate change is occurring, and the people who oppose it are really hurting our children and our grandchildren and making the world a much worse place. And so we should not be aligned with such people — they’re just, they’re just literally lying.”
http://www.theguardian.com/environment/2014/sep/23/google-to-cut-ties-with-rightwing-lobby-group-over-climate-change-lies
What is the number? If everybody knows it. If we double CO2, how much warming?
Yawn… You’re killing AFrican children every day.
Seems your responses are generating a lot of replies that don’t point to any evidence of any sort.
That is a pretty good indictment of the denialist position.
There is no evidence to refute except ad hom attacks. Probably you are JMAC. You have the same low intelligence.
Well, no need to watch Comedy Channel….
“…refute except ad hom attacks. Probably you are JMAC. You have the same low intelligence.”
Thanks for yet another set of unsupported assertions.
Please continue showing us you (and so many other denialists) don’t have a working sense of what is taught in terms of intellectual rigor and honesty:
Evaluating Information
How to Evaluate Resources
The CRAAP Test* is a useful guide to evaluating resources. CRAAP is an acronym for the general categories of criteria that can be used to evaluate information you find. Use the CRAAP Test to decide if information is appropriate for your research!https://www.gettysburg.edu/lib…
Research Process Rubric – Middle School
. . . .
0 points
Presented content which was unfocused, poorly organized, showed little thought or effort and lackedsupporting evidence
https://www2.uwstout.edu/conte…
Meanwhile, all the data except the data that is manipulated every two weeks, shows AGW is full of bunk.
19 years… 19 years no warming… It’s not a short period. You are a moron of the highest degree.
Also, it isn’t a claim supported in the science. Just this blog….
It’s supported by the data from the satellites. It is supported by the science. It is the science.
It is monckton’s cherrypicked science.
Thanks for yet another set of unsupported assertions.
Please continue showing us you (and so many other denialists) don’t have a working sense of what is taught in terms of intellectual rigor and honesty:
Evaluating Information
How to Evaluate Resources
The CRAAP Test* is a useful guide to evaluating resources. CRAAP is an acronym for the general categories of criteria that can be used to evaluate information you find. Use the CRAAP est to decide if information is appropriate for your research!https://www.gettysburg.edu/lib…
Research Process Rubric – Middle School
. . . .
0 points
Presented content which was unfocused, poorly organized, showed little thought or effort and lacked supporting evidence
https://www2.uwstout.edu/conte…
If you are going to copy paste , at least fix the urls..
How to Evaluate Resources
The CRAAP Test* is a useful guide to evaluating resources. CRAAP is an acronym for the general categories of criteria that can be used to evaluate information you find. Use the CRAAP Test to decide if information is appropriate for your research! See also Evaluating Information from a Citation
CRAAP
Questions to consider
Currency
When was the information published or last updated?
Have newer articles been published on your topic?
Are links or references to other sources up to date?
Is your topic in an area that changed rapidly, like technology or popular culture?
Examples:
Outdated Information: http://www.vegsource.com/harris/b_cancer.htm
Current Website: http://www.nytimes.com/
Relevance
Does the information answer your research question?
Does the information meet the stated requirements of the assignment?
Is the information too technical or too simplified for you to use?
Does the source add something new to your knowledge of the topic?
Examples:
Questionable Depth:
http://seawifs.gsfc.nasa.gov/OCEAN_PLANET/HTML/popsci.html
http://www.timeforkids.com/
Authority
What are the author’s credentials?
Is the author affiliated with an educational institution or prominent organization?
Can you find information about the author from reference sources or the Internet?
Do other books or authors cite the author?
Examples:
Example of why you should examine the URL and the sponsoring organization:
http://www.python.org/~guido/
Example of a more reputable website:
http://heinzhome.heinzctrinfo.net/index.html
Accuracy
Are there statements you know to be false?
Are there errors in spelling, punctuation, or grammar?
Was the information reviewed by editors or subject experts before it was published?
What citations or references support the author’s claims?
What do other people have to say about the topic?
Examples:
Example of why sources should be verified:
http://www.improbable.com/airchives/classical/cat/feline-nov2001.html
Purpose
Is the author’s purpose to sell, persuade, entertain, or inform?
Is there an obvious bias or prejudice?
Are alternative points of view presented?
Does the author omit important facts or data that might disprove the claim?
Does the author use strong or emotional language?
Examples:
Examples of websites with possible bias:
http://www.zip4tweens.com/
http://www.beefnutrition.org/
http://www.chevron.com/globalissues/climatechange/
https://www.gettysburg.edu/library/research/tips/webeval/index.dot
Research Process Rubric – Middle School
https://www2.uwstout.edu/content/profdev/rubrics/middlelschresearchrubric.html
Thanks for yet another set of unsupported assertions.
Please continue showing us you (and so many other denialists) don’t have a working sense of what is taught in terms of intellectual rigor and honesty:
Evaluating Information
How to Evaluate Resources
The CRAAP Test* is a useful guide to evaluating resources. CRAAP is an acronym for the general categories of criteria that can be used to evaluate information you find. Use the CRAAP Test to decide if information is appropriate for your research!https://www.gettysburg.edu/lib…
Research Process Rubric – Middle School
. . . .
0 points
Presented contet which was unfocused, poorly organized, showed little thought or effort and lacked supporting evidence
https://www2.uwstout.edu/conte…
The irony of copy pasting continues unabated….
Just following your moronic lead.
Again, If you are going to copy paste , at least fix the urls..
How to Evaluate Resources
The CRAAP Test* is a useful guide to evaluating resources. CRAAP is an acronym for the general categories of criteria that can be used to evaluate information you find. Use the CRAAP Test to decide if information is appropriate for your research! See also Evaluating Information from a Citation
CRAAP
Questions to consider
Currency
When was the information published or last updated?
Have newer articles been published on your topic?
Are links or references to other sources up to date?
Is your topic in an area that changed rapidly, like technology or popular culture?
Relevance
Does the information answer your research question?
Does the information meet the stated requirements of the assignment?
Is the information too technical or too simplified for you to use?
Does the source add something new to your knowledge of the topic?
Authority
What are the author’s credentials?
Is the author affiliated with an educational institution or prominent organization?
Can you find information about the author from reference sources or the Internet?
Do other books or authors cite the author?
Accuracy
Are there statements you know to be false?
Are there errors in spelling, punctuation, or grammar?
Was the information reviewed by editors or subject experts before it was published?
What citations or references support the author’s claims?
What do other people have to say about the topic?
Purpose
Is the author’s purpose to sell, persuade, entertain, or inform?
Is there an obvious bias or prejudice?
Are alternative points of view presented?
Does the author omit important facts or data that might disprove the claim?
Does the author use strong or emotional language?
https://www.gettysburg.edu/library/research/tips/webeval/index.dot
Research Process Rubric – Middle School
https://www2.uwstout.edu/content/profdev/rubrics/middlelschresearchrubric.html
Thanks for yet another set of unsupported assertions.
Please continue showing us you (and so many other denialists) don’t have a working sense of what is taught in terms of intellectual rigor and honesty:
Evaluating Information
How to Evaluate Resources
The CRAAP Test* is a useful guide to evaluating resources. CRAAP is an acronym for the general categories of criteria that can be used to evaluate information you find. Use the CRAAP Test to decide if information is appropriate for your research!https://www.gettysburg.edu/lib…
Research Process Rubric – Middle Schuul
. . . .
0 points
Presented content which was unfocused, poorly organized, showed little thought or effort and lacked supporting evidence
https://www2.uwstout.edu/conte…
Seems you forgot something…..
“Climastrologists” would be those who belive in Cosmic Rays and “other forcings in the opposite direction.”, right?
https://disqus.com/home/discussion/climatedepot/no_global_warming_at_all_for_18_years_9_months_a_new_record_8211_the_pause_lengthens_again_just_in_t/#comment-2343823568
No.. Climastrologists are the ones predicting doom but only can create it in models while the rest of the world’s weather keeps improving and sea levels continue rising at the same boring rate they have for the last several thousand years.
Ah, so a strawman. Thanks!
Thanks for yet another set of unsupported assertions.
Please continue showing us you (and so many other denialists) don’t have a working sense of what is taught in terms of intellectual rigor and honesty:
Evaluating Information
How to Evaluate Resources
The CRAAP Test* is a useful guide to evaluating resources. CRAAP is an acronym for the general categories of criteria that can be used to evaluate information you find. Use the CRAAP Test to decide if information is appropriate for your research!https://www.gettysburg.edu/lib…
Research Process Rubric – Middle School
. . . .
0 point
Presented content which was unfocused, poorly organized, showed little thought or effort and lacked supporting evidence
https://www2.uwstout.edu/conte…
Thanks for yet another set of unsupported assertions.
Please continue showing us you (and so many other denialists) don’t have a working sense of what is taught in terms of intellectual rigor and honesty:
Evaluating Information
How to Evaluate Resources
The CRAAP Test* is a useful guide to evaluating resources. CRAAP is an acronym for the general categories of criteria that can be used to evaluate information you find. Use the CRAAP Test to decide if information is appropriate for your research!https://www.gettysburg.edu/lib…
Research Process Rubric – Middle School
. . . .
0 points
Presented content which was ufocused, poorly organized, showed little thought or effort and lacked supporting evidence
https://www2.uwstout.edu/conte…
Even Google says you are just a bunch of liars, hurting our children and our grandchildren and making the world a much worse place.
Google’s chairman, Eric Schmidt…
“The facts of climate change are not in question anymore. Everyone understands climate change is occurring, and the people who oppose it are really hurting our children and our grandchildren and making the world a much worse place. And so we should not be aligned with such people — they’re just, they’re just literally lying.”
http://www.theguardian.com/environment/2014/sep/23/google-to-cut-ties-with-rightwing-lobby-group-over-climate-change-lies
Eric Schmidt is the most scientific person you have quoted today… but still no science.
Oh yeah, even the scientist that worked at Exxon even call BS you you.
If you’ve got some kind of credible science that will disprove man made climate change, you have got to be some kind of stupid to not get a billion dollars from Exxon and have such study completed, published and peer reviewed in a credible scientific journal.
So, yeah, you represent a bunch of liars trying to create doubt, just like Big Tobacco had their sociopaths working for them to create doubt about the cancer causing properties of tobacco.
http://www.climatechangedispatch.com/la-times-refuses-to-show-so-called-smoking-gun-against-exxon-here-it-is.html
In its reportage on climate change research at ExxonMobil, the Los Angeles Times made a very telling editorial decision.
The paper chose not to publish the document it cites as Exhibit A in its case against us: a 1989 presentation to Exxon’s board of directors by senior company scientist Duane Levine.
I have no doubt why the newspaper doesn’t want the public to see this document.
When you read it – which you can do here – it soon becomes clear that the document undercuts the paper’s claims that ExxonMobil knew with certainty everything there is to know about global warming back in the 1980s yet failed to sound alarms.
By deliberately hiding this report from readers (while simultaneously citing it to make damaging claims about our corporation’s history of scientific research), the Los Angeles Times undermines the already low levels of trust in the media and in the media’s ability to cover issues of science and policy with accuracy and fairness.
Here’s what the L.A. Times wrote in its most recent piece:
Duane Levine, Exxon’s manager of science and strategy development, gave a primer to the company’s board of directors in 1989, noting that scientists generally agreed gases released by burning fossil fuels could raise global temperatures significantly by the middle of the 21st century — between 2.7 and 8.1 degrees Fahrenheit — causing glaciers to melt and sea levels to rise, “with generally negative consequences.”
Case closed, or so the Times would have you think.
But here’s the crucial part the L.A. Times left out from the very first page of Levine’s presentation (PEG stands for “Potential Enhanced Greenhouse,” by the way):
http://www.climatechangedispatch.com/images/pics8/PEG-climate-clip_11-2015-420×513.jpg
What else did the paper neglect to quote from Levine’s presentation? Consider this passage from page 31:
Arctic Ice Volume about the same as 2007 according to PIOMAS. http://neven1.typepad.com/
Arctic Sea Ice Area… about the same as 2005 according to DMI. (see chart below).
Satellites show temperatures stable for almost 19 years. (see this article).
https://www.nasa.gov/content/g…
Antarctic Sea ice reached a peak in 2014.
Antarctica gaining ice overall.
http://www.usatoday.com/story/…
Despite all this, Climastrologists keep continually calling it the hottest month ever….
The data tampering has been massive. Here is Hansen’s paper from 1981. http://pubs.giss.nasa.gov/abs/…
Then look at what the temperature record looked like then. Compare it to what it looks like now. If ice is stable now, 1890’s must have been an ice age.
Demonstrating a lack of knowledge between land and sea ice, but not a lack of knowledge in using cherrypicking.
Thanks!
http://www.weather.com/science/news/antarctic-ice-growing-nasa-data-finds
There are two types of Antarctic ice scientists use to gauge climatic activity: sea ice and land ice on the continent. This year, satellite data found both to be increasing in mass, rather than shrinking, a reflection of the complexity of global climate change and Antarctic weather patterns.
A recent analysis from NASA’s Goddard Space Flight Center showed a net gain of 82 billion tons of continental ice per year between 2003 and 2008, a net gain due to snowfall in the region. This runs contrary to some past data, including theIntergovernmental Panel of Climate Change’s 2013 report, sparking some controversy.
Especially if one makes the conscious choice to believe blog analysis…
“runs contrary to some past data”
You have a reading comprehension issue.
http://www.nasa.gov/feature/goddard/nasa-study-mass-gains-of-antarctic-ice-sheet-greater-than-losses
Or is NASA just another blog spot for you.
You are citing a press release.
I’d suggest reading on past the headline. Para on provides some details that don’t fit your claims.
I read the whole thing.
Para what?
A new NASA study says that an increase in Antarctic snow accumulation that began 10,000 years ago is currently adding enough ice to the continent to outweigh the increased losses from its thinning glaciers.
The research challenges the conclusions of other studies, including the Intergovernmental Panel on Climate Change’s (IPCC) 2013 report, which says that Antarctica is overall losing land ice.
According to the new analysis of satellite data, the Antarctic ice sheet showed a net gain of 112 billion tons of ice a year from 1992 to 2001. That net gain slowed to 82 billion tons of ice per year between 2003 and 2008.
Para 6
So not everyone agrees… The science isn’t settled… It should be by now… When so many models have failed.
Chapter nine IPCC
What about it moron.
“moron”
Sciency….
Thanks for yet another set of unsupported assertions.
Please continue showing us you (and so many other denialists) don’t have a working sense of what is taught in terms of intellectual rigor and honesty:
Evaluating Information
How to Evaluate Resources
The CRAAP Test* is a useful guide to evaluating resources. CRAAP is an acronym for the general categories of criteria that can be used to evaluate information you find. Use the CRAAP Test to decide if information is appropriate for your research!https://www.gettysburg.edu/lib…
Research Process Rubric – Middle School
. . . .
0 points
Pesented content which was unfocused, poorly organized, showed little thought or effort and lacked supporting evidence
https://www2.uwstout.edu/conte…
Thanks for yet another set of unsupported assertions.
Please continue showing us you (and so many other denialists) don’t have a working sense of what is taught in terms of intellectual rigor and honesty:
Evaluating Information
How to Evaluate Resources
The CRAAP Test* is a useful guide to evaluating resources. CRAAP is an acronym for the general ategories of criteria that can be used to evaluate information you find. Use the CRAAP Test to decide if information is appropriate for your research!https://www.gettysburg.edu/lib…
Research Process Rubric – Middle School
. . . .
0 points
Presented content which was unfocused, poorly organized, showed little thought or effort and lacked supporting evidence
https://www2.uwstout.edu/conte…
I didn’t make any claims… a NASA scientist did.
Again, you are citing a press release…. the paper’s author is quoted further into the pr.
And what did he say?
You said you read it..https://disqus.com/home/discussion/climatedepot/no_global_warming_at_all_for_18_years_9_months_a_new_record_8211_the_pause_lengthens_again_just_in_t/#comment-2347602078
But then you’ve also claimed to do analysis by ruler….
Thanks for yet another set of unsupported assertions.
Please continue showing us you (and so many other denialists) don’t have a working sense of what is taught in terms of intellectual rigor and honesty:
Evaluating Information
How to Evaluate Resources
The CRAAP Test* is a useful guide to evaluating resources. CRAAP is an acronym for the general categories of criteria that can be used to evaluate information you find. Use the CRAAP Test to decide if information is appropriate for your research!https://www.gettysburg.edu/lib…
Research Process Rubric – Middle School
. . . .
0 points
Presented content which was unfocused, poorly organized, showed little thought or effort and lacked upporting evidence
https://www2.uwstout.edu/conte…
Thanks for yet another set of unsupported assertions.
Please continue showing us you (and so many other denialists) don’t have a working sense of what is taught in terms of intellectual rigor and honesty:
Evaluating Information
How to Evaluate Resources
The CRAAP Test* is a useful guide to evaluating resources. CRAAP is an acronym for the general categories of criteria that can be used to evaluate information you find. Use the CRAAP Test to decide if information is appropriate for your research!https://www.gettysburg.edu/lib…
Research Pocess Rubric – Middle School
. . . .
0 points
Presented content which was unfocused, poorly organized, showed little thought or effort and lacked supporting evidence
https://www2.uwstout.edu/conte…
Thanks for yet another set of unsupported assertions.
Please continue showing us you (and so many other denialists) don’t have a working sense of what is taught in terms of intellectual rigor and honesty:
Evaluating Information
How to Evaluate Resources
The CRAAP Test* is a useful guide to evaluating resources. CRAAP is an acronym for the general categories of criteria that can be used to evaluate information you find. Use the CRAAP Test to decide if information is appropriate for your research!https://www.gettysburg.edu/lib…
Research Process Rubric – Middle School
. . . .
0 points
Presented content whih was unfocused, poorly organized, showed little thought or effort and lacked supporting evidence
https://www2.uwstout.edu/conte…
It’s okay… Climate Change is impossible to disprove… you can always fall back on the excuse that Global Warming Theory actually predicted this…
Thanks for yet another set of unsupported assertions.
Please continue showing us you (and so many other denialists) don’t have a working sense of what is taught in terms of intellectual rigor and honesty:
Evaluating Iformation
How to Evaluate Resources
The CRAAP Test* is a useful guide to evaluating resources. CRAAP is an acronym for the general categories of criteria that can be used to evaluate information you find. Use the CRAAP Test to decide if information is appropriate for your research!https://www.gettysburg.edu/lib…
Research Process Rubric – Middle School
. . . .
0 points
Presented content which was unfocused, poorly organized, showed little thought or effort and lacked supporting evidence
https://www2.uwstout.edu/conte…
http://www.nasa.gov/feature/goddard/nasa-study-mass-gains-of-antarctic-ice-sheet-greater-than-losses
A new NASA study says that an increase in Antarctic snow accumulation that began 10,000 years ago is currently adding enough ice to the continent to outweigh the increased losses from its thinning glaciers.
The research challenges the conclusions of other studies, including the Intergovernmental Panel on Climate Change’s (IPCC) 2013 report, which says that Antarctica is overall losing land ice.
According to the new analysis of satellite data, the Antarctic ice sheet showed a net gain of 112 billion tons of ice a year from 1992 to 2001. That net gain slowed to 82 billion tons of ice per year between 2003 and 2008.
“We’re essentially in agreement with other studies that show an increase in ice discharge in the Antarctic Peninsula and the Thwaites and Pine Island region of West Antarctica,” said Jay Zwally, a glaciologist with NASA Goddard Space Flight Center in Greenbelt, Maryland, and lead author of the study, which was published on Oct. 30 in the Journal of Glaciology. “Our main disagreement is for East Antarctica and the interior of West Antarctica – there, we see an ice gain that exceeds the losses in the other areas.” Zwally added that his team “measured small height changes over large areas, as well as the large changes observed over smaller areas.”
http://ocean.dmi.dk/arctic/plots/icecover/icecover_current.png
Forget El Nino… Sea ice extent at 2005 levels.
Thanks for the link.
Since the 1970 had satellites that can measure the extent of sea ice. Therefore, we know with certainty that there are considerably less sea ice in the Northern Hemisphere than 35 years ago. During the last about 10 years the melting has accelerated, and especially below the minimum spread in September can observe large changes. Overall, the ice in the Arctic Ocean has never been thinner and more vulnerable than now.
http://ocean.dmi.dk/arctic/index.php
http://ocean.dmi.dk/arctic/plots/icecover/osisaf_nh_iceextent_monthly-09_da.png
Check the trend.
http://ocean.dmi.dk/arctic/plots/icecover/icecover_current_new.png
Still well below the mean.
Antarctica set records for most sea ice in 2012, 2013 and 2014.
Now lets think globally. Shall we?
The earth is losing a trillion tons of ice
per year:
– 159 Gt Antarctic land ice, http://onlinelibrary.wiley.com…
+ 26 Gt Antarctic sea ice, http://journals.ametsoc.org/do…
– 261 Gt Arctic sea ice, http://psc.apl.uw.edu/research…
– 378 Gt Greenland, http://onlinelibrary.wiley.com…
– 259 Gt other land based glaciers, http://www.sciencemag.org/cont…
= – 1,031 Gt, total
Antarctica is gaining LAND ice.
http://www.telegraph.co.uk/news/earth/environment/climatechange/11970682/NASA-reveals-that-Antarctica-is-actually-gaining-ice.html
I’m sure all your other data is suspect as well.
Antarctica land ice alone is is 30,000,000 gigatons.
This interglacial will be long over before even 1% of it melts.
In fact, when Antarctica stops melting (it has been melting for 20,000 years) the interglacial will be over.
I’d have been happy if Antarctica just stopped contributing to sea-level rise now, but this is sooooo much better. This shows that Antarctica had stopped contributing in 1992, many years ago, and ❝…Antarctica is not currently contributing to sea level rise, but is taking 0.23 millimeters per year away,…❞
https://uploads.disquscdn.com/images/870184797947789c33424fa949ac3609325786d08b13cc8736417e9b1dfcc4b5.jpg
”According to the new analysis of [old] satellite data, the Antarctic ice sheet [actually] showed a net gain of 112 billion tons [Gt] of ice a year from 1992 to 2001. That net gain slowed to [an increase of only] 82 billion tons [Gt] of ice per year between 2003 and 2008. … ❝Our main disagreement is for East Antarctica and the interior of West Antarctica – there, we see an ice gain that exceeds the losses in the other areas.❞ Zwally added that his team ❝…measured small height changes over large areas, as well as the large changes observed over smaller areas.❞”
”❝The good news is that Antarctica is not currently contributing to sea level rise, but is taking 0.23 millimeters per year away,❞ Zwally said.”
http://www.nasa.gov/feature/goddard/nasa-study-mass-gains-of-antarctic-ice-sheet-greater-than-losses
”Mass changes of the Antarctic ice sheet … Satellite (ICESat) data (2003–08) show mass gains from snow accumulation exceeded discharge losses by 82 ± 25 Gt a–1, reducing global sea-level rise by 0.23 mm a–1. European Remote-sensing Satellite (ERS) data (1992–2001) give a similar gain of 112 ± 61 Gt a–1. …”
Zwally, H. Jay, et al. 2015 “Mass gains of the Antarctic ice sheet exceed losses.”Journal of Glaciology
http://www.ingentaconnect.com/content/igsoc/jog/pre-prints/content-ings_jog_15j071
Greenland is being a “good boy” it seems. Not wee-wee-ing into the ocean (as much as before):
https://uploads.disquscdn.com/images/a06d6daadcb3ce400fc4714f0cb3eb8996c152099c6f4af8df96358383200c36.jpg
https://uploads.disquscdn.com/images/a8c4c8729d1e3f618c6eac144efd9ded266d1698d80d581a9eaf84ce0a3149ec.jpg
Imagine that …
https://uploads.disquscdn.com/images/8309a6b2860f6c7377cbd7b0a09189560fe4ab97de86bb687aac9bd0ab35206b.jpg
SMB seems to have recovered…
https://uploads.disquscdn.com/images/952293f2b681f96ca96002022622e1cd4fb3edc998208b58969329fa5c7524a9.jpg
No wonder …
SMB by another report: https://uploads.disquscdn.com/images/19b5a3b7fc4e4c3b4d122ddc3d41019c873547633b6f1c13f533daff8df0b2a9.jpg
The turn-around happend in 2009:
https://uploads.disquscdn.com/images/cf2f89c96343ce3b8f3054ca5bfdf0aff3170a6d71aa3917f27cab64b174eea3.jpg
data: http://psc.apl.uw.edu/wordpress/wp-content/uploads/schweiger/ice_volume/PIOMAS.2sst.monthly.Current.v2.1.txt
anomaly:
http://psc.apl.uw[DOT]edu/wordpress/wp-content/uploads/schweiger/ice_volume/BPIOMASIceVolumeAnomalyCurrentV2.1.png
km^3:
http://psc.apl.uw[DOT]edu/wordpress/wp-content/uploads/schweiger/ice_volume/BPIOMASIceVolumeAnomalyCurrentV2.1_CY.png
https://uploads.disquscdn.com/images/04019480060c7a9d943945601179f5d5fec28b117fb93e7254a6a08899a414fc.jpg https://uploads.disquscdn.com/images/4d26c0605887d25e72f5017789440c941ce5a25112a2233a8acf4e3b7cb8ab9e.jpg https://uploads.disquscdn.com/images/29c0762f6535cbcc27b13f3119f4f02b520114bc9add2afcbd66205f063dedd5.jpg https://uploads.disquscdn.com/images/d2d6da5dbdc50cee704507b4523271423c6aabaaf933a90da811acb8950d2d30.jpg
No wonder that ice VOLUME has been up, lately, and that Northern Hemisphere sea ice looks better than usual…
http://neven1.typepad.com/.a/6a0133f03a1e37970b01b8d1684f49970c-800wi
http://neven1.typepad.com/.a/6a0133f03a1e37970b01b8d1684f49970c-800wi
Sea ice volume almost at 2007 levels.
How to Evaluate Resources
The CRAAP Test* is a useful guide to evaluating resources. CRAAP is an acronym for the general categories of criteria that can be used to evaluate information you find. Use the CRAAP Test to decide if information is appropriate for your research! See also Evaluating Information from a Citation
CRAAP
Questions to consider
Currency
When was the information published or last updated?
Have newer articles been published on your topic?
Are links or references to other sources up to date?
Is your topic in an area that changed rapidly, like technology or popular culture?
Relevance
Does the information answer your research question?
Does the information meet the stated requirements of the assignment?
Is the information too technical or too simplified for you to use?
Does the source add something new to your knowledge of the topic?
Authority
What are the author’s credentials?
Is the author affiliated with an educational institution or prominent organization?
Can you find information about the author from reference sources or the Internet?
Do other books or authors cite the author?
Accuracy
Are there statements you know to be false?
Are there errors in spelling, punctuation, or grammar?
Was the information reviewed by editors or subject experts before it was published?
What citations or references support the author’s claims?
What do other people have to say about the topic?
Purpose
Is the author’s purpose to sell, persuade, entertain, or inform?
Is there an obvious bias or prejudice?
Are alternative points of view presented?
Does the author omit important facts or data that might disprove the claim?
Does the author use strong or emotional language?
https://www.gettysburg.edu/library/research/tips/webeval/index.dot
Research Process Rubric – Middle School
https://www2.uwstout.edu/content/profdev/rubrics/middlelschresearchrubric.html
For example the left’s attack on Exxon which you moron’s keep referring too.
http://www.climatechangedispatch.com/la-times-refuses-to-show-so-called-smoking-gun-against-exxon-here-it-is.html
Oh, you mean this?
The Climate Deception Dossiers (2015)
Internal fossil fuel industry memos reveal decades of disinformation—a deliberate campaign to deceive the public that continues even today.
http://www.ucsusa.org/global-warming/fight-misinformation/climate-deception-dossiers-fossil-fuel-industry-memos#.Vj5KiGjTnMI
How to Evaluate Resources
The CRAAP Test* is a useful guide to evaluating resources. CRAAP is an acronym for the general categories of criteria that can be used to evaluate information you find. Use the CRAAP Test to decide if information is appropriate for your research! See also Evaluating Information from a Citation
CRAAP
Questions to consider
Currency
When was the information published or last updated?
Have newer articles been published on your topic?
Are links or references to other sources up to date?
Is your topic in an area that changed rapidly, like technology or popular culture?
Relevance
Does the information answer your research question?
Does the information meet the stated requirements of the assignment?
Is the information too technical or too simplified for you to use?
Does the source add something new to your knowledge of the topic?
Authority
What are the author’s credentials?
Is the author affiliated with an educational institution or prominent organization?
Can you find information about the author from reference sources or the Internet?
Do other books or authors cite the author?
Union of Concernced Scientists are bunch of Communist whackos… Haven’t been write on a single issue since they were formed.
I’m not sure what you are attempting,, at least get it complete… and include the url
How to Evaluate Resources
The CRAAP Test* is a useful guide to evaluating resources. CRAAP is an acronym for the general categories of criteria that can be used to evaluate information you find. Use the CRAAP Test to decide if information is appropriate for your research! See also Evaluating Information from a Citation
CRAAP
Questions to consider
Currency
When was the information published or last updated?
Have newer articles been published on your topic?
Are links or references to other sources up to date?
Is your topic in an area that changed rapidly, like technology or popular culture?
Relevance
Does the information answer your research question?
Does the information meet the stated requirements of the assignment?
Is the information too technical or too simplified for you to use?
Does the source add something new to your knowledge of the topic?
Authority
What are the author’s credentials?
Is the author affiliated with an educational institution or prominent organization?
Can you find information about the author from reference sources or the Internet?
Do other books or authors cite the author?
Accuracy
Are there statements you know to be false?
Are there errors in spelling, punctuation, or grammar?
Was the information reviewed by editors or subject experts before it was published?
What citations or references support the author’s claims?
What do other people have to say about the topic?
Purpose
Is the author’s purpose to sell, persuade, entertain, or inform?
Is there an obvious bias or prejudice?
Are alternative points of view presented?
Does the author omit important facts or data that might disprove the claim?
Does the author use strong or emotional language?
https://www.gettysburg.edu/library/research/tips/webeval/index.dot
Research Process Rubric – Middle School
https://www2.uwstout.edu/content/profdev/rubrics/middlelschresearchrubric.html
The fundamentals of global warming have been well established for generations. Fossil fuel companies have almost certainly been aware of the underlying climate science for decades.
As early as 1977, representatives from major fossil fuel companies attended dozens of congressional hearings in which the contribution of carbon emissions to the greenhouse effect was discussed. By 1981 at least one company (Exxon) was already considering the climate implications of a large fossil fuel extraction project.
—
Yet here we are, 2015 and the IPCC still doesn’t know how much the earth will warm… 1.5C 4 C? Who knows. 30 years after the science was already “Established” still nothing but guesses and wrong predictions.
PATHETIC.
http://nofrakkingconsensus.com/2012/06/08/masters-of-hypocrisy-the-union-of-concerned-scientists/
Not credible. FAIL
Thank you for providing a source invaluable for teaching rhetoric, semantics, and logical fallacies!
How to Evaluate Resources
The CRAAP Test* is a useful guide to evaluating resources. CRAAP is an acronym for the general categories of criteria that can be used to evaluate information you find. Use the CRAAP Test to decide if information is appropriate for your research! See also Evaluating Information from a Citation
CRAAP
Questions to consider
Currency
When was the information published or last updated?
Have newer articles been published on your topic?
Are links or references to other sources up to date?
Is your topic in an area that changed rapidly, like technology or popular culture?
Relevance
Does the information answer your research question?
Does the information meet the stated requirements of the assignment?
Is the information too technical or too simplified for you to use?
Does the source add something new to your knowledge of the topic?
Authority
What are the author’s credentials?
Is the author affiliated with an educational institution or prominent organization?
Can you find information about the author from reference sources or the Internet?
Do other books or authors cite the author?
Union of Concernced Scientists are bunch of Communist whackos… Haven’t been write on a single issue since they were formed.
Don’t be childish….
The only one that doesn’t site science is you.
Example?
Every one of your posts. See above.
http://neven1.typepad.com/.a/6a0133f03a1e37970b01b8d1716ea2970c-800wi
http://psc.apl.uw.edu/wordpress/wp-content/uploads/schweiger/ice_volume/BPIOMASIceVolumeAnomalyCurrentV2.1.png
Three straight years of Arctic Sea Ice Growth and Sea Ice Extent is the highest in 10 years despite El Nino.
http://ocean.dmi.dk/arctic/plots/icecover/icecover_current.png
The Daily Mail and Telegraph get it wrong on Arctic sea ice, again
Coverage of a recent paper on Arctic sea ice and climate change suggests conservative media can’t seem to grasp the concept of long-term trends
http://www.theguardian.com/environment/climate-consensus-97-per-cent/2015/jul/27/daily-mail-telegraph-wrong-arctic-sea-ice
Also see:PIOMAS Arctic Sea Ice Volume Reanalysis
http://psc.apl.uw.edu/research/projects/arctic-sea-ice-volume-anomaly/
Has Arctic sea ice returned to normal?
http://www.skepticalscience.com/Has-Arctic-sea-ice-recovered.htm
Long term trend is 60 years…. You aren’t even two thirds of the way there yet.
More unreliable sources. Your links are pathetic.
There was 30 years of NH (that’s Northern Hemisphere Cooling before 1980 when when this graph starts… 30 years into hit we hit bottom… Now we are coming up.
Hmmm, three sources. With sources.
Or your Ipse dixit proclamations…
Hard to decide who to believe….. /s
blogs… yippee.
Thanks for the use of a logical fallacy. Shows the strength of your science.
Learned all my fallacies from you. Just check your comment history. And notice the 3-4 years steady growth in the piomass data….
Now go to a Great Lakes Ice trend.
And Northern Hemisphere fall and winter snowcover trend.
Thanks for showing how critically important it is to your argument to use cherrypicking
OK 60 years
https://nsidc.org/sites/nsidc.org/files/images//mean_anomaly_1953-2012.png
Touché
Hi, jack. Nice to see the chart stops in Dec 2012. Here are two that are more current:
https://uploads.disquscdn.com/images/c3778643a0259265801bf821342debdf6998b6859a1e5952a0cd12ebaea2f0ca.jpg
https://uploads.disquscdn.com/images/7c386d9ff9dad44c38bbea7dbfda6135c681a82fe6cf72c1303a14c96409416e.jpg
PIOMASS shows three straight years of growth. after the 30 year PDO shift.
What is normal… Normal is the planet practically covered in ice.
http://nsidc.org/arcticseaicenews/files/2015/11/Figure5.png
Ozone hole comes back…. More settled science.
Some tools to use when analysing the op above
How to Evaluate Resources
The CRAAP Test* is a useful guide to evaluating resources. CRAAP is an acronym for the general categories of criteria that can be used to evaluate information you find. Use the CRAAP Test to decide if information is appropriate for your research! See also Evaluating Information from a Citation
CRAAP
Questions to consider
Currency
When was the information published or last updated?
Have newer articles been published on your topic?
Are links or references to other sources up to date?
Is your topic in an area that changed rapidly, like technology or popular culture?
Relevance
Does the information answer your research question?
Does the information meet the stated requirements of the assignment?
Is the information too technical or too simplified for you to use?
Does the source add something new to your knowledge of the topic?
Authority
What are the author’s credentials?
Is the author affiliated with an educational institution or prominent organization?
Can you find information about the author from reference sources or the Internet?
Do other books or authors cite the author?
Accuracy
Are there statements you know to be false?
Are there errors in spelling, punctuation, or grammar?
Was the information reviewed by editors or subject experts before it was published?
What citations or references support the author’s claims?
What do other people have to say about the topic?
Purpose
Is the author’s purpose to sell, persuade, entertain, or inform?
Is there an obvious bias or prejudice?
Are alternative points of view presented?
Does the author omit important facts or data that might disprove the claim?
Does the author use strong or emotional language?
https://www.gettysburg.edu/library/research/tips/webeval/index.dot
Research Process Rubric – Middle School
https://www2.uwstout.edu/content/profdev/rubrics/middlelschresearchrubric.html
Notice the word. Relevance.
And?
Here’s a simpler crap test:
Is Christopher Monckton saying it?
…then it’s probably lies.
earthobservatory.nasa.gov/blogs/earthmatters/files/2015/06/no-slow-down-in-global-warming-720×546.jpg
I’d like to see his walk through of
http://www3.epa.gov/climatechange/kids/
&
http://climatekids.nasa.gov
showing the evidence he thinks proves EPA’s and NASA ‘s evidence is wrong.
Hansen et. Al 1981
Hah, right.
That’s why you can’t walk us through how.
I’m pretty sure the law of identity is why Interplanet Janet can’t do that walk-through.
“NASA is unreliable because NASA is reliable” pretty much defeats itself logically.
I guess it could be considered performance art… if one were feeling generous about what one considers art…
climate.nasa.gov/blog/2224
Here’s how it shakes out: there is a LAW written SPECIFICALLY FOR ATMOSPHERIC THERMODYNAMICS. It FORMALLY FORBIDS your RELIGION being TRUE. Do you KNOW the NAME of the LAW written for the thermodynamics of the atmosphere?
LoL The atmosphere warms the earth, are you one of those GuBMuNT SkuLeRs who thinks that along with
‘Pot is Like Heroin’ and there’s thousands of pages of peer review to prove it? LoLoL what a buncha
Hicks.
Gubmunt Skool HicKs.
https://en.m.wikipedia.org/wiki/Poe%27s_law
No law of thermodynamics forbids anthrogenic warming. Warming from CO2 has happened throughout Earth’s history, and it’s happening again because the laws of physics require it.
You’re a hick. The calculation of temperature doesn’t INCLUDE reference to the frequency light diffracted by the gas.
Total energy is temperature.
Spectral resonance – the frequency light diffracted – is a function of BOND ANGLE.
Your crying out repeatedly, DOES TOO, DOES TOO, DOES TOO,
scientific dialog, does not make. If the frequency light diffracted by a gas determines temperature, hillbilly, then what’s the spectral resonance factor in calculation for temperature?
Be sure and include lots of peer reviewed studies on how Pot is like Heroin, too, so we can know the depths of your blind authority worship even about
FRIGID FLUID BATHS
HEATING the SENSORS they shade/scrub/phase change refrigerate.
You’re just an accountant, right?
You are really lost when it comes to science. Stick to balancing books.
My field is radiation communications and instrumentation electronic engineering.
You are a member of ”The Magic Gas Made A Frigid Gas Bath A Heater” church,
a religion that teaches the atmosphere warms the earth, not chills it.
And that the main cooling gases are the core of the ”giant heater in the sky from the magic gases.”
Whatever your field, your understanding of physics is atrocious. (And I say that having a PhD in physics.)
You need to take a few real classes in physics, and this time, pay attention.
ALL you HAVE to DO is EXPLAIN how SOMETHING IMMERSED in a FRIGID
FLUID
SELF REFRIGERATED BATH
got
WARMER than when it was WARMED with MORE LIGHT in VACUUM
and you’ll be thermodynamically competent.
Emote that sh*** like you’re on a big stage so we all FEEL you believing in it the way you SAY you believe in it being possible.
They fact you’ll even say it marks you as a f****g public school kid who simply repeats what you’re told.
MAKE US SEE A REFRIGERATED BATH
WARMING an OBJECT heated with MORE LIGHT without a
REFRIGERATED BATH.
We’ve all been waiting for W E E K S . You’re STALLING again.
Diffraction in a gas? What the hell are you talking about? You are writing gibberish, literally.
You’re a magic gas billy who thinks the atmosphere is a heater.
The atmosphere isn’t a heater. This isn’t difficult to understand.
Why are you warmer when you put on a coat? The coat clearly isn’t a heater….
Stop your pathetic attempt to make adding more of the GREEN HOUSE GASES creating 20% diffraction COOLING will MAGICALLY create magic because you wish it did, warming.
You need to be able to explain your CHURCH in means any other thermodynamicist can understand and not have us,
have the entire thread,
mocking you for your inability to predict ahead of time what happens to a thermometer output when MORE and LESS energy hit it.
There is a sphere rotated in vacuum, illuminated by a nearby glowing object. Surface embedded with sensors, energy in is maximum, energy out is minimum: modes of energy in are one; modes of energy out are one.
An insulating gas envelope is suspended around the sphere such that through diffractive or diffuse, reflective losses, 20% energy never reaches sensors which previously did.
This reduction of energy to sensors is described as:
(a) warming
(b)cooling
Energy sensors reflect this loss of energy through depicting
(a)less energy arriving than when, more energy was arriving,
(b)more energy arriving, than when more energy was arriving.
How many modes of cooling have been created by the atmosphere?
Name them.
How many modes of warming have been created by the atmosphere?
Name them.
When 20% energy in has been reduced through diffraction the temperature of the insulating envelope is still many degrees COOLER
than the temperature of the surface. Incidental turbulent contact between COLD gas molecules and WARM surface molecules
creates a SECOND MODE of COOLING called CONDUCTION.
When COLD GAS washes a WARM sensor this contact creates
(a)cooling
(b)warming
How many modes of cooling have been added by the atmosphere?
Name them.
How many modes of warming have been added by the atmosphere?
Name them.
Don’t be wrong because you’ve only got one more shot at even proving you know the difference between hot and cold gubmunt schooler.
One of the species of gas molecules lies chilled to the liquid state across 70% of the surface of the sphere.
It evaporates from the surface changing phase, taking energy with it to higher regimes. Upon loss of energy it condenses changing phase again – and returns to the surface more rapidly than if it didn’t solidify to ice.
This ACCELERATION of COOLING is called CONVECTION. It represents an ADDITIONAL MODE of COOLING created by the atmosphere.
This is the THIRD MODE of COOLING c.r.e.a.t.e.d. by the atmosphere.
Named they are Diffraction (shading) Conduction (scrubbing) and Convection (phase change refrigeration)
What is the number of modes of warming created
by the turbulent, frigid, insulating envelope? Name them.
Discuss your belief in a frigid, turbulent gas bath, warming the sensors it shades/scrubs/phase change refrigerates.
Do so in such way the entire thread doesn’t laugh at you to your face.
Name the law of thermodynamics written to describe the atmosphere.
What is the centerpiece of that law that makes it possible for it to bridge and bond, the physics and calculations of all the gas laws into one?
What is it’s name, and what does it represent?
C’mon, HiLLBiLLY
let’s HEAR it from the GuBMuNT SCHuLe HICK
who has HUNDREDS of AUTHORS
who has HUNDREDS of PEER REVIEWED ARTICLES
who has MILLIONS of PAGES of CRITICAL REVIEW
about how Pot is Like Heroin and if you don’t think so, you go to jail.
Your CHURCH has told you about a FRIGID GAS ENVELOPE
that Magically, turned into a big old giant heetur up thair! Ya’W!
That’s the problem with you low information voters, you seek a government employee to think for you because one PUT YOU through
POT
is
like
HEROIN
school.
No law of thermodynamics forbids anthrogenic warming.
The gas law of thermodynamics written FOR the atmosphere formally forbids green house gas warming or any other type warming by atmospheric gases.
The atmosphere is many degrees colder than the surface of the earth and the reason the temperature of the earth is less than at Emax conditions if there were no atmosphere
is firstly due to the presence of the green house gases blocking about half the sun’s infrared.
If there were more green house gases they would block more incoming infrared, it’s how they reduce energy to the surface of the earth 20% when they create the cooling mode known as diffraction loss or diffraction reduction of energy to the surface of the earth, a sphere rotating in vacuum, illuminated by energy from a nearby glowing light.
You have a completely wrong understanding of the second law of thermodynamics. Sad.
“diffraction loss???” This is utter gibberish.
It’s well know how the greenhouse effect works, and it has nothing to do with diffraction. For Pete’s sakes, please take a physics course.
“The atmosphere is many degrees colder than the surface of the earth and the reason the temperature of the earth is less than at Emax conditions if there were no atmosphere is firstly due to the presence of the green house gases blocking about half the sun’s infrared.”
Utter drivel.
The temperature of the surface of the Earth is GREATER (288 K) than if there were no atmosphere (255 K). This 33 K difference IS the greenhouse effect.
Seriously, have you ever studied any physics at all?
You’ve got the thermodynamic chops of a ”Magic Gas Made A Heater In The Sky” church member
in good standing.
Several hundred years men searched for a law of thermodynamics which predicted accurately the observed physics of industrial processes such as combustion.
After many hundreds of years they wrote the law that bonded ALL the OTHER gas laws.
The SOLE inclusion by mankind to make the law that bonded, bridged, and made ALL the OTHER GAS LAWS WORK
was to assign every single gas in the atmosphere
from
nitrogen
to
Carbon Dioxide
to
Oxygen
to
Methane
to
Argon
to
Radon
all the EXACT SAME ENERGY in JOULES per MOLE of GAS.
That ENERGY is REPRESENTED in the law of thermodynamics WRITTEN for the ATMOSPHERE
is the
‘ ‘ R ‘ ‘ in
PV = nRT
P is obviously Pressure
V is obviously Volume
n is simply the number of moles gas
R is the UNIVERSAL GAS CONSTANT named for Frenchman Renalt/Renault and the RATIO he used, in his work that contributed greatly to the WRITING of the LAW of THERMODYNAMICS
WRITTEN to DESCRIBE the thermodynamics of the atmosphere.
When SOLVING for TEMPERATURE
ALL the GASES get the SAME IDENTICAL GAS CONSTANT
and for those situations where a gas is pure such as in a volcanic vent or lab flask
the individual species are given INDIVIDUAL energy constants based on TOTAL ENERGY.
Not BOND angle which is the parameter determining what frequency light a gas interacts with.
You’re a member of the ”Magic Gas Made A Heater In The Sky” church.
The same one that taught the same public school graduates that pot was like heroin, and they had the critical peer review and endorsement of scientific researchers worldwide, to back it up.
Only problem is
the same class dolts defending that scientific hogwash
sound the same way the ones talking about how Magic Gas Made A Heater do.
This rant is incoherent. Literally.
Buried in there, someplace, is a partially right, partially wrong, misunderstanding of the equipartition therom.
GHGs aren’t “heaters.” They block heat from escaping out the TOA.
A lower cooling rate makes an object. That’s why you sleep under a blanket at night.
Why do you sleep under blankets at night? Blankets obviously aren’t a heater…. So how to they help you stay warm?
Absolutely. When a scientist successfully and accurately predicts a strengthened modern warming surge before it happens, it proves he’s wrong if we didn’t want to believe it in the first place. They don’t teach reason in these gub’mint schools anymore.
“To conclude, a projection from 1981 for rising temperatures in a major science journal, at a time that the temperature rise was not yet obvious in the observations, has been found to agree well with the observations since then”
http://www.realclimate.org/index.php/archives/2012/04/evaluating-a-1981-temperature-projection/
Only they didn’t, because most of that ‘surge’ was on paper only, as we’ve told you. The evidence is there. Everyone who’s bothered to look at it has seen and understood it.
I am not talking about his projections… I’m talking about his historical temp data from 1880 to 1980 that he published in 1981. NASA has more than doubled the warming during that period from all their adjustments. Doubled it… from .35C to over .7C. IF this keeps up, 1880 will have been an ice age.
https://uploads.disquscdn.com/images/5c0143ddba3f23367bfec74ffda85ad45b016bc6b73fbaa3c3f8569b8fa95981.jpg
JH: “Homogeneity adjustments are made to local time series of temperature with the aim of removing non climatic variations in the temperature record [Joneset al., 1985; Karl and Williams, 1987; Easterling et al., 1996; Peterson et al., 1998a]. The non-climatic factors include changes of the environment of the station, the instrument or its location, observing practices, and the method used to calculate the mean temperature. Quantitative knowledge of these factors is not available in most cases, so it is impossible to fully correct for them.”
Hansen, J., et al. 1999 “GISS analysis of surface temperature change.” Journal of Geophysical Research: Atmospheres (1984–2012) 104.D24 (1999): 30997-31022.
http://onlinelibrary.wiley.com/doi/10.1029/1999JD900835/pdf
So what’s your point… we’re still learning about temp stuff in 1880?
I think that is the Hansen you spoke of … though the dates disagree.
Again. you missed the point. the warming has doubled since 1981… as in… history continues to be jacked with to make the hockeystick.
I’m not sure I would… He should be home knitting by the fire with kind and competent carers by his side to make sure he doesn’t hurt himself… maybe finger painting on Saturdays if the mood strikes.
I find Mr. Christopher Monckton sad.
His dissociation from reality is a little bit more severe than one would find in most Climate Deniers.
http://www.nasa.gov/press/2015/january/nasa-determines-2014-warmest-year-in-modern-record
oh you poor sheep..will follow him to the gates of hell I guess… the evidence is CLEAR – they all agreed it had paused for almost two decades, and then, right before the summit (or a year before) – OH we have “artifacts” in the data….. but FIRST you must understand that NOAA and NASA are government entities that only publish to support the president – if you can’t and won’t believe that, then at your own peril – it’s fascism 101 – control the press, who through out all kinds of hysteria, control the government line on the science and you have the former soviet union, all pre-made for people like you that won’t look at the evidence of 2 Billion dollar satellites that were put their to measure changes in global temps – and yet they have seen no rise in almost 20 years.. now that is a science denier, and a politically blindfolded person. Meanwhile the Arctic had the shortest melt season on record, and is blasting through 15 years of ice records, Antarctica has been growing for 15 years, Greenland is putting on record ice not seen in 10 + years either and temps in the interior are MINUS 60C – do you hear that from your beloved leaders?
I do understand that!
What’s your point?
If you think NASA and NOAA are unreliable, where are you getting your information?
climate.nasa.gov/vital-signs/land-ice
Satellite images prove the Antarctic ice sheet is growing in surface area and thickness.
You poor pitiful lemmings. Off the cliff with you.
P.S. Anybody who puts their faith in government in this day and age is delusional.
FOLLOW THE MONEY!! This is about higher taxes and more government power, no more, no less.
Exactly………………….Carbon credits world
The problem with stupid people is they are too incompetent to notice how stupid they are.
They seek out information sources that agree with their preexisting conclusions instead of researching the opposing evidence. Intellectual laziness and comfort is why people come to sites like this one… a site entirely paid for by big oil that gives them an excuse to feel safe and correct.
Oil and Gas are paying for the Hoax, they’re not trying to dispel it. Perhaps you’re the one being intellectually lazy and stupid, if you don’t review data from various sources. Or perhaps you do, you go to all the places known to have funding interests linked to government and Shell etc. Do your research and you’ll find Oil and Gas spend big on making you believe that climate change is affected by us.
You sound like a hillbilly who thinks the atmosphere warms the planet, like the rest of the GuBMunT SkuLeRs.
Is that right, stupid? The atmusfear’s a BIG oL HEETuR up THAIR in thuh SKY?
Allen, what comical scientific illiteracy you offer, and with such style! 🙂 Thank you for the smile.
I was given the long version…
https://disqus.com/home/discussion/climatedepot/no_global_warming_at_all_for_18_years_9_months_a_new_record_8211_the_pause_lengthens_again_just_in_t/#comment-2388070219
Btw, thanks for time and effort in both researchin and writing so many good posts!
Yeah I saw that. Not too unique… Allen probably thinks that same law prevents blankets from keeping you warm at night 😉 Them BLANKUTS a big OL HEETur lying thar!
Funny, you’re the only one who sounds like a hillbilly, you’re the only one who said that.
FYI, a blanket is actually a physical layer that traps heat rather effectively.
By Allen’s logic, it is a violation of the 2nd law of thermodynamics for a cooler object to heat a warmer object.
Allen believes there is no greenhouse effect at all – do you agree with him?
When the earth as a sphere rotating in vacuum of space had no atmosphere sunlight conditions to the surface would be at maximum.
Modes of heating 1: radiant
Modes of cooling 1: radiant.
Immediately upon suspension of a reflective, insulating gas envelope around the sphere, energy deflected to space, never to reach a sensor on earth, comprising 20%, is lost to the surface.
This mode of cooling created by the existence of an atmosphere is called diffraction cooling.
This mode of cooling created by the existence of an atmosphere is by the green house gases.
When steady-state energy transactions resume the temperature of the reflective, insulating envelope is still many degrees COLDER than the surface. Subsequently incidental contact
between the atmosphere’s molecular regimes and surface features, creates the SECOND
mode of cooling
created by the existence of an atmosphere. The green house gases lead the pack in per-molecule removal of energy efficiency.
70% of the surface of the rotating sphere is covered in chilled, liquid or solid species of the atmospheric gas water.
Change of phase evaporation of water creates cooling of the surface.
Subsequent rise in accordance with gravity creates energy dump to lower energy regimes,
with the water changing phase AGAIN, to solid, returning to the surface faster than if it remained
in gas state.
This THIRD mode of COOLING created by existence of an atmosphere is called convection.
This THIRD mode of COOLING is the SECOND created almost solely by the green house gases.
The ones that in your religion, made the sky a heater instead of a frigid fluid bath, shading and scrubbing and phase change refrigerating, the surface of the sphere of the earth as it rotates in vacuum, illuminated by the light of the sun.
In context of global warming, “heating” or “cooling” must be relative to total earth energy budget. Changes of phase etc. within system are just sloshing heat around. Stuff like evaporative cooling does have some radiative cooling because heat is transported higher more efficiently. Anyway, atmospheric physicists account for all of this (to the degree I can translate from your somewhat muddled descriptions) and also greenhouse heat-trapping, i.e. that downwelling infrared you notably omit from your list of factors.
Same comment all internet “alternative physics” guys get – if modern physics has been taught wrong for the last century or whatever it is you believe, go publish your breakthrough proof and get famous. What are you waiting for? Until then you’re a confused guy on the internet, sorry, that’s just the cards.
Stop talking in circles this is the simplest phase f matter. If you feel qualified to discuss your church’s teachings about the Green House Gases being a magical heater then EXPLAIN YOURSELF in the SAME, SIMPLE THERMODYNAMIC
STEP by STEP processes EVERYONE ELSE WORLD WIDE discusses a COLD BATH and THERMOMETER in.
There is a spinning sphere in a vacuum without atmosphere illuminated by a light.
THIS ISN’T DIFFICULT, simple minded one.
Light to the sphere surface is 100% available at that distance.
Addition of a reflective insulating gas envelope around the sphere IMMEDIATELY STOPS 20% available light reaching the surface.
THIS ISN’T DIFFICULT, simple minded one.
Upon creation of this FIRST mode of THERMODYNAMIC E.N.E.R.G.Y. LOSS, named diffraction loss,
the atmosphere has created it’s first mode of – WHAT? Of COOLING.
THIS ISN’T DIFFICULT, simple minded one.
Upon accounting for diffraction COOLING by the GREEN HOUSE GAS COOLANTS as well as a small amount of OXYGEN based diffraction cooling with it’s associated warming of the envelope over all,
THE ATMOSPHERIC BATH is STILL MANY degrees COLDER than the SURFACE of the SPHERE.
This isn’t DIFFICULT, SIMPLE MINDED ONE.
Subsequent turbulent impingement or contact between all gas molecules and surface features, creates the SECOND MODE of – what?
C O O L I N G caused by virtue of the EXISTENCE of the ATMOSPHERIC ENVELOPE.
This second mode of COOLING created by the frigid atmosphere is named CONDUCTION.
GREEN HOUSE GAS species WATER leads the pack in COOLING per MOLECULE.
This isn’t DIFFICULT, simple minded ONE. You don’t HAVE any excuse for having believed the atmosphere is a heater. The atmosphere is a frigid fluid bath – self refrigerated, and blocking by the very existence of green house gas COOLANTS 20% total energy to the surface.
When the CONDUCTION cooling is happening there is a simultaneous mode of conduction mode cooling acceleration named
CONVECTION.
All gases participate in CONVECTION with Green House Gas species WATER leading the pack in the most energy lifted PER molecule as in discussion of mode 2 created by the existence of the atmospheric envelope.
Water functions as a single phase conduction molecule participating in simple energy transactions without phase change.
However GREEN HOUSE GAS SPECIES WATER is UNIQUELY and SOLELY ASSOCIATED with ONE mode of COOLING assocated with CONVECTION and this is the
phase change REFRIGERATION process in which water evaporates and rises according to gravity, to emit energy to lower-energy regimes, typically at higher altitudes to
CHANGE PHASE a SECOND TIME
to
RETURN to the SURFACE and RESUME COOLING FASTER
than if it remained in gas phase.
THIS IS NOT DIFFICULT simple minded one, it is the SIMPLEST PHASE of MATTER.
If you have an explanation everyone here will see is as clear in which you can STEP by THERMODYNAMIC STEP,
take us through the PROCESS your CHURCH BELIEVES makes the gases COOLING the earth, a magic heater.
”Cause down to the GuBMuNT PuBLiK sCKooL, THAY dun ToLt’ ME” is not a stepped thermodynamic progression.
They ”ToLt yew down to thuh GuBMuNT PuBLiK Sckool that ‘tair POT is like HEROIN.
Same bullsh** story about how the science is CLEAR
Same bullsh** story about how the science is SETTLED
Same bullsh** story about how they’ve got MILLIONS of CRITICAL peer review PAGES
from THOUSANDS of PAPERS
from HUNDREDS of PROFESSIONAL RESEARCHERS and ACADEMIC LEADERS in SCIENCE and MEDICINE and YADa yaDa YADa.
I’m not interested in your TESTIMONY of BELIEF.
I’m interested in watching YOU SQUIRREL around like a yard rodent partly brained by a PELLET. A pellet of truth,
that YOU can’t successfully GUESS the OUTCOME of an interaction between a thermometer and some light,
if SOMEONE TELLS YOU the ANSWERS, AHEAD of time.
THIS is NOT complicated, simple minded on, and YOU need to go back and find some more hillbillies who believe in the magical heater, and send them over here for us all to laugh and mock to shame for thinking
FRIGID
REFRIGERATED
GAS BATHS
SHADING the OBJECT immersed in them to a 20% energy reduction BEFORE the COOLING from contact ever gets started,
is a giant magical heater because you went to government school.
Where you spent 12 years and STILL quiver at the thought of STEPPING through a THERMOMETER and a LIGHT.
Because the people taking money from your parents to TEACH you
left you without CONFIDENCE to DESCRIBE COLD GAS and a THERMOMETER and WHAT HAPPENS if you SPRAY the thermometer with the cold gas.
YOUR answer is ‘uh BIG oL MaGiC HEETuR up THaiR! Ya’W!’
OUR answer is
you’re magic gas believing low information hilarity in motion. The motion of RUNING away from TESTIFYING of your CHURCH.
I know, I know. YOU crank types always WANT to have someone listen TO your WEIRDLY emphasized and barely COHERENT rants on the internet. THEY have been teaching it WRONG in classrooms for a CENTURY! And you have the perpetual MOTION machine WORKING in your basement but no one will believe you.
I don’t have the patience to TRANSLATE what you’re trying to say, and talk in circles. There are hundreds of PAGES explaining the greenhouse effect, including by anti-global warming activists. Yes, there are lots of ways the earth loses heat – thankfully, otherwise we’d have cooked long ago. Most of the convection and conduction you describe is relatively moot, from an earth energy budget point of view the question is what is absorbed from space and what is lost to space, that is the only way the energy budget changes, see the first law of thermodynamics. You ignore radiation for some crank reason or another, I’m not that interested. Thinking the greenhouse effect is a “HEATER” is not very bright; presumably you also think people who believe in blankets think that blankets are “magic HEATERS”.
Where do you think the magical downwelling infrared is coming from, my crank friend?
Do you have friends, family and/or professional support for your general feelings of paranoia and rage? (I’m not really kidding about this part.)
Zippy the Pinhead
YOU DON’T HAVE EDUCATION to PROPERLY ANALYZE the BEHAVIOR of a
FRIGID
FLUID
SELF REFRIGERATING BATH
blocking 20% of available energy to the ROCK it’s
SHADING (diffraction losses of 20% due to GHG COOLANTS)
SCRUBBING(conduction in which GHG Water leads in cooling per molecule
REFRIGERATING (with GHG species water’s UNIQUE PHASE CHANGE REFRIGERATION)
As far as your HILLBILLY CLAIM YOU’RE INTELLECTUALLY
WRECKED trying to ANALYZE a COLD BATH and HOT ROCK
that’s your problem.
SHOW US IN THIS THREAD, THERMO-BiLLY,
YOUR STEP by STEP ANALYSIS of THE EARTH as SPHERE in LIGHT from a NEARBY GLOWING SOURCE without ATMOSPHERE
and then WITH ATMOSPHERE and it had better sound CLEAR
as a BELL,
Magic Gas Billy or you’re gonna WISH it HAD sounded that way.
You NEED to SUBMIT an ATMOSPHERIC THERMODYNAMIC MODE and STEPPED PROCESS description,
you ignorant magic gas barking,
THERMOBILLY
HiCK,
and it needs to RIVET EVERYONE in the THREAD with CLARITY
as you INGENIOUSLY try to translate a
TURBULENT
FRIGID
SELF REFRIGERATED GAS BATH
INTO a ”MAGIC HEETUR that’ll GiT thuh SKY HOT ifn ya YEWS FIRE!”
You public school educated thermobilly.
START DESCRIBING the THERMODYNAMIC PROCESSES of
MAGICAL GREEN HOUSE GAS HEATER in the SKYiSMS.
and it better sound clear or like I said it’s gonna be a LONG thread for you.
Happy holidays Allen. Enjoy your family. Leave the physics to the physicists.
I am that atmospheric radiation thermodynamics physicist.
As you have to your hopeless chagrin discovered.
Now you need to explain to people watching you reeling backward like you’ve been clubbed,
in step by step discrete thermodynamic process
the MODE of ENERGY MEDIATION you BELIEVE to be ASSOCIATED with the Green House Gas coolants. The part that makes them a magical heater.
If you don’t have the courage of your convictions go find someone who can.
yes, I understand very well, as a greenhouse effect denier you’re a member of one of the more notorious and comical crank fringe groups on the internet – one even the organized anti-climate science groups try to distance themselves from – which maintain that you understand “real” physics better than all of the world’s existing textbooks and physicists, all while continually making obvious, absurd errors like describing the mechanism as a “heater” in the sky.
Sadly, you are not even notorious enough to rank on the field guide to climate clowns list, however:
https://docs.google.com/document/pub?id=1TbosA_JLgwcjj6SfOqmvQu4oEgkWNQOw7XgvxvUZoJE
You’re going to have to take it up a notch Allen. More capitalization and less medication maybe? Good luck to you. I won’t prod your cage any further.
I understand physics better than YOU though,
thermal-billy, and told YOU
that
YOU can’t SUCCESSFULLY PREDICT what direction a THERMOMETER reading is in.
That
YOU CAN’T EXPLAIN in STEP by STEP THERMODYNAMIC PROCESS
how the
SUBSTANCES CREATING DIFFRACTION mode COOLING
when enough are added to block 1% global energy
the
SUBSTANCES CREATING DIFFRACTION mode COOLING
when enough are added to block 10% global energy
how the
SUBSTANCES creating 20% DIFFRACTION mode COOLING
when enough are added to block 21% global energy
create a MAGICAL SKY HEATER because YOU WENT to
PUBLIC SCHOOL.
Why aren’t you explaining to us all how the magical heater they taught you in public school, is making the world warmer through step by step thermodynamic process?
You’ve had WEEKS.
Yet here you are with nothing but admission you’re ashamed to discuss your church.
Here’s an accessible walkthrough, Allen. Your friend “Bryan” spent many months trying to push your crank ideas about the 2nd Law in the comments on this site, and was continually corrected by a wide range of physicists but of course believes he ‘won’ the argument as you will believe no matter how many times your errors are clarified. You believe what you believe out of emotional disorders and a fierce dislike of modernity and liberalism or whatever it is that animates your hostility and general craziness. Of course I’m not going to engage much with you – “who is the fool, the fool or the fool who argues with him?” Wise words.
Why don’t you take your campaign to the comments here and see if you can do better than Bryan.
http://scienceofdoom.com/roadmap/atmospheric-radiation-and-the-greenhouse-effect/
HEY then YOU CAN GET THOSE SAME PEOPLE to GIVE YOU THE ANSWERS
to the QUESTION you’ve had PUT to YOU:
EXPLAIN in STEP by THERMODYNAMIC STEP PROCESS,
how YOU CAME to BELIEVE, a LIGHT-WARMED ROCK,
DROPPED into a
FRIGID
FLUID
REFRIGERATED BATH,
made thermal sensors ON that LIGHT WARMED ROCK
show the ROCK winding up HOTTER than BEFORE you SCRUBBED IT of ENERGY
with the
FRIGID
FLUID
SELF-REFRIGERATING
GAS BATH.
This ISN’T DIFFICULT, public schooler. YOU’RE just INCOMPETENT
or else your CHURCH has TAUGHT you WRONG, one of the two.
BUT YOU CLAIM you have an appeal to AUTHORITY which means you
can go GET
the ANSWERS from them and come back here and AMAZE us all.
You go get that anwer from them
N.O.W.
We’ve been waiting WEEKS you’re still CRYING and DUCKING and WHINING.
SHOW US
ANOTHER FRIGID REFRIGERATED BATH
that makes ENERGY SENSORS show LIGHT WARMED ROCKS
being made
HOTTER
by being IMMERSED and SCRUBBED in the FRIGID FLUID BATH.
You need to start describing the magical heating you were taught is happening in the sky so everybody here is
stunned
at the level of clarity and simply perfect thermodynamic step by step process, that is the hallmark of properly done thermodynamics.
You need to show why you think the sky is magically a heater
You need to show your personal understanding of what happens if the class of gases, creating 20% diffraction mode cooling,
becomes abundant to the point it blocks 21% energy to the surface.
You need to turn that into heating or you’re just another magic heater in the sky believing, mouth breathing low information voter class
nobody on the internet shouting that when we are using fire,
we’re making the sky hot.
I put up some replies to your senseless bumblebee flight away from pointing out your belief in how your magic sky heater religion accounts for the atmosphere chilling the earth heating it.
They didn’t come up because I was roaming on my tab . You need to say something that makes everyone feel inspired you can properly
analyze a thermometer
receiving more and less energy on it.
Pearls before swine.
cb is a paid troll.
How does one get that job?
ask cb
False statement you make. I was in the room (restaurant in Clear Lake) when Al Gore asked for Golden’s resignation for releasing the Sat data which showed no warming in 2000. You deserve a coat hanger.
❝…Antarctica is not currently contributing to sea level rise, but is taking 0.23 millimeters per year away,…❞
https://uploads.disquscdn.com/images/870184797947789c33424fa949ac3609325786d08b13cc8736417e9b1dfcc4b5.jpg
❝… the Antarctic ice sheet [actually] showed a net gain of 112 billion tons [Gt] of ice a year from 1992 to 2001. That net gain slowed to [an increase of only] 82 billion tons [Gt] of ice per year between 2003 and 2008. … ❝Our main disagreement is for East Antarctica and the interior of West Antarctica – there, we see an ice gain that exceeds the losses in the other areas.❞
http://www.nasa.gov/feature/goddard/nasa-study-mass-gains-of-antarctic-ice-sheet-greater-than-losses
”Mass changes of the Antarctic ice sheet … Satellite (ICESat) data (2003–08) show mass gains from snow accumulation exceeded discharge losses by 82 ± 25 Gt a–1, reducing global sea-level rise by 0.23 mm a–1. European Remote-sensing Satellite (ERS) data (1992–2001) give a similar gain of 112 ± 61 Gt a–1. …”
Zwally, H. Jay, et al. 2015 “Mass gains of the Antarctic ice sheet exceed losses.” Journal of Glaciology
http://www.ingentaconnect.com/content/igsoc/jog/pre-prints/content-ings_jog_15j071
E. R. Thomas, J. S. Hosking, R. R. Tuckwell, R. A. Warren, and E. C. Ludlow 2015 “Twentieth century increase in snowfall in coastal West Antarctica” Geophysical Research Letters
http://onlinelibrary.wiley.com/doi/10.1002/2015GL065750/full
Greenland has been gaining SMB lately:
https://uploads.disquscdn.com/images/8309a6b2860f6c7377cbd7b0a09189560fe4ab97de86bb687aac9bd0ab35206b.jpg
https://uploads.disquscdn.com/images/19b5a3b7fc4e4c3b4d122ddc3d41019c873547633b6f1c13f533daff8df0b2a9.jpg
Greenland is being a “good boy” it seems. Not wee-wee-ing into the ocean (as much as before):
https://uploads.disquscdn.com/images/a06d6daadcb3ce400fc4714f0cb3eb8996c152099c6f4af8df96358383200c36.jpg
report card: http://www.noaanews.noaa.gov/stories2014/20141217_arctic_report_card_2014.html
So you are suggesting(!?) that (for global-warming advocates) the slowing down in increases is seen as evidence for a warming trend.
Not an actual increase in warming, but a slowdown in the absolute and continuing increase in ice mass. So we’re still getting colder, but perhaps not quite as quickly.
It has been debatable, whether or not increases in ice mass, or, decreases in ice mass, have been observed. However, the trend seems to be towards decreasing losses in the Arctic; The RSS TLT temperature trend in the Arctic has been COOLING since 2008:
https://uploads.disquscdn.com/images/5efd223f143200b9828c18c63fbe09b2377313076b39b5f8c1ca3333f3b36c3b.jpg
The RSS TLT over the southern polar region shows a slight cooling trend over the entire satellite-based record:
https://uploads.disquscdn.com/images/af6edbb8957c499e1500c101c6880f6cc9fa77b97d0932fac3029d769aaec345.jpg
The NASA and NOAA annual temperature plots have not yet been updated for 2015, and the 2014 data is getting rather old, but, many Arctic stations show the same cooling trend as the RSS data:
https://uploads.disquscdn.com/images/c445cbfafa1cd9dc5ae740beca9871a730c41ef73cd28e2ed7b0f0d9702774a3.jpg
https://uploads.disquscdn.com/images/d7d7c1ef854bf70fd700e84e2ff92b50f2b6f67f027bc658d83b4e1c9647dfb9.jpg
https://uploads.disquscdn.com/images/952293f2b681f96ca96002022622e1cd4fb3edc998208b58969329fa5c7524a9.jpg
https://uploads.disquscdn.com/images/29c0762f6535cbcc27b13f3119f4f02b520114bc9add2afcbd66205f063dedd5.jpg
https://uploads.disquscdn.com/images/d2d6da5dbdc50cee704507b4523271423c6aabaaf933a90da811acb8950d2d30.jpg
You can’t say that sthe PC police will get you. You racist. (Tongue in cheek)
I get the ‘tongue in cheek’ but I miss the first part… Is that my comparison between N pole and S pole? https://uploads.disquscdn.com/images/4ef7994847eb236a5909fb86730197db9c85ef9e1b9f86192036594b9cd2ff79.jpg
My cooling trend got adjusted away! Last month, Reykjavic showed a cooling trend, 2002-2014, and the new data for 2015 (Meteorological year, not December-December year) is 1.5°C lower, so I expected an extended cooling trend. I didn’t check, I just grabbed the METAnn data and ran the calculation … surprise! no cooling trend any more. https://uploads.disquscdn.com/images/537fe824f3f95bb0f9006d872b44c11d3922b3a83c2ae7f72a672b5dd682f096.jpg https://uploads.disquscdn.com/images/f507543207204d43d53358ff8ee4e7287a803cce630aea9ef66ba5d1aa15b9c8.jpg https://uploads.disquscdn.com/images/7435bce6c46db4c2ee6c1b70edc3f1193a1ce4bf7ef9fdbe02eb27734206d8d0.jpg
You have to be careful WHEN you grab data from nasa and noaa. If ya happen to get data prior to adjustment, it will not show any resemblance to the data put forth for public consumption. But it will be much closer to reality.
That is their proof…………such as it is.
Justwaitaminute! If we take the “undisputed truth” of the reverend algore, we have to believe that any increase in CO2 will result in global warming, increasing the amount of water vapor in the atmosphere and thus resulting in more ice and snow at the poles. I seen it in his movie, so it must be true. ///sarc
Dear Dan: You are almost eternally correct in that we must consider the source of a statement, perhaps even moreso than considering the sense that the statement makes. Algore is a highly paid and therefore respected demi-scientist and his staements must be taken at face value. Criticizing him is like criticizing a tree. You can say what you want but it will still be a tree… until of course it goes up the chimney as smoke, thereby contributing to the parboiling of the earth. Humor in a jugular vein. Eh?
algore is as big a fraud now as when he was failing divinity school. What scientific qualification has he acquired through osmosis, since he’s obviously been too stoned to do any study?
Parboiling the Earth by burning plant matter is a net zero energy equation. The energy utilized in producing the plant matter is released in the burning of said plant.
To be effective, humor must have an element of truth, thus mother-in-law jokes and “Here’s your sign” jokes.
Here’s your sign
So who’s funding Gore?
“carbon credit” fraud, dontchaknow.
Your ignorance is pathetic, even for someone from your sorry intellectual background.
Deny and denigrate. You fools are so predictable. Offer some untainted evidence, if you can.
There are 3 sources of satellite temperature data
UAH, RSS and GISS
GISS is the heavily adjusted federal government version
UAH and RSS line up with each other and GISS does not
RSS and UAH use satellites, but a different mix of satellites; they each use their own software. The radiosondes (weather balloon) measurements confirm the satellites.
Evan Jones: ”The surface metrics all use the same GHCN statio-set, and are all converted to ERRST4, and are, therefore, not independent.”
https://disqus.com/home/discussion/theatlantic/a_scientific_look_at_bad_science/#comment-2211351301
NOAA, and their outfit, NCDC (now known as NCEI) is the SOLE SOURCE of all the data of the global surface temperature. They are the source of the GHCN surface temperature record; also for the ERSST v4 sea surface temperatures. The other so-called independent agencies’ datasets use the source GHCN and ERSST data to make their own datasets, applying their own set of adjustments.
This is why those supposedly “independent” temperatures all agree – they start with the same source data!
Right….
RSS and UAH line up and show the hiatus
And the heavily politicized federal government’s GISS does not match up with peer review and shows something very different from everyone else
https://uploads.disquscdn.com/images/43b41d5ca8754a52255206435f2eaf123366b7ba6f65c0c60fcfb5aff5c31089.jpg https://uploads.disquscdn.com/images/ff2af2595714d9ecc144ee967549aceb8dd856932a9a5610bba384fc2ec4a9c8.jpg
https://uploads.disquscdn.com/images/4ef7994847eb236a5909fb86730197db9c85ef9e1b9f86192036594b9cd2ff79.jpg … with all the ‘adjustments’ done so for to GISS, why did this one in need of adjustment escape judgement, until last month?
https://uploads.disquscdn.com/images/c5f8c17c4639c1db3ed6bd32d332f4d4bcf9ded7150535472fab8b3747920925.jpg https://uploads.disquscdn.com/images/2a0272f118aaa448137b6e28d1f9d6da243e2ef1c1dac1d8856139a3c852d36c.jpg
You cant get reliable information in todays age of PC
You very much can, my dear! In fact, it’s easier than it has ever been in the history of humankind!
…you won’t find it on a prostitute’s website, though…
http://www.desmogblog.com/marc-morano
Yes, and climate alarmists, who worry over fractions of a degree of temperature change that is entirely within established norms for climate variability, are given grants of billions of dollars to produce “studies” that “prove” humans are “significantly” altering global climate. Those grants are given by the same government that pays salaries of NOAA, NASA, EPA, etc.
So, what is your point?
Politicians seek control.
No better control than control over energy (health care is secondary).
Claim humans are bogeymen for using fossil fuels as the most efficient and available energy source.
No proof needed, just say it over and over again, shut out all dissension by name-calling (“climate deniers” “flat earthers” “in the pay of big carbon”) and stifling debate (“settled science”).
Gullible people will believe it, not being educated in sciences and having no clue about perspective.
Demand the only solution is to stop using fossil fuels, except for “developing” countries.
It’s insanity of the highest order.
Global climate models predict 100 year changes of 2-3 degrees Celsius (3.6-5.4 degrees Fahrenheit) based on deeply flawed and simplistic climate models. That is more than the climate differences between Richmond, Virginia and Columbia, South Carolina.
Furthermore, the increase in CO2, far from being a “pollutant”, is greening the planet as plant life sequesters more CO2 which increases crop yields. Plants also have a cooling influence on climate.
The warmist campaign against fossil fuels is specious and claims damages way out of proportion to any real changes human influences can create.
You really are a piece of work! Again you resort to undermining character NOT concentrating on scientific facts(ahem…. unmassaged data) which there is I agree a decided LACK of in climobabble. 150K USD a year MY GOD! And how does that compare to the daily income of the Gore Life Form?…. you know that thick necked individual flitting about in his private errrrr jet? Also who taught you how to draw trend lines through data? If you were a “student” of mine you would get a FAIL for ignoring the temperature trend from 1940 to 1980 but hey… I understand…. never let the truth get in the way of a good story…and you STILL have not separated NATURAL effects from demonstrably man made effects! Enjoy your religious experience…. I understand belief and consequent righteous indignation are par for the course of you zealots
From the same place Phil Jones was getting his when he admitted in 2005 the world stopped warming in 1998.
”The scientific community would come down on me in no uncertain terms if I said the world cooled since 1 9 9 8.
OK IT HAS but it isn’t but
seven years of data
AND IT
isn’t statistically significant.”
Look around in the world at 2005 databases that indicated NO WARMING since ’98 and slight COOING?
The RAW DATA placed online that way by LAW to stop ADJUSTMENT FRAUD.
2010:
PHIL JONES has been BUSTED in 2009 revelations He and Michael Mann and Kevin Trenberth were scamming to hide from a BBC REPORTER the WORLD STOPPED WARMING in ’98. Mann told people YOU issue a press release saying there has been steady warming.
YOU issue a press release saying the same thing.
YOU issue another press release and I’ll have my guy issue one too. DON’T MAKE THIS LOOK COORDINATED.
FEB 2010BBC INTERVIEW with PHIL JONES so HE CAN STAY OUT of JAIL:
BBC: Isn’t it true since 1 9 9 8 there has been no warming and that there has been in fact some slight cooling?”
JONES: YES but ONLY JUST. I HAVE CALCULATED and find there has been NO COOLING since 1 9 9 8 and that there has in fact been slight but not
statistically significant, COOLING.
FAST FORWARD to 2013: JONES has been FIRED the MET OFFICE has GONE OVER records.
The RELEASE a STATEMENT saying there has been NO WARMING since 1 9 9 7 and SLIGHT COOLING.
In looking around to find what database reflects that we find: the RAW DATA PUBLISHED UNADJUSTED is the
DATA BASE that SHOWS THIS to BE the TEMPERATURE in case of
ALL of JONES’ ADMISSIONS ACCIDENTAL and ON PURPOSE to AVOID JAIL
The SAME temperatures referenced in the 2013 Met Office press release.
Fox news. That’s where he get’s it. Sad.
Thank God someone is wearing protective headgear and therefore still capable of forming independent thoughts despite the broadcasts of the Government Entities.
I just want to point out that Tom’s narrative about the world turns him into a courageous lone wolf resisting shadowy forces out to destroy everything decent, and therefore to salute him for his courage and fierce dedication to freedom. Thank you Tom!
Tom from one agent of resistance to another can I ask a technical question – aluminum or tin foil? I am considering switching because some unwanted scientific thoughts are getting through when I’m up and exposed on the ground floor some days.
So you are considering switching – which is it you use now? Aluminum, or tinfoil?
True
NOAA’s brief is to gather and interpret data, not to parrot the opinion of the college dropouts in the Republican Congress. Their interpretations of their data are spot on where climate change is concerned. Maybe the doubters should look at the 19th century photos of major glaciers, and compare them to photos taken from the same spot today.
“but FIRST you must understand that NOAA and NASA are government entities that only publish to support the president”.
I know, exactly. And when President Cheney hand picked the 911 Commission, you have to know they lied and ignored the laws of physics, and said a non-symmetrical distribution of spot fires brought down building seven in perfectly symmetrical catastrophic collapse, and, at a free fall rate of speed.
Right?
Fascism is the merger of state and corporate power (according to the man who created the term “fascism”). It’s corporate governance.
It’s what we have now.
Recommend reading: “Fourteen Defining Characteristics Of Fascism”
The world has warmed 1.5 degrees C since the little ice age about 200 years ago, with most of that warming occurring without any influence from man and man made CO2.
Since the invention of thermometers, in 1880, the global temperatures have increased by 0.8 degree C with half of that increase occurring before 1950 when man made CO2 wasn’t a problem
According to satellite data, there has been no global warming for the last 18.9 years even though CO2 has increased by 10%
New land based temperature stations installed in 2004 through out the US have recorded a 1 degree temperature decrease over the last 10 years.
The latest UN IPCC climate report (AR5) indicated in Chapter 2 that there was a low confidence of any correlation between man made CO2 and extreme weather like hurricanes, tornadoes, floods, and droughts – which all are at historic lows for both frequency and intensity.
Climate related death have decreased by 98% from 3.4 million deaths in 1934 to 34,000 deaths last year; even though the world’s population has tripled during that time.
So the reality is that there isn’t a link between man made CO2 and catastrophic temperature increases or extreme weather; extreme weather is not getting worst or more frequent; and climate related deaths are a fraction of what they use to be.
The whole climate scare is, and has been, about socialism and the redistribution of wealth from the rich to poor. that is why the UN wants an annual $100 billion climate fund to be establish and paid for by the rich countries so that the UN can tell the world how to live.
That’s right!
…and burning fossil fuels is the reason.
climate.nasa.gov/scientific-consensus
Those whose “research” is paid for by government. Are you blind, stupid or part of the scam?
Lame. The government funds scientists to do science — whether climate science, medical research, research that goes into your pharmaceuticals, for defense technologies, encryption software, mathematics, materials science, and many more.
Naive. Grants go to those who those who produce the evidence the politicians, e.g. Obama and Gore, want. Are you really alleging no conflict of interest?
No politicians wants any particular result. (Except Lamar Smith and Ted Cruz.) They want good science.
Clearly you would sell your opinion for the sake of a grant. Most of us have more intergrity than you.
That had to be one of the most idiotic statements made in the history of mankind. Thanks for a great laugh. If you think Al Gore et al did not want a particular result, you either have the IQ of a geranium, or simply have drunk too much of the Jonestown Kool-Aid. Go read about the scientific fraud surrounding DDT in the 60s, which led to tens of millions of unnecessary deaths due to malaria. Go read about the scientific fraud behind silicone breast implants, which led to the bankruptcy of a major corporations. Finally, go read “A disgrace to the profession” which documents the scientific fraud that led to the original “hockey stick” graph which Al Gore used to turn himself into a billionaire. I will assume you can read. Whether you have the intellectual integrity to do so is an entirely different matter.
Al Gore wants the result given by science.
Your claims about DDT are a lie:
http://www.prospectmagazine.co.uk/magazine/rehabilitatingcarson
Mark Steyn knows nothing about science and his book is a cherry picked piece of junk, meant to sucker in gullible people like you.
algore is a failed divinity student who got into politics by means of his father’s coat tails. Once he bombed out in his attempt to get elected president, he jumped on the global warming bandwagon with all the sincerity of a political prostitute.
Al Gore is utterly irrelevant to the scientific case for global warming.
I know extreme conservatives want to hate him and they try to that by rejecting global warming, but Al Gore just communicates the science, he doesn’t determine it.
But he is pretty good at what he does. Hence his Nobel Prize.
algore is a con man using the “panic the sheep” method to push a socialist agenda that he doesn’t believe in. He was awarded the nobel prize for sophistry. There is no science that proves global warming. This is the reason that the raw data and methodology “must remain secret”. Unfortunately for those who think to avoid accountability for the fraud they’ve perpetrated, solar output has been drooping of late
http://www.skepticalscience.com/solar-activity-sunspots-global-warming.htm
but this has been apparently been compensated by other factors defined in the Milankovitch theory and volcanic activity in the Pacific that resulted in an “El Nino”.
http://www.nature.com/nature/journal/v426/n6964/full/426239a.html
Human bacteria such as yourself have kept marijuana listed as being like heroin for 75 years. If there’s a way to suck up against being wrong, you’re like a bird in a plane engine.
Marijuana??? You’re blaming me for marijuana?
You have some issues to work out. You’ll need to do that on your own.
Same church different doctrine, same low information illiterate twerkers screaming the sky is a magic heater.
It’s your church hillbilly YOU explain where it’s doctrines come from.
Marijuana issues have nothing to do with climate change.
Try to pay attention, Leroy.
Same church, same shitty pseudo science,
Do you know how to prove your claims with data and evidence?
Because you did not of that here.
Actually YOU haven’t proven anything except that you’re too stupid to be taught how a cold bath and a thermometer work together.
All you have is juvenile name calling.
No actually I HAVE CALLED YOU OUT telling YOU to your FACE you’re too STUPID to PREDICT which way a thermometer will go if it’s immersed into a
frigid
self refrigerated bath
subject to 20% cooling of the object immersed in it – the earth
due to the uniquely defined and described diffraction energy loss mode
of the Green House Gas coolants.
When you can stop your juvenile personal insults, I’ll entertain your questions.
Let me know when that happens.
YOU’VE had WEEKS, and WEEKS, and WEEKS.
You haven’t talked about ANYTHING except how STUNNED you are
the atmosphere isn’t a magical heater. Hick.
We’re all anxious to hear you discuss the signs of your church. Since you don’t have any science.
You DO however have a story about a WARM ROCK put into a FREEZING TURBULENT REFRIGERATED BATH getting HOTTER than when there IS no BATH.
I don’t belong to any churches.
And your last sentence is utter nonsense.
Of COURSE you belong to the CHURCH of MAGIC GAiS made a MIghTiE HEATUR frum a REFRIGERATED light blocking BATH.
Your churche’s words not mine.
BWAH Hah Hah hah hah hah you should have gone to school instead of going into stocking shelves.
You are still writing like a retard.
Do you honestly not know to write proper English sentences?
You have had HOW MANY DAYS NOW to PREACH about your BELIEF in the MAGIC GAS?
You’re in here WHINING. CRYING. Oh… I can’t FUNCTION in the face of all this GRAMMAR.
What has happened to YOU is YOU MET one of those THERMODYNAMICISTS your CHURCH forbids
TELLING THEM EXPLAIN your FAKE PHYSICS.
You’re a FAKE.
Your CLAIM of UNDERSTANDING WHAT you’re even TALKING about is FAKE.
Your CLAIM of having the FIRST BONA FIDE in ANALYZING THERMODYNAMICS so – EVERYONE CAN PLAINLY SEE – YOU know WTF is UP – CHUCK.
You’re a TREMBLING, FRUSTRATED THERMODYNAMICALLY INCOMPETENT FAKE until YOU EXPLAIN
HOW YOU CAME to BELIEVE a FRIGID REFRIGERATED BATH made a SUN HEATED ROCK be HOTTER
BY PUTTING IT INTO a FRIGID REFRIGERATED BATH, than it was, when it was NOT in the FRIGID, REFRIGERATED BATH.
And obviously you’re FAR short of the guts or you’d at LEAST have TRIED – you’re a FAKE.
You’re a POSER ON the INTERNET unable to P.R.O.P.E.R.L.Y. ANALYZE a T.H.E.R.M.O.M.E.T.E.R.
And you’re free to move on and try to hustle up somebody else, any time you see fit to do it.
But if I see you I’m gonna ask you about your teachings again because I say you’re a FAKE,
and that – YOU DON’T KNOW HOW to ANALYZE an ATMOSPHERE around a PLANET.
And that NOT ONLY DON’T YOU KNOW, YOU DON’T HAVE THE – what EVER – to just LIMP ALONG and try to FAKE it from ONE of your ELITE WEBSITES about HOW the SUN heats the earth.
And how the atmosphere HEATS it even more than when it was
WARMED with MORE SUNLIGHT
NOT IIN the FRIGID REFRIGERATED atmosphere.
Prove Al Gore wanted a particular result.
PS: DDT has absolutely nothing to do with climate change, nor has DDT been banned. You swallowed conservative propaganda.
You’re so f****g stupid you thought a cold bath was a heater. That’s your integrity level. Too stupid to analyze a thermometer in a freezing cold refrigerated bath right.
Rant much? Try making sense….
That’s ALL you HAVE to DO: MAKE SENSE.
PROPERLY ANALYZE a THERMOMETER immersed in a FREEZING COLD REFRIGERATED BATH so you’re not BARKING
the frigid, self refrigerating atmosphere blocking 20% energy to earth is a heater.
If you’re so incompetent you can’t properly analyze what happens when a thermometer is immersed into a frigid fluid
then what’s your word worth as a member bearing testimony of your church?
A thermometer in a freezing bath?????
What does that have to do with manmade climate change?
Try to stop your ranting and hyperventilating enough to explain yourself…….
The FREEZING FLUID SELF REFRIGERATED BATH KNOWN as the PLANETARY ATMOSPHERE isn’t a magic heater like they told you at church dipshit.
You’ve been in here for WEEKS. You won’t take up for your CHURCH.
You INSIST the atmosphere is a ”big giant magic heater” but you can’t detail how you think so.
That’s why they pick people like you – ”graduates’ from public schools
to defend it.
LoLoLoL
The atmosphere is a COLD SELF REFRIGERATED BATH. I know AT PUBLIC SCHOOL THEY told YOU
it’s a magic HEATER. BWAH hah hah you don’t even know the atmosphere is colder than the planet.
You are terribly, terribly confused. You should go back and study physics from the very beginning. I mean like the F=ma beginning.
Actually YOU are the one here BARKING about a FRIGID, REFRIGERATED BATH
heating up a ROCK dropped in it. And that of course is PROOF how thermodynamically CONFUSED
you really WERE. Till you got here. NOW you’re not confused.
LoLoLoLoL !
You don’t understand anything about the science of the greenhouse effect. Sad.
Sure I do. I know you’re too AFRAID to DESCRIBE YOUR BELIEF HOW it WORKS, because YOU DON’T HAVE the THERMODYNAMIC CHOPS to PROPERLY ANALYZE a THERMOMETER.
With the ANSWERS GIVEN to you IN ADVANCE.
In actual fact, I’M the ATMOSPHERIC CHEMIST and ATMOSPHERIC RADIATION specialist, and ATMOSPHERIC specialist,
and
YOU’RE the one who got a DARE sticker for YOUR degree. THAT’S what happened to you in THIS train wreck, YOU met a REAL ATMOSPHERIC THERMODYNAMICIST who doesn’t need to CRACK
a
BOOK
to bring you to the point where YOU are AFRAID to PREDICT WHAT DIRECTION a THERMOMETER
is gonna go GIVEN the ANSWER AHEAD of TIME.
So I know it draws low information voter types such as yourself. People needing a church without the discipline of a real religion but with all the feeling good about hating people because you thought you were smarter.
All we have to do is MENTION thermometer and you start CRAWFISHING. FLEEING. LOOKING for a ROCK to HIDE behind. Or under.
Ok well – next time I see you around I’m going to be asking about your religion and you better be marching out the thermodynamic pins at 10, 20, 30, 40 yards, LIKE a CLOCK.
Or YOU’RE gonna WISH you DID. LoL. You can’t BE the SMARTEST THERMODYNAMICIST in the ROOM, and BE TOO AFRAID to TALK OVER the PROGRESSIVE MOVEMENT of a THERMOMETER
in the FACE of a SUN WARMED ROCK, and FRIGID REFRIGERATED sun-BLOCKING BATH.
Really you’re as incompetent as any other magic gasser I ever met, and just as quick to CRAWFISH. Not a WORD about your church’s SAVING the WORLD. NOT a WORD about ”Oh what about all the PEOPLE seeing me WORK this NON BELIEVER ?
Pfft you turned and DROPPED your MAGIC GAS CLIMATOLOGY Jr ring and FLED the FIELD being told ”YOU ANALYZE the PROGRESS of THIS THERMOMETER or YOU’RE a FAKE.”
When you SHOWED UP claiming – YOU’RE READY to RUMBLE for your church.
You heard the WORD thermometer and FOLDED like ALL thermodynamic FAKES.
I understand the greenhouse effect just fine. But I’ve learned not to carry on conversations with rude people who can’t write decent English sentences.
You learned what happens when someone calls your FAKE science to your face and says ”EXPLAIN to us all how a SUN WARMED ROCK
getting LESS ENERGY to then DISTRIBUTE and EMIT what’s LEFT through a LARGER COLDER MASS is the DEFINITION of COOLING
but in your CHURCH it’s a MAGICAL HEATER in the sky.
As usual, I find your sentences utterly incomprehensible.
As usual, you don’t have the manhood and intellectual integrity to talk about your magic heater in the sky.
The frigid refrigerated gas bath that blocked light to a sun warm rock and distributed the remaining energy through a larger colder mass, and that the people down at Pot is Like Heroin told you,
is a magic heater.
“refrigerated gas?” What instrument is refrigerating this gas, and where is it plugged it?
Another Wrong answer, from the terminally stupid.
Until you stop with the all caps shit, your comments will be ignored simply because they appear juvenile.
Whine and squirm and cry like a raped nun until they shut your internet off. Let us all know if that changes the laws of thermodynamics so
LESS LIGHT
spread through and emitted from a GREATER, COLDER MASS,
becomes magically a HEATER instead of a FRIGID LIGHT BLOCKING BATH.
LoL.
We’ll all wait.
Same response, Allen — learn how to write in English, and I will entertain your questions. Until then…..
Nobody has any respect for a magic gasser without the spine to speak up for his church.
Actually, writing odious terms like “raped nun” means you will never get another response from me. Yours’ is a disgusting choice of language.
Blocked. Good bye.
LoL what a loser.
You’ve got the intellectual displacement of a children’s teacup. You need to show that your church’s doctrines are even reality based. Until you do, you’re just another magic gas scammer scurrying from post to post, running from the reality that never stops catching up to you.
You learned to hide, when somebody tells you, to analyze a thermometer, magic gas quack. Nobody suspends an insulating reflector between an object and it’s heat source, then distributes and emits the reduced energy through a larger, colder mass, and makes heating.
The definition of that is COOLING. LoL
how long have you been scurrying around the internet announcing a REFRIGERATED BATH is a magic heater in the sky. LoL. !
Your understanding of the Second Law of Thermodynamics is deficient.
Obviously if you had anything to contribute besides ”A FREEZING REFRIGERATED BATH blocking LIGHT to a ROCK is a MAGIC HEATER! you’d have put it up long ago.
There are no magic heaters. There is a reduction in the rate of cooling, which is the same as warming.
Wrong answer, stupid.
Do you think a body at any temperature does not radiate energy?
”LooK a Magic Gasser Deflecting yet again !”
We’ve all waited here for WEEKS as you barked you understand about the ”giant magic heater in the sky.”
Yet you’re running around squeaking like a mouse running from a broom.
Typical public school zombies sent out from the church of Pot is Heroin to discuss the
Magic Heater in The Sky.
Whenever I see claims like this, I immediately think the WRITER would alter his finding so satisfy what he thinks politicians want, so he assumes everyone is just as dishonest.
That’s not my experience. Scientists are the most scrupilious people I have ever encountered.
Scientists are the most scrupilious people I have ever encountered.
Then you need to check out retractionwatch.org. Scrupulousness takes a back seat to anyone’s paycheck, including that of scientists.
—————
Every hear of Climategate?
“The data doesn’t matter. We’re not basing our recommendations on the data. We’re basing them on the climate models.” – Prof. Chris Folland, Hadley Centre for Climate Prediction and Research
“The models are convenient fictions that provide something very useful.” -Dr David Frame, Climate modeler, Oxford University
UN IPCC chair Pachauri, 2013: “If the governments decide we should do things differently and come up with a vastly different set of products we would be at their beck and call.”
“It doesn’t matter what is true, it only matters what people believe is true.” -Paul Watson, Co-founder of Greenpeace
“Unless we announce disasters no one will listen.” – Sir John Houghton, First chairman of the IPCC
“No matter if the science of global warming is all phony … climate change provides the greatest opportunity to bring about justice and equality in the world.” – Christine Stewart, former Canadian Minister of the Environment
“We have got to ride the global warming issue. Even if the theory of global warming and CO2 is wrong, we will be doing the right thing in terms of economic and environmental policy.” – Timothy Wirth, U.S Undersecretary of State for global issues, Clinton-Gore administration
In 1989, climate scientist Stephen Schneider told Discover magazine: “To capture the public imagination, we have to offer up some scary scenarios, make simplified dramatic statements and little mention of any doubts one might have. Each of us has to decide the right balance between being effective, and being honest.” Twelve years later, Schneider was a lead author of the IPCC’s TAR, the same UN report that formally introduced the delusory Hockey Stick Graph.
John Christy, Professor of Atmospheric Science, University of Alabama, a contributor to the first four IPCC assessments, including acting as a Lead Author in 2001 and a Contributing Author in 2007:
An email between two climate “scientists,” on why it is “good to remove” inconvenient facts:
di2.nu/foia/1254108338.txt
In 2006, University of Oklahoma geophysicist Dr. David Deming recalled “an astonishing email from a major researcher in the area of climate change” who told him that “we have to get rid of the Medieval Warm Period.” In June of this year, Deming identified the year of that email as 1995 and the source only as a lead author of that month’s Global Climate Change Impacts in the United States report.
Many believe that man to be Jonathan Overpeck – which Prof. Deming didn’t deny in an email response — who would later also serve as an IPCC lead author. So it comes as no surprise that this reconstruction, which did indeed “get rid of the Medieval Warm Period,” was featured prominently in the subsequent 2001 TAR, particularly in the Summary for Policymakers (SPM), the highly-politicized synopsis which commands the bulk of media and political attention.
This email from Mr. Kenneth Trenberth, the head of the Climate Analysis Section at the National Center for Atmospheric Research:
“The fact is that we can’t account for the lack of warming at the moment and it is a travesty that we can’t. The CERES data published in the August BAMS 09 supplement on 2008 shows there should be even more warming.”
On the Importance of the Free-flow of Information to Science
Email from Phil Jones, director of the Climatic Research Unit (CRU) at the University of East Anglia, to Michael Mann:
“Mike,
Can you delete any emails you may have had with Keith re AR4?
Keith will do likewise. He’s not in at the moment – minor family crisis.
Can you also email Gene and get him to do the same? I don’t
have his new email address.
We will be getting Caspar to do likewise.”
Email from Phil Jones:
“Just sent loads of station data to Scott. Make sure he documents everything better this time ! And don’t leave stuff lying around on ftp sites – you never know who is trawling them. The two MMs [McIntyre and McKitrick, who have requested data through FOIA] have been after the CRU station data for years. If they ever hear there is a Freedom of Information Act now in the UK, I think I’ll delete the file rather than send to anyone. Does your similar act in the US force you to respond to enquiries within 20 days? – our does ! The UK works on precedents, so the first request will test it. We also have a data protection act, which I will hide behind. Tom Wigley has sent me a worried email when he heard about it – thought people could ask him for his model code. He has retired officially from UEA so he can hide behind that.”
Professor Jones, to Professor Mann and Professor Malcolm Hughes at the University of Arizona and Raymond S. “Ray” Bradley at the University of Massachusetts at Amherst:
“I’m getting hassled by a couple of people to release the CRU station temperature data. Don’t any of you three tell anybody that the UK has a Freedom of Information Act!”
Professor Jones tells Professor Mann: “If they ever hear there is a Freedom of Information Act now in the UK, I think I’ll delete the file rather than send to anyone” and “We also have a data protection act, which I will hide behind.”
Professor Jones to another academic: “I did get an e-mail from the FOI person here early yesterday to tell me I shouldn’t be deleting e-mails” and “IPCC is an international organization, so is above any national FOI. Even if UEA holds anything about IPCC, we are not obliged to pass it on.”
On How Important Non-emotional Objectivity is to the Scientific Process
Phil Jones: “…If anything, I would like to see the climate change happen, so the science could be proved right, regardless of the consequences. This isn’t being political, it is being selfish.”
Or this email from Dr. Andrew Manning to Dr. Phil Jones that highlights the climate research industry that has grown up around cap and trade:
“Hi Phil, is this another witch hunt (like Mann et al.)? How should I respond to the below? (I’m in the process of trying to persuade Siemens Corp. (a company with half a million employees in 190 countries!) to donate me a little cash to do some CO2 measurments here in the UK – looking promising, so the last thing I need is news articles calling into question (again) observed temperature increases”
Tim Osborn, professor at the Climate Research Unit, discusses in e-mails how truncating a data series can hide a cooling trend that would otherwise be seen in the results.
Professor Mann sent Professor Osborn an e-mail saying that the results he is sending shouldn’t be shown to others because the results support critics of global warming.
On How Important the Integrity of the Peer Review Process Is To Scientific Research
Professor Mann wrote: “I think we have to stop considering ‘Climate Research’ as a legitimate peer-reviewed journal. Perhaps we should encourage our colleagues in the climate research community to no longer submit to, or cite papers in, this journal.”
Email from Phil Jones to Michael Mann:
“I can’t see either of these papers being in the next IPCC report, Kevin and I will keep them out somehow — even if we have to redefine what the peer-review literature is!”
I know all about Climategate. It proved nothing. Science is about evidence, and the evidence for AGW is overwhelming, whether you can understand it or not.
I know all about Climategate. It proved nothing. Science is about evidence, and the evidence for AGW is overwhelming
No, science is about evidence, and the real, live, infallible humans that are supposed to practice the scientific method.
“No, science is about evidence”
That’s exactly what I wrote, Einstein.
Here, let’s make what I wrote bigger, since this is now the 3rd time in one day that you don’t seem to understand how to read:
No, science is about evidence, and the real, live, fallible humans that are supposed to practice the scientific method.
Yes, science is about evidence. How many more times do you want me to type it?
He (davidappell) suffers from a perceptual dissonance that renders him incapable of realizing he’s been duped into believing in global warming.
Or he’s being paid to disrupt legitimate conversations on the internet forums.
The EVIDENCE IS that PHIL JONES ADMITTED IT HASN’T WARMED since 1 9 9 8 and THE RAW DATA POSTED ONLINE REFLECTS THAT AS WELL.
The EVIDENCE is that PHIL JONES was FIRED by the MET OFFICE for NOT ADMITTING it stopped WARMING in ’98.
The EVIDENCE IS that TWO YEARS AFTER they FIRED him – after he ADMITTED it stopped warming in 1 9 9 8 so he didn’t go to JAIL
The Met Office, LARGEST meteorological group on earth, ANNOUNCED IT STOPPED WARMING in 1 9 9 8 AND THAT in FACT there’s BEEN some COOLING.
And the PROOF of this is that it’s HISTORICALLY RECORDED as HOW it all happened.
You’re a hick who joined a church where quack tard fake science is THE MAIN DRAW.
Evidence is evidence and the RAW DATA they ALL REFER to is REGARDED as the GOLD STANDARD for global temp.
Evidence is that you’re too stupid to talk about your church except in the sense of describing how much you love it and doing your best to conceal your church leaders got busted perpetrating fraud for 18 years.
It’s your church hick, it’s your problem. YOU explain it.
LoL. Magic Gas believing hicks where do you go to school the public education system?
O h – yeah the same place they started telling you the sky’s a magic heater when you’re in kindergarten.
BWAH HaH hah hah hah
THAT’S why you BELIEVE in it, you were EDUCATED in it !!! LoLoLoLoL ! Sucks to be you but somebody’s gotta be the low information quack tard everybody point at and laughs at.
Save your ammo for the enemies, not your allies.
Didn’t you read my other comments on this article? See this one: http://testclimate.wpengine.com/2015/11/04/no-global-warming-at-all-for-18-years-9-months-a-new-record-the-pause-lengthens-again-just-in-time-for-un-summit-in-paris/#comment-2395836358
yeah MY BAD on that one Ali sorry. I was actually speaking to the WACKO who THINKS the SKY HAS a HEATER in it.
He has staggered around this thread for WEEKS unable to discuss the thermodynamics of his hillbilly religion, trying to gather some arch sense of authority for confessing government employees convinced him a
FRIGID
TURBULENT
SELF REFRIGERATING BATH
BLOCKIN 20% INCOMING ENERGY to a SPHERE
is
MAGICALLY a HEATER
because he went to public school.
All you have to do is tell the hick to analyze more and less light falling on a thermometer and suddenly a
FRIGID
TURBULENT
SELF REFRIGERATING BATH
has him pointing ”LOOK! a BUTTERF- and he’s gone to try to figure out what kind of insult he can come up with
TO COVER BEING CAUGHT UNABLE to ANALYZE how MORE or LESS LIGHT hits a THERMOMETER.
I replied but it doesn’t seem to be up sorry about that Ali I meant to speak to what’s his name, the magic gasser there.. my bad man.
Deny, deny, deny, deny, deny.
Now stick your fingers in your ears and start chanting “I won’t hear you!”
You’re a hermit, aintcha?
Like when that hick MIchael Mann created that pathetic hockey stick generator?
When the idiots who invented your church said the core of the magic heater is the green house gas COOLANTS?
When the people who claim to believe your church’s story have been modeling and modeling 35 years and still can’t predict which way a thermometer goes even if we give them/you the answers ahead of time?
You’re an incompetent quack who is simply drawn to falsehood and it doesn’t matter where you find it.
Pot is like Heroin, atmospheric coolants are a magical heater – you’ve got the intellectual credibility to show up waving those around – barking fake science from the ORIGINAL fake science people, the Federal Government.
Matter of fact it was a Democrat Oil man who decided he was going to spread fake science and destroy a national commodity in energy,
and it was a Democrat Oil man who told FDR he wanted cannabis illegal so he could sell his OIL RELATED products, NYLON and POLYPROPYLENE. Cannabis was one of the nations LARGEST commodity industries.
Democrat oil men wiped that shit out like they were criminals. The MADE the hemp farmers, CRIMINALS.
75 years of FAKE science,
75 years of FAKE evidence,
75 years of THE SCIENCE is settled,
and now you’re in here running around like you think the sky is a magical heater, is – a real thing.
Here’s the scoop, quack tard: the green house gases kick 20% available energy to space.
If diffraction cooling is AMPLIFIED that means putting more green house gas COOLANTS into the atmosphere
until 21% energy is kicked out to space. THE FACT YOUR CHURCH CAN’T DISCUSS that IS YOUR PROBLEM.
That’s how it is and it has wound up with you here barking about a magical heater made from COOLANT.
The hockey stick has been replicated and reproduced many times now. It is accepted science.
Even Mann’s closest associates reported it gives off Hockey Sticks.
https://noconsensus.wordpress.com/2008/09/23/the-flaw-in-the-math-behind-every-hockey-stick/
Baloney. There have been about 40 hockey sticks published in the scientific literature:
http://www.davidappell.com/hockeysticks.html
And in fact NONE of them produce anything but HOCKEY STICKS.
Re: models
https://uploads.disquscdn.com/images/625d5a6271f649628edaab1c49a61ab2485d6ca5c0ca5d39725ac54eaffd21fb.jpg
Phil Jones, data scammer in chief later busted, thrown out of his job and nearly jailed for what he refused to tell the scientific community:
”The scientific community would come down on me in no uncertain terms if I daid the world cooled since 1998.
OK IT HAS but it ISN’T but SEVEN YEARS of DATA (EVERY year between ’98 and 05 when he said it)
AND IT ISN’T STATISTICALLY SIGNIFICANT.”
Three months after JONES trying to ESCAPE JAIL CONFESSED to the BBC whose REPORTER he tried to RUIN for REPORTING he KNEW
WARMING STOPPED in ;98
FEB 2010 BBC interview: Phil Jones:
BBC: isn’t it TRUE there has been NO WARMING SINCE 1998 and that there has in fact been some slight cooling?
JONES: ***YES. I have DONE the CALCULATIONS and FIND THERE HAS BEEN NO COOLING SINCE 1 9 9 8 and that there has been a small amount of statistically insignificant cooling.”
END of YOU lying BULLSHOOT.
You can’t remain civil here. So you don’t deserve a response.
This is mainly about letting people watch you be slapped all over the thread. We all knew you don’t have anything to defend yourself.
DA, did you draw that? No citation, no URL, nothing to indicate a source.
“F”
Source: Gavin Schmidt, Director of NASA GISS.
https://twitter.com/ClimateOfGavin/status/642024749569298432/photo/1
Late. Upgrade to a “D”. Next time. include your references, for a better grade.
You’re reaching. The source is just as good now as it was then.
You’re supposedly a writer. To use other people’s stuff without attribution is plagiarism.
My source was fully cited, of course.
You’ve lost here.
The people who convinced the world, Pot’s Like Heroin – people from your CHURCH – fully cited all the ignorant bullshoot they spammed the world with, too.
You still need to explain the doctrines of your church so everyone doesn’t laugh in your face on sight and you’ve fallen far, FAR short of that.
Where?
https://uploads.disquscdn.com/images/9957294464e939591e873eb339b5f53e7523536be7ecb53034cbfd4aa70c5530.jpg
https://uploads.disquscdn.com/images/c481db3cbed408d5d701b1dd888583e116db02930f5bba741d262834a7504152.jpg
https://uploads.disquscdn.com/images/5e6bb1c0e1ff2f38c566993ceb52ebee636e6d23846db2aa280686446645967d.jpg
Plagiarist.
Gavin ”It’s almost like it’s there if you look long enough” regarding the troposphere never heating up.
”The scientific community would come down on me in no uncertain terms if I said the world cooled since 1 9 9 8. OK IT HAS.”
”BBC: ISN’T it TRUE there’s been no warming since 1 9 9 5 and that in fact since 2 0 0 2 there’s been some slight cooling? ”
Busted world’s #1 climatologist Phil Jones: YES. I did the math and there has been no warming since 1995. I also calculated the trend since 2002 and although not statistically robust, there is slight COOLING. ” (Jones was on tranquilizers and mis-spoke saying 1995. His shoddy work was so bad it had to be re-done and corrected to 1 9 9 8)
Met Office after demoting Jones for NOT REVEALING it STOPPED WARMING in 1 9 9 8, in 2013 issued the press release: The Recent Pause In Warming where they WROTE THREE PAPERS ADDRESSING ”THE PAUSE IN WARMING THE PAST FIFTEEN YEARS” (2013 to 1998)
Schmidt’s drawing simply means the temperature hasn’t changed. End of story. All the faked warming is still – FAKED WARMING. *GAVIN SCHMIDT LIES to YOU DAILY*
Allen, you still do not seem to understand. Your comment about “raping nuns” was so extremely odious that nothing else you can say will overcome it, until you apologize and mean it.
Stop trying to act like some school teaching Nun. Imperious when you think you’ve got kids scared, pouting like you’re afraid you’ll be made to kneel and say ablutions whenever you’re corrected.
That chart’s not right. The people who publish the adjusted data for those numbers got caught perpetrating fraud wherein the world’s #1 climatologist had to admit
to the BBC in their 2010 interview of Phil Jones,
that in fact it stopped warming in 1 9 9 5. (later adjusted to ’98, he was on sedatives thinking he could be fired, even jailed over his fraud) and that there was in fact some slight COOLING since 2002.
I see those records have not been gone back over and corrected so that means that James Hansen’s hand picked successor in the Climate Gate scam is still using the fake data.
If it hasn’t been gone back and adjusted since he confessed then it’s fake data. End of story.
Source: Twitter link
From Gavin Schmidt, https://twitter[DOT]com/ClimateOfGavin/status/642024749569298432/photo/1
Due in part. A noise level part, and the warming we have experienced has been quite good. Lowest severe weather in a half century. Lowest deaths due to said weather in centuries. You just need a good banging to get you out of our self hating obsession.
You’re a hick who can’t step through what happens when more and less light falls on a thermometer.
“Since the invention of thermometers, in 1880, the global temperatures have increased by 0.8 degree C with half of that increase occurring before 1950 when man made CO2 wasn’t a problem.”
Wrong. Over 90% of the warming has come since 1960. 75% has come since 1975.
data:
http://data.giss.nasa.gov/gistemp/tabledata_v3/GLB.Ts+dSST.txt
0.4 degree C warming since 1950 which is pretty equal to the 0.4 degree C warming from 1910 – 1940
Warming since 1950 = 0.8 C
Nope. GISS’s records show 0.9 C warming since 1950.
Your data confirms that there has been a 0.4 degree C warming since 1951 thank you for the information. I rest my case.
Wrong. Very wrong. Warming since 1950 = 0.8 C
You’re completely wrong. And you know it.
The use of nasa as a source discredits your argument. They’ve already been caught fudging the numbers.
http://www.telegraph.co.uk/comment/11561629/Top-scientists-start-to-examine-fiddled-global-warming-figures.html
“The first rule of propaganda is: Never tell a lie.” Being found demonstrably false in anything you say negates everything you say.”
~William Donovan (head of the OSS during WWII)
You’re a hick. DATA SCAMMER in CHARGE Phil Jones in 2005 said ”The scientific community would come down on me in no uncertain terms if I said the world cooled since 1 9 9 8. OK IT HAS but it’s only seven years of data and it isn’t statistically signficant.”
WHAT DATA SET REFLECTED THAT TEMPERATURE in 2005?
THIS ISN’T COMPLICATED.
The RAW DATA placed unadjusted online by LAW to stop: ADJUSTMENT FRAUDS like your church leaders.
Then in 2009 : JONES and TRENBERTH and M A N N and SCHMIDT and HANSEN’s NAMES all on an EMAIL from JONES: A BBC reporter said it stopped warming in 1 9 9 8. Maybe we should do to him what we did to the other one.”
MANN: YOU issue a press release from YOUR meterorlogical organization
MANN: and then YOU issue a press release but DON’T make it look like it’s COORDINATED.
MANN: and then YOU issue a press release from YOUR organization making sure it DOESN’T look like we’re doing this together.
TRENBERTH MELTING down, crying about how it hasn’t warmed, and he is completely HUMILIATED as a professional.
In that conversation not ONE word – from ANYBODY – about – ”say WHAT about ’98? Why ’98?”
BECAUSE
THEY ALL KNOW the TEMPERATURE of the WORLD is that DEPICTED by the RAW DATA POSTED ONLINE.
Then 2010: in order to not go to jail JONES HAS AGREED to FESS UP: FEB 2010 BBC interview: phil jones –
BBC: Isn’t it TRUE there has BEEN NO WARMING since 1998 and that there in FACT has been SLIGHT COOLING?
JONES: YES. I calculated the temperature and there has been NO WARMING since 1 9 9 8 and there has been in fact SLIGHT cooling.
THIS IS NOT COMPLICATED
it’s the SIMPLEST PHASE of MATTER.
FAST FORWARD: Met Office FIRED JONES over HIDING there had been no WARMING since 98.
2013 The WORLD data COLLECTION office the Met Office which FIRED Jones for NOT TELLING:
”There has been NO WARMING since 1998 AND THERE HAS IN FACT been a SLIGHT but not statistically significant COOLING.”
TWO YEARS after they FIRED JONES for NOT CONFESSING there’s BEEN NO WARMING since ’98
The WORLD DATA COLLECTION OFFICE ADMITTED: THERE’S been no WARMING since 1 9 9 8.
Jones in 2005.
Jones/Mann/Trenberth/Schmidt/Hansen in 2009
ALL getting the same EMAIL
CRYING about someone finding out: there’s been no warming since ’98.
NOT A SOUL says a SINGLE WORD about ”why ’98”
Jones in 2010: I HAVE BEEN FAKING ALL THIS DATA for TWELVE YEARS. Not a WORD of these temps is true. It’s all FAKE. It stopped WARMING in 1 9 9 8.
Met Office: 2013: after FIRING JONES for NOT REVEALING it STOPPED WARMING in 1 9 9 8
MET OFFICE two YEARS LATER ISSUES PRESS RELEASE: ”THERE HAS BEEN NO WARMING SINCE the BEGINNING of 1 9 9 8. (Actually I think THEY said JANUARY 97).
NO WARMING for 18 YEARS. Did they go back and CORRECT those RECORDS we have all seen CLEARLY STATED as recording it STOPPED WARMING in 98/97?
No? THEN ALL THAT DATA is FAKE. It’s FAKE like your story of the MAGIC HEATER i the sky made of COOLANTS
It’s FAKE.
Which goes DIRECTLY to YOUR lack of any reasonable credibility if you claim you never heard of all that.
So YOU’RE in here trying to bark about magic gas and FAKED DATA as CONFESSED by the MAN who FAKED it and ADMITTED by the PEOPLE who FIRED him for NOT ADMITTING it was FAKED.
You’ve got the intellectual bona fides of a crack head. NOTHING you say turns out to be associated with reality or any kind of story you can defend about a THERMOMETER and the FRIGID GAS BATH scrubbing/refrigerating HEAT from it.
Jones was, of course, right – seven years of data cannot determine a statistically significant trend.
That kind of incompetency in comprehension is what has you on the internet about the green house gas coolants being a magical heater.
Coolants? Par for the course, your comments make no sense at all.
The Green House Gases responsible for Diffraction mode loss
thats DIFFRACTIO COOLING currently COOL the planet 20%.
PHASE CHANGE REFRIGERANT water COOLS in UNIQUE acceleration of convection COOLING.
Green House Gas water leads the pack in CONDUCTION COOLING.
Hick.
You’re so f***g illiterate you don’t know what Jones discussed yet you’re sure there’s a giant magic heater in the sky.
Jones was right that a statistically significant trend cannot be determined from a mere seven years of data.
He never even discussed it you’re just s f****g incompetent you can’t tell what he was saying.
Actually they said 2014 was not the hottest year and there as only a 34% chance that it was.
http://www.dailymail.co.uk/news/article-2915061/Nasa-climate-scientists-said-2014-warmest-year-record-38-sure-right.html
And that’s going by their crazy adjusted data
How come everything you claim can be easily proven false with a quick google search?
Are you a paid troll?
Name-calling… the only refuge for those who cannot argue with facts.
Why do you need to resort to character assassination if you are so sure of your ahem….”science”? You are no different to the rest of the charlatans out there because for all your cheap jibes you have NO credible way to separate the effects of man from nature which is what this is all “supposed” to be about. Look at the billions of dollars behind the muppet show which Gore et al get richer and richer by the day from …. I see the Emperor is wearing a fine set of clothes this year…You may be a sheep and rely on referred wisdom … but do not quote models and selectively applied gradients and then condemn anyone who looks at the data. You are no better then the religious persecutors of history. PS Buy an extra thick duvet because you will need it for your yurt when the next high pressure cold snap settles and the highly subsidized windmills you embrace stop turning.
Really, how would you address this lack of warming: http://bit.ly/2hP08AH
How much more proof do you need than the East Anglia/Penn State e-mail scandal?
If you can disprove the science in
http://www3.epa.gov/climatechange/kids/
&
http://climatekids.nasa.gov
with the claims from some righting science denying blog, go forr it.
But, it is noted you didn’t do more than bluster.
As long as we have political hack dykes heading up the EPA, recommend tuning out. Agency will soon be cleaned up.
Cogent /s
“political hack dykes ” Unfortunately, not /s
Thank you for highlighting the degree to which anti-science activism and standard old Archie Bunker bigotry share deep cultural ties Leonard. God Bless.
See how you know you can’t win with facts, truth, logic or science so you have to go with ad hominem instead? How is anything in your above comment in any way an honest attempt to have a dialog or communicate a logical, sensible argument?
Oh, wait, you don’t have any!
For those who may not understand what Bodhi’s ire with me is about 🙂
https://disqus.com/home/discussion/telegraphuk/as_a_scientist_i_am_ashamed_at_how_little_we_are_doing_about_climate_change/#comment-2388048724
Um, proof for what? That scientists tend to think guys like Morano are hostile hacks? Didn’t need the email scandal to tell you that.
If you are truly trying to inform yourself, start with good resources:
http://climate.nasa.gov
http://www.metoffice.gov.uk/climate-guide
http://www3.epa.gov/climatechange/science/causes.html
Summary for Policy Makers
http://ipcc.ch/pdf/assessment-report/ar5/syr/AR5_SYR_FINAL_SPM.pdf
And pay attention to how information is being presented to you:
How to Evaluate Resources
“The CRAAP Test* is a useful guide to evaluating resources. CRAAP is an acronym for the general categories of criteria that can be used to evaluate information you find. Use the CRAAP Test to decide if information is appropriate for your research!”
https://www.gettysburg.edu/library/research/tips/webeval/index.dot
Handy version to print out and stick on the side of the monitor:
Evaluating Information – Applying the CRAAP Test – CSU, Chico
https://www.csuchico.edu/lins/handouts/eval_websites.pdf
Check the “official” temperature data from NCDC. Let’s just look at 2014.
Here we have the actual data, which has a lot of gray areas, because that is missing data:
Here we have the “data” that NOAA submits to the gullible press and gullible alarmists, and tells us that it is actual temperature data:
So how do they get the “data?” They estimate it.
Thanks for the use of quotemarks!
Some deluded moron in the comments section pull one chart out of his ass and that trumps Lord Monckton?
THAT is crap.
“The latest ‘corrected’ analysis”? “Corrected”? The previous analysis didn’t show any global warming for a decade and a half, so they changed the data to get the warming they wanted. But it didn’t work, because the satellites show there’s been no warming for 18 years 9 months. And surface warming should be happening more slowly even than the lower troposphere, which the satellites measure.
So don’t just believe the politicized handouts from rent-seeking government organizations. Think. Check. Belief has no place in science.
So here is the thing. One of the satellite data sets DID show warming until Spencer changed it ……… and then it didn’t.
This graph is from NOAA after they have adjusted the base temperature data (which didn’t show an increase.) It has been shown to be a fraud.
Are you aware the satellite readings also need copious adjustments?
Are you aware the satellite readings also need copious adjustments?
Are you aware that the only reason that the earth-based temp data now results in warming for the last 18 years, instead of matching the satellite and balloon data which show no warming, is due solely to those adjustments?
Do you really want to make compulsory, massive changes in everyone’s lives based on claims that do not result from a set of data, unless those data are modified? What was wrong with the original data, since the claim from those “scientists” deriving the data is that the science was settled?
And satellite data only shows a flat trend due solely to adjusting past temperatures.
And the satellite data only show no recent warming BECAUSE OF ADUSTMENTS.
Nope. That satellite data never showed any warming in that period. Until the Karl study the Earth-based data didn’t either.
False — both satellite datasets show long-term warming.
Then UAH adjusted the recent warming away. Cooling.
False — both satellite datasets show long-term warming.
Nope. Check RSS since 1998. Slight decreasing trend.
Also check 1940-1980, any data set. No increase, in spite of great CO2 increases. Models failed.
“Near-zero and even negative trends are common for intervals of a decade or less in the simulations, due to the model’s internal climate variability. The simulations rule out (at the 95% level) zero trends for intervals of 15 yr or more.” “State of the Climate in 2008”]. Bull. Amer. Meteor. Soc., 90 (8), S1–S196 http://www1.ncdc.noaa.gov/pub/data/cmb/bams-sotc/climate-assessment-2008-lo-rez.pdf
By their own standards, the global climate models have failed.
I said “long-term.” Cherry-picking the year of highest temp is not scientific or convincing.
How about if we let NOAA decide what long-term is, and whether their models are useful?
“Near-zero and even negative trends are common for intervals of a decade or less in the simulations, due to the model’s internal climate variability. The simulations rule out (at the 95% level) zero trends for intervals of 15 yr or more.” “State of the Climate in 2008”]. Bull. Amer. Meteor. Soc., 90 (8), S1–S196 http://www1.ncdc.noaa.gov/pub/data/cmb/bams-sotc/climate-assessment-2008-lo-rez.pdf
The 40 year period isn’t long enough? Why not, if it disproves the veracity of the GCMs?
Yes that is true; but those adjustments don’t always go up like the NOAA ones do
No – they always go downward:
http://davidappell.blogspot.com/2015/06/noaas-data-changes-actually-smaller.html
UAH’s recent adustments led to cooling. Coincidence, given that that group are well known skeptics who have been famously wrong in the past (when they were too cool)?
UAH, in the previous version, showed COOLING since April of 2009. UAH’s recent adjustments only lead to an increased span of how long it has been cooling https://uploads.disquscdn.com/images/2336d26d2f34b633b8e53c00e6f0be359daad744a4deb9073493ecd71d754639.jpg
WOW, since April 2009???
What has the trend been since last Friday?
… how long have the ARGO floats been used to support the ‘ocean heat content’? ARGO reached 3000 floats in 2007. https://uploads.disquscdn.com/images/c8c1285dc56c300581dc9061e154e4610eaaf3929238feaeeb0838ec4ac7010b.jpg
Since 2007. The ocean heat content has increased steadily since then:
http://www.nodc.noaa.gov/OC5/3M_HEAT_CONTENT/
Why is the ocean steadily gaining heat?
Well, … it isn’t. The aggregate data presented by NOAA, as directed by NOAA’s Commander In Chief (would you expect dissension, in the ranks?) … is an aggregate ‘warming’. Since the aggregate COOLING is below the depth capability of the ARGO probes, and most XBT probes, and it isn’t being measured, perhaps the measured ‘warming’ would be countered by the unmeasured COOLING?
Wunsch and Heimbach 2014, 293 ”At all depths, but particularly in the upper ocean, regions of warming are at least partially compensated in the global integrals by extended regions of cooling (especially the tropical Pacific … and North Atlantic subtropical gyre). These patterns emphasize the problem of having adequate spatial sampling to generate mean values consistent with the accuracies [claimed] in Table 1.”
Wunsch and Heimbach 2014 points out that “the warming” 160 ”… is similar to the 135-year 700 m depth ocean rate of 0.2±0.1 W/m2 of Roemmich et al. (2012).”.
One of the points made by W&H ’14 is that the ”Interpretation requires close attention to the long memory of the deep ocean, and implying that meteorological forcing of decades to thousands of years ago should still be producing trend-like changes in abyssal heat content.” … W&H ’14 further augments this point by Figure 7, https://uploads.disquscdn.com/images/a31f18b52ac2afcd8c74ee4a1efa706dddedcbc615fe33d805a1b0f30efe2dd0.jpg
ie, what happened, decades to thousands of years ago?
Please note, of all the paleotemperature charts available, W&H ’14 did not show:
https://uploads.disquscdn.com/images/5d21bfee4f2d7ebb79936cba80a892b9d2cf3a2a2305a145fa3cfb81128a3203.jpg
A slight temperature cooling, but multiplied by a very large volume of water:
https://uploads.disquscdn.com/images/6e9080935ae8b8f857bac45d3655b4013e627ca346c171816adf16fad110fdd9.jpg
W&H ’14 poses the question of accuracies and precisions … and signal-to-noise…
62 ”An important question, pursued elsewhere, is whether available observations alone are capable of determining mean ocean temperatures, and the related heat content changes with time, to accuracies and precisions useful at these levels?”
73 ”By some standards … an impressive amount of data does exist: an evaluation of their [in]adequacy can only be made in the context of the signal-to-noise structure…”
Hadfield 2007: ””The noise is less than 0.5°C in the eastern basin and below 1000 m in the western basin.… there are two main regions centered at 500 m in the western basin where the noise exceeds 2°C.”
Hadfield, R. E., et al. 2007 “On the accuracy of North Atlantic temperature and heat storage fields from Argo.” Journal of Geophysical Research: Oceans
http://www.rsmas.miami.edu/users/mocha/mocha_pubs/hadfield_etal_07_jgr.pdf
So, what’s the signal? 0.02ºC … what’s the noise? Well, in some places, 2 ºC. Did your ‘three degrees in the field’ cover S/N ratio? 0.02/0.5 nominally, 0.02/2.0?
Hadfield ’07: “…The root-mean-square (RMS) difference in the Argo-based temperature field relative to the section measurements is about 0.6°C. The RMS difference is smaller, less than 0.4°C, in the eastern basin and larger, up to 2.0°C, toward the western boundary.”
Hmmm, what is in the western boundary? Oh, the Gulf Stream, the Florida current… Narrow, shallow bands of hot water. So, manually-placed XBT probes, compared to freely-drifting ARGO probes, and the Root-Mean-Square error can be two orders of magnitude larger than the expected signal? Sounds like a problem.
Hadfield again: “However, the expected sampling error increases to more than 50 W/m^2 in the Gulf Stream region and north of 40°N, limiting the use of Argo in these areas.”
Cunningham 2010: ”The uncertainty derives mainly from the fact that XBT observations are made only in the upper kilometre of the ocean, with an additional significant uncertainty due to the high-frequency variability of the flows at the boundaries. … another important source of error is the lack of observations of the barotropic component of the flow, particularly west of 47°W. This is important because, … the North Atlantic Deep Water flow … whose magnitude and variability is practically unknown.”
”…the thermohaline circulation is not unambiguously quantified by these observations, and interpreting the variability in the thermohaline circulation from them is complicated by their partial nature.”
”…the northward upper branch of the AMOC, and the southward return flow between 2000 and 3000 m depth.”
Cunningham, Stuart, et al. 2010 “The present and future system for measuring the Atlantic meridional overturning circulation and heat transport.”
http://sunburn.aoml.noaa.gov/phod/docs/Cunningham_ThePresentandFuture.pdf
“Since the aggregate COOLING is below the depth capability of the ARGO probes, and most XBT probes, and it isn’t being measured….”
False.
See, for example, “Deep ocean heat content changes estimated from observation and reanalysis product and their influence on sea level change,” Kouketsu et al, GRL v116 (March 2011)
http://onlinelibrary.wiley.com/doi/10.1029/2010JC006464/abstract
which finds a heat content change of only +0.05 W/m2 for the ocean below 3000 meters. Compare that to +0.30 W/m2 for the 0-700 m region for the last 10 years, and +0.64 W/m2 for the 0-2000 m region for the last 10 years.
Wunsch and Heimbach wrote:
“In the global average, changes in heat content below 2000 m are roughly 10% of those inferred for the upper ocean over the 20-yr period.”
That’s WARMING.
The ocean heat change of the 0-700 m region of the ocean over the last 20 years is +0.33 W/m2.
CB. Fisting is probably not the best career choice you could have made.
https://uploads.disquscdn.com/images/b879cd334edd984ebb118a1a5cafbb816452ffa70436dac468e78f23a62c8bef.jpg Paused?
Name-calling… the great refuge of those who cannot argue with facts.
Name-calling. The final refuge of those who have no real rebuttal. And it’s childish, too.
You really need to see a psychiatrist CB. You are spending way too much time making nonsensical statements on line.
You are at over 18,600 comments. I think you are manic and over the top in these ridiculous pompous statements.
You need help NOW
As we all know by now, global warming has accelerated in the last few years, not slowed down –
http://images.sodahead.com/profiles/0/0/2/0/7/6/2/8/5/GEA-141361307138.png
IPCC AR5 cites the following trends in global energy accumulation:
1971 to 2010: 213 TW
1993 to 2010: 275 TW
[IPCC AR5 WG1 Chapter 3 Box 3.1 p. 264.]
The latter figure is larger, meaning that global warming has accelerated.
AR5 also says: “The Earth has been in radiative imbalance, with more energy from the sun entering than exiting the top of the atmosphere, since at least about 1970.” (i.e. at least the last 45 years).
All of the recent studies of planetary energy balance show that the climate system is accumulating heat at a rapid rate –
“Argo era observed planetary energy imbalances are 0.70W/m² in 2003-2008 and 0.59W/m² in 2005-2010.”
Hansen, J., M. Sato, P. Kharecha, and K. von Schuc ann (2011), Earth’s energy imbalance and implications, Atmos. Chem. Phys., 11,13,421–13,449, doi:10.5194/acp-11-13421-2011.
—————-
“We combine satellite data with ocean measurements to depths of 1,800 m, and show that between January 2001 and December 2010, Earth has been steadily accumulating energy at a rate of 0.50±0.43 Wm−2 (uncertainties at the 90% confidence level). We conclude that energy storage is continuing to increase in the sub-surface ocean.”
Loeb, N. G., J. M. Lyman, G. C. Johnson, R. P. Allan, D. R. Doelling, T. Wong, B. J. Soden, and G. L. Stephens (2012), Observed changes in top-of-the-atmosphere radiation and upper-ocean heating consistent within uncertainty, Nat. Geosci., 5, 110–113, doi:10.1038/ngeo1375.
——————
“For the 2000s… the total energy imbalance implied by ORAS4 is 0.91 ± 0.10W/m² ”
Kevin E. Trenberth, John T. Fasullo, and Magdalena A. Balmaseda, 2014: Earth’s Energy Imbalance. J. Climate, 27, 3129–3144.
——————
Earth’s energy imbalance between 2000 and 2012 was 0.62W/m², according to this study:
Allan, R. P., C. Liu, N. G. Loeb, M. D. Palmer, M. Roberts, D. Smith, and P.-L. Vidale (2014), Changes in global net radiative imbalance 1985–2012, Geophys. Res. Lett., 41, 5588–5597, doi:10.1002/2014GL060962.
Unfortunately for the accident-prone Icarus62, the graph he shows takes insufficient account of the best ocean-temperature dataset we have, which is the network of 3600+ ARGO bathythermograph buoys, each of which takes three temperature and salinity profiles each month. During the entire 11-year record, the ocean’s surface layers are shown as not warming at all, while the layers beneath are warming a little. Taking the average across the entire 1.25-mile-deep temperature profile, the warming rate over the past 11 years in the ocean is equivalent to a not particularly terrifying 1 degree of warming every 430 years. The reason, as any schoolboy knows, is that the ocean is a very substantial heat-sink three orders of magnitude denser than the atmosphere, which accordingly has very little power to warm it at all rapidly.
Indeed, and your response shows precisely why the “No Global Warming for 18 Years!” meme is such a ridiculous charade.
There has been no warming of the lower troposphere, at all, for 18 years 9 months (RSS), or 18 years 6 months (UAH). There has been no statistically-significant warming on any of the datasets for at least 14 years, and up to 22 years on some of them. There has been no warming of the upper strata of the ocean during the entire near-12-year ARGO bathythermograph record. The top mile and a quarter of the ocean shows warming coming not from above, as the IPCC predicts, but from below – and even then only at a rate which, averaged over all the strata that are measured, amounts to a mere 1 degree of warming every 430 years.
It is childish and anti-scientific to ignore these observed realities, which show the ever-widening gulf between the extremist predictions of the IPCC in 1990 and the far less exciting, and entirely unalarming, reality that has been observed in the quarter-century since then.
The fact that you know perfectly well that the oceans are by far the largest heat sink in the climate system (as you just admitted), and that the oceans are warming relentlessly, tells us all we need to know about the integrity of your claims.
http://www.nodc.noaa.gov/OC5/3M_HEAT_CONTENT/heat_content2000m.png
Your sneaky change from “no global warming at all” to “no warming of the lower troposphere” only reinforces the point that you’ve been caught out in a lie, and are now desperately back-pedaling.
You should be ashamed of yourself for such transparent attempts to deceive.
Don’t be childish. You take money from a climate-Communist advocacy group to disrupt these threads with your hate-speech. You were paid $122,000 last year alone to do this. You are not earning your keep unless you at least make some attempt to address serious scientific points seriously. The graph of ocean heat content that you show here, with the implicit allegation that the head posting overlooks the oceans, is actually reproduced in the head posting itself. You were so anxious to get your monthly check from the environmentalist-socialist activist group that you could not be bothered even to read the head posting you presumed to attack, with your entirely false allegations of deception on my part.
The increase in ocean heat content is actually determined from the increase in ocean temperature, which is so small that it is an embarrassment to the environmentalist extremists. During the 11 years of the ARGO bathythermograph record (before 2004, ocean heat content is little better than guesswork), the rate of ocean warming has been equivalent to 1 Celsius degree every 430 years.
It is precisely because the oceans are a formidable heat-sink that we do not need to worry about rapid global warming of the atmosphere. The heat merely accumulates in the oceans. Now, 260 ZJ since 1970 seems a lot: but it is tiny in comparison to the vast heat capacity of the oceans. Interestingly, the ARGO temperature profiles show that the surface layers of the oceans are not warming at all, though that is where the warming would be occurring if the atmosphere was warming (which, as the satellite datasets show, it is not). The warming is coming from below, inferentially from a no doubt transient naturally occurring increase in the activity of the 3.5 million subsea volcanoes ranged chiefly along the mid-ocean tectonic divergence boundaries, through which unmonitored magmatic intrusions directly heat the abyssal strata (which, however, have so large a heat capacity that their mean temperature is 3-4 Celsius degrees).
The oceans, then, are no help to the climate extremists. They are one of the many important reasons why the models have exaggerated so relentlessly, leading to equally relentless exaggerations of predicted warming by the IPCC.
Now, my suggestion is that you go back to your Communist paymasters and tell them that wasting everyone’s time bullying those who might otherwise express support for the questioners’ position on the climate issue is not a productive use of their money or your time. The science is implacably against your lies, deceptions, falsehoods, and frauds. You gain financially by disrupting this and many other threads, and you cower behind anonymity in the hope that no one will detect you. However, the public authorities in many countries are now looking at the extremists’ activities, funding, and fraudulent behavior. Yours is just one of a dozen aliases whose true identities are now known to the authorities. It is only a matter of time before you find yourselves in jail. In future, stick to the truth, and don’t bother wasting any more time here.
You really ought to stop now. You’re just embarrassing yourself even further.
Is that the best a highly-paid climate-Communist troll can think up? Why not admit who you are? Then you might have some credibility. As it is, with every successive and vicious intervention, you reveal the hatred of the truth that your shoddy creed evinces, the willingness to kill millions via denying them the affordable, reliable, clean fossil-fuelled electricity they need, and a complete ignorance of climatological physics.
Meanwhile, all levels of the troposphere and all levels of the ocean fail to warm at the rates predicted by the climate Communist profiteers of doom. The discrepancy between wildly-exaggerated prediction and unexciting reality will continue ineluctably to widen. And no amount of paid trolling will alter those facts.
I’m not communist and I’m certainly not paid to be here, but I can see that every single national scientific institute regards your opinions as just so much lunatic voodoo science.
Your own posts reveal the depths to which you are prepared to sink in order to sling mud at and attempt to intimidate anybody who takes the trouble to point out your schoolboy scientific errors and obvious attempts to misinform and mislead.
You really are a very, very nasty piece of work.
It’s good to find someone from the believers’ side of this debate who is not profiteering by being paid to disrupt these threads. You are, however, unbecomingly anonmyous. Why not admit who you are? To make personal attacks from behind a cowardly cloak of anonymity is yellow. I do not intimidate anyone. I am free to call out the anonymous, paid, climate-Communist trolls for what they are. If they want to say who they are, we can then have a sensible conversation about the climate.
I guess you are an environmentalist-Socialist: for it is only that totalitarian group that clings foolishly to the belief, demolished by Aristotle in his Sophistical Refutations 2350 years ago and confirmed by Thales of Miletus, Abu Ali Ibn al-Haytham, Newton, Einstein and Popper, to name but a few, that science is done by a supposed “consensus” of imagined “experts”. Anyone with a sufficient grounding in elementary formal logic will at once recognize your argument from a “consensus” of “experts” as an unholy conflation of two of Aristotle’s fundamental and now well shop-worn fallacies of logic: the fallacy of argument from mere headcount and the fallacy of argument from the supposed qualifications of imagined experts. Logically speaking, it does not necessarily follow that because some (by no means all) scientific advocacy groups say the world is warming at the predicted rate they are right because they are many or they are right because they are eminent.
You have provided no evidence that any of these scientific advocacy groups has stated that the rate at which the world has been warming since 1990 is greater than the rate then predicted by the IPCC. Hint: the truth, on all datasets, is that the rate of warming since 1990 is below the least prediction then made by the IPCC. It would, therefore, be remarkably silly of any scientific advocacy group, however eminent or official-looking, to say any such thing. And I am not aware that any has done so. If so, then let us have a look at the evidence of what they are saying; and then let us compare it with the evidence of the principal satellite datasets and the principal terrestrial-tamperature datasets and the principal ocean dataset.
For science is a process not of belief in the wisdom of experts, however many you line up, but of checking the theory against the data. The head posting makes the simple point, with what any rational mind would accept was a considerable body of evidence, that the data – thus far, at any rate – do not reflect the extreme predictions first made by the IPCC a quarter of a century ago.
No amount of invective on your part, or on the part of any troll with hate rather than learning in his heart, will alter the ineluctable numbers. For, in order to get the scare going, the IPCC had to make lurid predictions. Having made those predictions, it must not now act surprised if enquirers such as I am decide to verify the extent to which those predictions are reflected in observed reality. It has long been evident (I have been producing these graphs since 2008) that the IPCC’s predictions were flat wrong. They were grossly exaggerated. Indeed, as one of the IPCC’s expert reviewers I played my part in persuading it that it must revise its predictions sharply downward. It was compelled to act on this recommendation, at least with respect to the medium-term fraction of the prediction curve. However, it continues to cling – with increasing and desperate implausibility – to its exaggerated longer-term predictions. And that is unwise: for it is evidence of fraudulent intent on the part of the lead authors.
They know perfectly well – for reasons I shall not go into here, but you can watch my interventions in Paris and Essen next month for details – that the amount of global warming to be expected this century, on the RCP 6.0 “business-almost-as-usual” scenario, will not exceed 0.5 Celsius degrees. Not exactly a problem, is it? Yet they have knowingly published predictions about which we can demonstrate two things: first, they know the predictions to be exaggerated, and know it clearly: and secondly, that they intend to persist in those predictions, false though they obviously be, till they are prosecuted. And that is the fate that now awaits them. The Swiss bureau de l’escroquerie (the IPCC being headquartered in Switzerland) has had its attention drawn to the fraudulent activities within the IPCC. So have several national investigating authorities. In my assessment, it is only a matter of time before one of two things happens: the IPCC backs off from its extremist predictions, or those who have put their names to those wild exaggerations as lead authors, knowing the exaggerations to be false, will go to jail.
The raw-material prices of coal, oil, and gas have all fallen over the past decade: yet energy bills are thrice what they were ten years ago. That is causing real hardship, particularly among the poor. One close to me was found in a recent cold winter, collapsed on the floor of her unheated house (the indoor temperature was below freezing), because she could no longer afford to keep the heating on. The sole reason: the price hikes to subsidize useless windmills and solar panels, which cause environmental devastation at vast cost, and actually add in net terms to the quantity of CO2 emitted (not that that is a problem).
So, like it or not – and you evidently don’t – in the end the truth cannot be concealed. The predictions were exaggerated, and the extent of the exaggeration becomes greater and more visible by the day. Perpetrating logical fallacies will not alter the facts: it will merely make you appear feeble-minded.
As for your allegation that I have made unspecified “schoolboy scientific errors”, why not read through the head posting and let me know what is wrong with it? I am always open to being corrected if I have made a mistake. But I have gone to more than usual lengths to verify the accuracy of the graphs, and you can determine the least-squares trends on the various datasets for yourself if you have reason to believe that they do not show what I say they show. But mere yah-boo won’t hack it here. Yah-boo is the grunt of the yahoo. Here we talk science and data, not climate-Communist politics.
TL:DR
Totally Logical: Definitely Right. How very kind of Aussieinswitzerland to accept the argument I set forth above.
I think what you are failing to grasp is the fact that nobody cares what you think.
You are wrong, probably deliberately so, on the science and your motives for propagating this idiocy are murky to say the least.
The facts have left you behind.
Of course no scientist cares what I think. No scientist cares what anyone thinks, on a scientific question. What true scientists care about are the facts and the data. One takes it that Anaussieinswitzerland is entirely unable to find anything actually and materially wrong with the facts and data presented in the head posting, and resorts to mere yah-boo as a substitute for rational thought followed by reasoned discussion. And that, in the end, is why the climate Communists are as doomed to failure as their totalitarian predecessors in the National Socialist Workers’ Party of Germany and in the Communist Parties that killed so many hundreds of millions between them in Russia, China, Cambodia, North Korea, Eastern Europe and elsewhere.
Hate-speech from anonymous trolls may well succeed in its intention of frightening off anyone who might dare to challenge the climate-Communist Party Line: but, because the Party Line began with predictions scary enough to alarm scientifically-illiterate governments, and because those predictions have now been proven by real-world measurement to have been wild exaggerations, regardless of what I think the discrepancy between wild prediction and unexciting reality will continue ineluctably to widen until all will be able to see that the climate Communists were as wrong about this as totalitarians everywhere are wrong about everything.
Meanwhile, I am one of a growing army of freedom, and we shall continue to speak the truth quietly, authorititively, whether the climate-Communists like it or not. The truth is the truth, and They cannot indefinitely conceal the extent to which Their predictions have failed and failed and failed again.
“Of course no scientist cares what I think”
I didn’t say scientist, I said nobody.
However, I’m sure there are a few scientists who, while not exactly caring, read your pieces avidly.
After all, everybody needs a good laugh from time to time.
“One takes it that Anaussieinswitzerland is entirely unable to find anything actually and materially wrong with the facts and data presented in the head posting”
It’s been done so many times before by people far better qualified than me that repetition is redundant.
“And that, in the end, is why the climate Communists are as doomed to failure as their totalitarian predecessors in the National Socialist Workers’ Party of Germany”
Classic Godwin.
As for the rest of your post, more of your usual drivel and really not worth the time to read let alone respond to.
Don’t be childish. Monckton’s Law states that Fascists, when caught out as the Fascists they are, snivel about “Godwin’s law”. The use of the term “Godwin’s Law” by these people is accordingly an admission that they are Fascists but do not wish to be called out as such.
It remains the case that “Aussieinswitzerland” has been unable to produce a single scientific point in challenge to the head posting, or to my replies to him here, inferentially because he knows I’m right but can’t admit it.
Even Exxon knows your BS is just BS. 🙂
And yet the rate of global warming since 1990, on all datasets, is considerably below even the least prediction made by the IPCC that year. That is a fact, and no amount of paid climate-Communist trolling will alter that fact.
You are really stupid to think that some right wing blogger can disprove man made climate change, when even Exxon with all it’s resources couldn’t.
You have got be even more stupid to think you have some kind of credible study from some right wing denier blog that will disprove man made climate change, and yet you can’t get funding from Exxon to publish in some credible scientific journal.
But I just think you are the very worst of mankind, a sociopath willing to do anything for money.
And just his word for ‘evidence’…..
Monckton has been living inside the teanut wingnut bubble, where no one questions a good “Commie/Nazi” story. He’s baffled by the idea that people would actually not take his bullshit at face value.
Right wing authoritarianism
http://www.psych-it.com.au/Psychlopedia/article.asp?id=388
What is funny is that he calls his opponents “climate-Communists” but then has the audacity to publish in a journal in a Communist country.
If everybody had to drink each time Monckton said the word Communist we would all be wasted. I mean how can you take anyone seriously that throws that term out so liberally. He must think it some sort of code word for the teanut wingnuts.
After Monckton and his allies went about crowing that his article in an APS newsletter was “peer-reviewed,” the APS started appending notices on all its newsletter articles stating they are not peer-reviewed. Monckton claimed it was all a Communist plot. Marxist, to be precise.
But when have I ever attempted to “disprove man-made climate change”? We exist; therefore, to some degree or another, we affect our environment, as does every critter on Earth. The question is not whether man-made climate change is possible, for elementary and well-established theory – established not by “consensus” but by experiment – indicates that enrichment of the atmosphere with CO2 will be likely, all other things being equal, to cause some warming. The $64,000 question is not whether, but how much. And the answer, so far at any rate, is “very little”.
And no one pays me to compile my monthly updates on global temperature. I do it because I’m interested enough to download the data off the satellites or the servers and do the math and publish the results for all who are interested. These monthly graphs have proven to be very influential in bringing the world to realize that the predictions and the reality have turned out very different from one another. That is the first step toward more realistic and less exaggerated predictions. The IPCC, on my advice as one of its expert reviewers, has begun to revise its predictions downward. So have the modellers. On my understanding of the underlying climatological physics, they have quite a long way further down to go before their predictions become realistic. Even on their own “mainstream” methods and data, one would not expect to see more than 0.5 K global warming this century. And what on earth is “sociopathic” about reporting my scientific results in the learned journals from time to time, and reporting the actual trends on the real data? Don’t be childish.
What is your source of income, if you don’t shovel BS for the fossil fuel boys for a living?
My sources of income are none of your business. However, I have a number of patents and inventions; I write; and I have saved thriftily.
I take it that you have no serious scientific point to make, as usual.
Serious scientific comments are made in serious scientific journals. BS on your patents, and cures for Aids, etc…
Everybody knows you are paid shill for the fossil fuel boys. Have you ever received money (donations as you like to call them) from tobacco and fossil fuel companies?
I take it that you have no serious scientific point to make. And I note your contempt for the sick people who have been helped (at great cost to me) by the medication I am researching.
And what evidence do you have that I am “paid by the fossil-fuel boys”? Or that I have ever been paid by any of them? None.
Besides, my arguments, unlike those of the climate Communists, are set out in detail, with references, where anyone can verify them. That is how science is done. And my research shows, definitively, that the rate of global warming predicted by the IPCC in 1990 has not come to pass; is not coming to pass; and will not come to pass. So, if you are unable to make any scientific points, don’t waste your time here.
To answer the same question again. Serious scientific comments are made in serious scientific journals. What is sad is that you call others “climate-Communists” but then have the audacity to publish in a journal in a Communist country.
As for evidence you are a paid shill for the fossil fuel boys;
https://www.youtube.com/watch?list=PL82yk73N8eoX-Xobr_TfHsWPfAIyI7VAP&v=fbW-aHvjOgM
Moncktons Rap Sheet: https://bbickmore.wordpress.com/lord-moncktons-rap-sheet/
The bunkum videos need to be posted after every ‘monckton’ post!
Ah, so you are entirely incapable of producing a single scientific argument that stands up, so you recycle old internet trash as though that were going to advance your argument. Must try harder.
Meanwhile, the world continues to fail to warm at anything like the predicted rate; there has been no landfalling Atlantic hurricane of Cat 3 or more in a decade, the longest hurricane drought in recorded history; global sea-ice shows little change either in extent or in trend; hurricanes, tropical cyclones and typhoons are neither more numerous nor more intense nor longer in duration than for the past 150 years; the area of the globe under drought has been falling for 30 years; sea level is barely rising, and can only be made to rise by an entirely artificial glacial isostatic adjustment; in any event the sea-level satellites show less sea-level rise than the intercalibration errors between them, which means there is no statistically-significant rise at all; and it would in any event be 10-100 times costlier to mitigate global warming today than to adapt to it the day after tomorrow, even if predicted warming had occurred, which it hasn’t. Like, get with the picture, man: it’s not a picture of apocalypse, now, is it?
Who would want to waste time listening to you about science?
Monckton claimed that he has developed a cure for Graves’ Disease, AIDS, Multiple Schlerosis, the flu, and the common cold. This is no joke–he actually filed applications to patent a “therapeutic treatment” in 2008, 2009, 2010, 2011, 2012, and 2013. Bluegrue speculates that Monckton is likely filing his applications and then letting them lapse after a year without paying the fees necessary to have the Patents Office take the process forward. That way, he can claim he has filed for a patent, but never has to have the Patent Office determine whether his “therapeutic treatment” is patentable (or pay any fees). Is it homeopathy? Massive doses of vitamin C? The world waits with bated breath.
The list of diseases cured by Monckton’s miracle tonic expands from time to time. At one point he claimed, “Patients have been cured of various infectious diseases, including Graves’ Disease, multiple sclerosis, influenza, and herpes simplex VI.” At another time he said, “Patients have been cured of various infectious diseases, including Graves’ disease, multiple sclerosis, influenza, food poisoning, and HIV.” Maybe some of you physicians out there can help me interpret this, but it looks to me like Monckton is claiming that his Wonder Cure will 1) wipe out any virus without harming the patient, and 2) cure auto-immune disorders that may (or may not) have initially been triggered by a viral infection. It is unclear to me whether bacterial infections are supposed to be affected since, for instance, food poisoning could be caused by either. [UPDATE: Monckton apparently is saying the miracle cure should be effective against both viral and bacterial infections, as well as prions.]
https://bbickmore.wordpress.com/lord-moncktons-rap-sheet/
That is off topic. A civilized person, one who was not being paid to disrupt these threads, would wish us well with our research, for it has benefited many and, if we can prove it to publishable standard, could help millions more.
Meanwhile, back at the topic of the head posting, there has been no global warming for 18 years 9 months.
Human trials?
Could we get the info on the studies?
“..have been helped (at great cost to me) by the medication I am researching.”
Yes, you can get all the information, anonymized of course in accordance with the law: but only when we have concluded our researches and have proved (i.e. tested) the claims in the patents. If they prove out (some will, some won’t, as is usually the way with these things), the research will be published in a leading medical journal – indeed, one paper on an aspect of our research appeared in Nature some years ago, – and at that time you will be able to read the results of our research, and you will demand to know which paper, and you will be told, two or three times, and you will go on demanding to be told the reference.
But your paid trolling, and your evident contempt for the sick people whose lives have been transformed by our approach, will not stop us from continuing our researches. Till those researches are concluded, we make no claims.
Ah, so nothing substantive….
What
A
Surprise. 😉
1. The subject is off topic. 2. The law does not permit us to make claims: the most I have said is that we are researching a method of treating infectious diseases and have had some promising results. Beyond that I cannot and will not go until we have proved the patent and published. If you don’t like the law, don’t whine: work to change it. In the meantime, I’m abiding by it. Get over it, and get back on topic, and show a little more respect for the sick people we are trying to help.
https://bbickmore.wordpress.com/lord-moncktons-rap-sheet/
“…, we make no claims.”
https://bbickmore.wordpress.com/lord-moncktons-rap-sheet/
Bickmore is an unreliable source. We make no claims. Get back on topic.
There has been no global warming for 18 years 9 months (RSS); 18 years 6 months (UAH); and 11 full years (the entire record: ARGO). The models and the IPCC did not predict that. And that is the central problem for the climate Communists, which is why they are trying so desperately to change the subject.
Perhaps curently. “Make”
But until you can refute the cited material in Bickmore, ‘made’ seems acurate.
So maybe another example of the rhetoric you Ned do to suporting your assertions.
Off topic. Asked and answered. Get over it ,
Otiose repetition is the hallmark of the petty mind. Asked and answered.
Meanwhile, the world is not warming anything like as fast as predicted. That’s the main point you now seem uncommonly anxious to shy away from.
“predicted”
Show us the ‘prediction’.
Do’t be silly. Asked and answered. The prediction is clearly set out and explained, with all necessary references, in the head posting, as you have already been told. Grow up.
Where in ipcc do they say predict?
And then show that single number
Quotes?
Gone missing.
Citation?
Gone missing
” Everyone is entitled to his own opinion, but not his own facts. ” D.Moynihan
For at least the dozenth time, the IPCC’s word “predict”, together with the amount of warming predicted, from a direct citation, including the page number, is available if you will only read the head posting. You have made hundreds of comments here without having read it. That is the hallmark of the paid climate Communist. Never mind the truth: just make up any old garbage and pretend there’s a “consensus” in support of it. Well, read the head posting. Don’t be pathetic.
Quote. And cite.
Where does IPCC say “predict”
Where does IPCC use a single number in a “prediction”?
“..the paid climate Communist. “
The paid climate-Communist halfwit should read the head posting, where all the references it requests are provided.
“paid climate-Communist halfwit”
I was too generous. Make that “paid climate-Communist lackwit”. Really, the scientific content of “Robert”‘s posts has hit a new low, even by the awful standards of the climate-Communist trolls who are paid to sneer at anyone who dares to question the Party Line. Go and learn some elementary math and science, and then actually read the head posting – or, rather, get someone to translate it into words of on syl-la-ble and read it to you. Then you might begin to understand the truth rather than hissing at it like a goose the day before Thanksgiving. And whatever you do, make sure you wear gloves when you go out, or you’ll bark your knuckles on the rough tarmac as you drag them along.
The world has not warmed for 18 years 9 months. Get used to it.
“…bark your knuckles on..”
We note your “head posting ( perhaps that is where they are compiled?), refers to only one scenario and even there ipcc provides a range.
Yet you insist on “predict” ( w ‘prediction’, used 50 times in your “head posting” ( is that where your numbers come from?)
And a single number. WhatsUpWithThat level of science?
“And my research shows, definitively..”
Warming set to breach 1C threshold
By Matt McGrath
Environment correspondent, BBC News
http://www.bbc.com/news/science-environment-34763036
The rate of warming predicted by the IPCC in 1990 was 1.0 [0,7, 1.5] Celsius from 1990 to 2025. From 1990 to the present, the warming has been 0.27 degrees.
On the much-adjusted terrestrial tamperature records, there has been 0.8 degrees’ warming since 1950 (HadCRUT4), with 0.1 C from 1750-1850 (estimated from the Central England Temperature Record), making 0.9 degrees since 1750. It is the value since 1750 that McGrath is talking about: and, as far as I know, the BBC is not a peer-reviewed journal.
Are you able to cite a single article in any journal that tries to maintain that there has been nearly 1 degree of warming since 1990? No, I thought not. You have mentioned McGrath and his reckoning since 1750 in the hope of fraudulently misleading readers. You have again failed. Now, produce a proper reference or abandon your assertion that I am wrong that the rate of global warming predicted by the iPCC in 1990 has not come to pass.
Not a “the”. Not “predicted”.
“The rate of warming predicted by the IPCC ..”
And again, no citations…..
What
A
Surprise
Asked and answered. Otiose repetition is the hallmark of the small mind.
Ipse dixitally “answered”.
No quotes.
No cites.
No surprise.
“And what evidence do you have that I am “paid ..”
“…$150,000 a year by the ClimateWorks Foundation …”?https://disqus.com/home/discussion/epochtimes/public_misled_on_climate_impacts/#comment-2321269944
“I’d forgotten to add its expenses of around $35,000 a year tax-free. ”
https://disqus.com/home/discussion/epochtimes/public_misled_on_climate_impacts/#comment-2321347678
“OK, $155,000”
https://disqus.com/home/discussion/epochtimes/public_misled_on_climate_impacts/#comment-2321333716
That is off topic. That you are paid sums of that order is undeniable – unless, of course, you are willing to tell us who you are. But then, if you had made as much of a fool of yourself as you have, you would not wish anyone to know who you are (except, perhaps, your climate-Communist paymasters).
My repeated assertions that you are paid, and handsomely, to disrupt these threads with silly, repetitive and often hate-filled comments are entirely credible, because who but a paid troll would want to waste his time trying to disrupt these threads. You are self-evidently incapable of maintaining a scientific discussion even at high-school level: why, then, try to mess about here? You convince no one: but you provide a handy punch-bag for me, because when you fail to make a scientific point, as you nearly always do, I can point out again that the world is not warming at anything like the rate predicted by the IPCC; all who are watching can see that you have entirely lost the argument but are plodding on with the same futile repetitions; and each time you continue, they realize that you are indeed paid, and handsomely, to try to discredit the unassailable facts in the head posting. The climate scare is over. Tough luck for you and your paymasters: hurrah for the rest of us.
On the Michael Coren show, Monckton butchered the history of the DDT ban so badly that he claimed JFK did things after he was dead… among other things. http://timpanogos.wordpress.com/2009/12/31/climate-change-and-ddt-moncktons-inconvenient-and-inaccurate-history/
And what has DDT got to do with global warming? Oh, of course, silly me. It was the environmental socialists that had DDT effectively banned just at the point at which the malaria parasite had been all but wiped out. Annual deaths from malaria had fallen to 50,000, and rose to 1 million or thereby after the ban, and have stayed there ever since. Something like 50 million have been killed by that stupid ban, but the Left cannot admit its catastrophic mistake, based on Rachel Carson’s silly book, with its series of elementary errors.
DDT should now be encouraged for use indoors, where the worst threat from malaria occurs. Out of doors it is less effective, and there is a risk that mosquitoes will acquire immunity to it if it is too widely deployed outdoors.
The environmental socialists were wrong about DDT, and they are wrong about the climate. They are wrong about just about everything. But they will never admit it.
But they are really, really upset with me for showing, month by month, just how wrong their predictions about global warming were. Which is why so many paid trolls have screeched and blubbered and jabbered here. Their incoherence and their evident lack of any scientific knowledge is an advertisement to everybody as much of the utter bankruptcy of the case as of the malevolence with which they pursue it.
Just showing the folks some info about you LORD Monckton. There is lots more, but I have to quit for the day. Will be back tomorrow. 🙂
Monckton represented himself to members of the U.S. Congress as a member of the U.K. House of Lords (the upper house of Parliament.) When people started pointing out that he doesn’t appear on the official list of members, however, he started saying that he is a member “without a seat or vote.” When queried, the House of Lords responded that there is no such thing as a member without a seat or vote, and Lord Monckton had never been a member because he inherited his title (Viscount) in 2006, after all but 92 hereditary peers had been barred from membership in the House of Lords since 1999. When asked to respond about this misrepresentation by members of Congress, Monckton basically acknowledged that the British government doesn’t recognize him as a member of the House of Lords, but claimed that they’re wrong because his “Letters Patent” that granted his title to the family (and presumably mention membership in the House of Lords) had never been revoked by specific legislation. He said that the Lord President of the Council in the House of Lords had admitted that letters patent could only be annulled by specific legislation. However, Tim Lambert actually looked up what the Lord President of the Council said, and it turns out that she used the House of Lords Act 1999 as an example of legislation that altered the effect of Letters Patent. In other words, she said the exact opposite of Monckton’s claim. UPDATE: I should have mentioned that Monckton has also gone about using a logo that it quite similar to that of Parliament. Derek at Friends of Gin and Tonic sent an inquiry to the House of Lords Information Office about Monckton’s claim to be a member and his use of the logo, and they responded that, “The House is currently taking steps with a view to ensuring that Lord Monckton does not in future either claim to be a member of the House or use the parliamentary emblem or any variant thereof.” UPDATED UPDATE: Leo Hickman at The Guardian followed up on this with the House of Lords, and found that it’s just possible Monckton could do prison time. We can only hope, but it appears that Monckton may be quietly backing down! In his latest post on the Watts Up With That? blog, Monckton has changed his logo to a gaudy coronet, rather than the gaudy coronet and pink portcullis. ANOTHER UPDATE: Monckton is still claiming to be a member of the House of Lords, and he has added the portcullis back into his logo (although with wavy chains instead of straight). Now the House has taken the step of publishing a “cease and desist” letter on their website. Full story by Leo Hickman in The Guardian. Here is a nice summary of the legal arguments that have been advanced.
https://bbickmore.wordpress.com/lord-moncktons-rap-sheet/
Off topic again. Seems that you have abandoned the climate argument. I am a member of the House, without the right to sit or vote, and will continue to use my logo until Garter King of Arms says it is registered to someone else, and there is nothing the defalcating Clerk of the Parliaments can do about it.
So, another admission you don’t have any evidence….
“That you are paid sums of that order is undeniable – unless, of course, you are willing to tell us who you are.”
Everyone knows you are paid. That is one of many reasons why you are unwilling to say who you are.
Meanwhile, back on topic, the climate scare continues to collapse as global temperatures fail to rise at anything like even the least rate predicted by the IPCC in 1990.
Hmmm, better tell the IRS …
And my bank
And explain why I ride a bike to go to the market instead of driving a Tesla.
No point in trying to conceal how well your climate-Communist paymasters rewarded you, until recently, for your loyalty to their pathetic cause. But they’ve no doubt noticed the remarkably low quality of your responses here.
Only 0.5 degrees’ global warming is expected by 2100, using mainstream considerations. That’s not a cause worth any climate-Communist money. So they must have other, ulterior motives. And so – if your claim that are not paid is any less mendacious than anything else you claim – must you.
“No point in trying to conceal how well your climate-Communist paymasters rewarded you…”
Might want to run that sentence by your tutor….
“And so – if your claim that are not paid is any less mendacious than anything else you claim – must you.”
Robert is no doubt as unfamiliar with the classical device known to students of ancient Greek as the parenthetical gar clause. The sentence to which with characteristic ignorance he objects is a fine instance of such a clause.
Yup. I don’t speak no greek…
Interesting, though how T. Jefferson, A.Lincoln, W. Churchill, etc were able to use classical rhetorical techniques in sentences that the average reader could understand.
The average reader can understand me just fine. But a climate-Communist troll cowering terrified behind anonymity is paid not to understand. That is why he has not even read the head posting yet, or he would not keep on and on demanding references that are already there in black and white, and occasionally even in color.
More conspiracy…” a climate-Communist…paid not to understand…”
And in a jump the shark effort we get conspiracy theory mission creep…..
“That’s not a cause worth any climate-Communist money. So they must have other, ulterior motives. “
Well. why is it worth anyone’s while to worry about just 0.5 degrees’ warming by 2100? That is all that mainstream science would lead us to expect, on a business-almost-as-usual scenario. And even 0.5 degrees is probably an exaggeration. Have a look, for instance, at the Lorentzian and Voigt line-shape equations used in the models. They’ve borrowed these equations from real physics, not realizing that the equations are approximations that assume instantaneity in the excitation-deexcitation collisions between photons and CO2 molecules in the principal absorption bands, particularly at the far wings where most of the forcing occurs, leading to an overstatement of the CO2 forcing and hence of climate sensitivity on all timescales by 40%. That takes us down to 0.3 degrees’ warming spread over the next four generations.
And what if Professor Ray Bates, an expert on feedbacks in the climate, is right in his recent Moscow talk, in which he says feedbacks must be net-negative, giving a maximum equilibrium climate sensitivity of 0.4 degrees? Or Dr David Evans’ reaching precisely the same result by a different but related method? Or Lindzen and Choi (2009, 2011), who found climate sensitivity below 0.7 degrees? Or Spencer & Braswell (2010, 2011) ditto? In general, there is a massive movement in the journals towards far lower climate sensitivity. Even the IPCC is beginning to recognize this.
So, given how uncertain it has now become that our influence on the climate is or ever could lead to dangerous or significant warming, why are the climate-Communists so insistent on using it as a half-baked excuse for more totalitarianism and less democracy? The Left are going to be ever more severely damaged in their credibility as the rate of global warming continues greatly to undershoot the IPCC’s predictions,.
Prof . Irwin Corey does a better parody …..
Almost a citation!
“recent Moscow talk”
Don’t be childish. I’ve already told you that all you have to do is contact Professor Bates and ask for a summary of his talk. Now, why do you go on and on asking for references when they’ve already been given to you. Get off your wobbly bottom and contact the Professor. But there’d be no point: you have an insufficient education in the physics of dynamical systems to understand a word he’s saying.
“No point in trying to conceal how well your climate-Communist paymasters rewarded you,”
Yeah, I had noticed the BBC, Guardian, NYTimes, NPR, have all stopped writing about ACC…
Must leave a bunch of journalists at Fox,Drudge, Blaze, Breightbart, wuwt, climdepq, etc unemployed…
“climate scare continues to collapse “
The dead horse Global Warming is indeed being flogged in the Marxstream media: but since when did they constitute peer-reviewed science? Where are your scientific references in refutation of the head posting? Or of the other points I have made to you here? BBC? Guardian? You cite these numbskulls as though they were authorities?
Nice; palinesque.. ish
“Marxstream media: “
I’d say the “numbskulls” seem to pretty consistently cite sources .
Unlike the resident namecaller….
Robert is indeed lamentably unable to cite any sources for his opinions when asked to do so. Fortunately, the large number of references in the head posting, demonstrating each stage of the argument meticulously, make up for his scandalously unscientific failure to back up his viewpoint with references. And he is indeed justifiable in describing himself as the “resident namecaller”. After all, it is so safe, isn’t it, to cower behind a coward’s security blanket of anonymity and sneer at his betters.
Well, there are many advantages to Robert’s high-school silliness – and what can one expect from an overpaid 18-year-old climate-communist troll, starry-eyed in his uncritical belief in the Party Line and entirely unwilling and unable to consider any evidence to the contrary, however well-referenced that evidence may be. One advantage is that those who read these threads are commenting to me that they now understand my frustration at the level of robotic stupidity to which the hard, Communist Left has reduced the majority of its faithful followers. They are astonished at the small clutch of paid trolls continuing to make the same silly, unreferenced, trivial, futile, ignorant points over and over and over again. And they are learning – even those who might otherwise have doubted whether the skeptics were right and the climate-Communists wrong – that they need doubt no longer. The climate Communists, as evidenced by their lamentable performance on these threads, are self-evidently wrong about just about everything.
The other priceless advantage is that Marc Morano, our distinguished host here, is paid in accordance with the number of hits his site attracts, and is paid still more in accordance with the number of comments it attracts. The trolls, by writing their hundreds of driveling comments here, are bankrolling ClimateDepot. That is one of the reasons why, when I am ill as I am at present, I am prepared to take the time patiently to answer the trolls’ absurdities. Of course, if they make sensible scientific points and do so without the usual sneering and invective that is a hallmark of those who are of the Devil, I am happy to provide straightforward answers. But if they mess me around, I bite back. And every time any of us presses the “Post” button, Marc Morano makes another few dollars to keep the truth circulating.
More mocktonian Ipse dixit trickery.
Thanks for the continuing use of insulting, obfuscation, rhetoric, and unsupported asertions.
“Robert is indeed lamentably unable to cite any sources for his opinions when asked to do so. “
Well, where are the scientific sources that say the world has warmed at least as fast as the IPCC’s central prediction in 1990, and why do you think those sources are right? Because of their “authority”? The scientific approach is built on questioning the “authority” of the “consensus”, not in head-banging and unthinking deference to it.
You are the one making claims that fly in the face of virtually every paper, report, policy statement by major scientific organizations; that makes it your responsibility to support your claims.
, “Extraordinary claims require extraordinary evidence,” C. Sagan
I see you are unable to cite a single source. You merely hand-wave about “policy statements by major scientific organizations”. But it is not the job of scientific organizations to make policy statements. And how many of those policy statements have been peer reviewed? Nary a one, I’ll warrant. So you are unable to support with peer-reviewed evidence your foolish claim that the rate of global warming has exceeded, rather than fallen well short of, the IPCC’s prediction in 1990.
You have childishly quibbled over the word “predict”, though that – if you had bothered to read the head posting – is the word the IPCC itself used in 1990. You have demanded references, over and over again, but they are all in the head posting, and you refuse to give references for your own climate-Communist crackpot theories, other than “major scientific organizations”.
Since you are making extraordinary claims that the data do not show what they obviously do show, you must produce some evidence. You have failed and failed and failed again to do so. And you have failed and failed and failed again to provide proper evidence of your own on request. Not exactly grown-up conduct, is it? One realizes that you are still a teenager, and one makes some allowances, but you are very well paid by your climate-Communist masters to disrupt these threads, and one would have thought you would have become more competent at it. Anyway, as i have said, your stupidity is making lots of money for Marc Morano: the comment-count has just crossed one of the advertising trigger-points for thousands of dollars in extra revenue. I won’t tell you where the next break-point is, but it’s not far a way, and if this thread makes it, Marc makes not thousands but tens of thousands. So keep at it – though it would be helpful if you would be a little less teenagerish and a little more adult in your replies.
Where? Quote and cite.
” So you are unable to support with peer-reviewed evidence your foolish claim that the rate of global warming has exceeded…”
With less than 1k of comments that are hosted on another site, …
“your stupidity is making lots of money for Marc Morano: the comment-count has just crossed one of the advertising trigger-points for thousands of dollars in extra revenue. ”
Another site that oft crows about hits: wuwt.
Well, WUWT has had a quarter of a billion hits in its few years of existence. Maybe there are some climate-Communist sites to match that, but I do not know of any.
But that is off topic. The topic is the absence of the predicted catastrophic manmade warming for 18 years 9 months. You have no answer to that scientific fact.
Hmmm, let’s see. A namecalling, blotivating, blogger. Or every major scientific organization, 97% of the papers, a long history of published research,
.
I don’t need to argue the science, it is enough to show the idiocy of your claims:
monckton, “No. I’m paid $2,155,000 a year, plus expenses, by a group of governments tired of the hard-Left propaganda of the climate Communists. I’m worth much more, of course, but one must do one’s duty to the truth, however little one is paid.”
https://disqus.com/home/discussion/climatedepot/no_global_warming_at_all_for_18_years_9_months_a_new_record_8211_the_pause_lengthens_again_just_in_t/#comment-2351081300
monckton, “Only 0.5 degrees’ global warming is expected by 2100, using mainstream considerations. That’s not a cause worth any climate-Communist money. So they must have other, ulterior motives. And so – if your claim that are not paid is any less mendacious than anything else you claim – must you.”
https://disqus.com/home/discussion/climatedepot/no_global_warming_at_all_for_18_years_9_months_a_new_record_8211_the_pause_lengthens_again_just_in_t/#comment-2350818365
..monckton, “You take money from a climate-Communist advocacy group to disrupt these threads with your hate-speech. You were paid $122,000 last year alone to do this. ”
https://disqus.com/home/discussion/climatedepot/no_global_warming_at_all_for_18_years_9_months_a_new_record_8211_the_pause_lengthens_again_just_in_t/#comment-2349919377
“Environmentalist Socialism killed 50 million with the hideously msiconceived ban on DDT”
https://disqus.com/home/discussion/climatedepot/no_global_warming_at_all_for_18_years_9_months_a_new_record_8211_the_pause_lengthens_again_just_in_t/#comment-2351630909
“You are paid $155,000 a year, plus expenses.” “Holy Books of IPeCaC ”
https://disqus.com/home/discussion/climatedepot/no_global_warming_at_all_for_18_years_9_months_a_new_record_8211_the_pause_lengthens_again_just_in_t/#comment-2351100136
“Yes, yes, we know your climate-Communist paymasters have asked you to babble ignorantly about Exxon Mobil, but that case is going to be deeply damaging to the hard Left, for Exxon will simply reverse its present knock-kneed chief executive’s kowtowing to the Party Line and come out fighting, on the climate science, and on whether it is “certain”.”
https://disqus.com/home/discussion/climatedepot/no_global_warming_at_all_for_18_years_9_months_a_new_record_8211_the_pause_lengthens_again_just_in_t/#comment-2351842325
Robert monckton a day ago
“Environmentalist Socialism killed 50 million with the hideously msiconceived ban on DDT”
1 Edit View in discussion
Robert
Robert monckton a day ago
“paid climate-Communist trolls”
“climate-communist trolls paid to disrupt these threads”
1 Edit View in discussion
Robert
Robert monckton a day ago
“paid climate-Communist trolls”
1 Edit View in discussion
Robert
Robert monckton a day ago
“climate-Communist technique ”
“Never mind: we rapidly approach the trigger-point at which Climate Depot makes tens of thousands of dollars because the comments have been so numerous. ”
“climate-Communist advocacy groups pay you to be futile..”
“global warming has not at any point happened at the predicted rate..”
“You have no answer to that scientific fact.”
The scientific fact is that there has been no global warming for 18 years 9 months.
http://climate.nasa.gov/evidence/
http://www.metoffice.gov.uk/news/release/archive/2015/2014-global-temperature
http://www.ncdc.noaa.gov/sotc/summary-info/global/201412
http://www.bbc.com/news/science-environment-34772166
http://www.theguardian.com/environment/climate-consensus-97-per-cent/2015/nov/05/scientists-warned-the-president-about-global-warming-50-years-ago-today
http://www.carbonbrief.org/met-office-confirms-2014-among-hottest-years-on-record
” No global warming for 18 years 9 months.”
Linking to climate-Communist news sources does not impress.
Some tools to use when analysing the op above
How to Evaluate Resources
The CRAAP Test* is a useful guide to evaluating resources. CRAAP is an acronym for the general categories of criteria that can be used to evaluate information you find. Use the CRAAP Test to decide if information is appropriate for your research! See also Evaluating Information from a Citation
CRAAP
Questions to consider
Currency
When was the information published or last updated?
Have newer articles been published on your topic?
Are links or references to other sources up to date?
Is your topic in an area that changed rapidly, like technology or popular culture?
Relevance
Does the information answer your research question?
Does the information meet the stated requirements of the assignment?
Is the information too technical or too simplified for you to use?
Does the source add something new to your knowledge of the topic?
Authority
What are the author’s credentials?
Is the author affiliated with an educational institution or prominent organization?
Can you find information about the author from reference sources or the Internet?
Do other books or authors cite the author?
Accuracy
Are there statements you know to be false?
Are there errors in spelling, punctuation, or grammar?
Was the information reviewed by editors or subject experts before it was published?
What citations or references support the author’s claims?
What do other people have to say about the topic?
Purpose
Is the author’s purpose to sell, persuade, entertain, or inform?
Is there an obvious bias or prejudice?
Are alternative points of view presented?
Does the author omit important facts or data that might disprove the claim?
Does the author use strong or emotional language?
https://www.gettysburg.edu/library/research/tips/webeval/index.dot
Research Process Rubric – Middle School
https://www2.uwstout.edu/content/profdev/rubrics/middlelschresearchrubric.html
Asked and answered. Don’t be childishly repetitive. Linking to climate-Communist news sources and rent-seeking bureaucracies rather than to the data and to the learned journals is the action of a paid climate-Communist, not a seeker after truth.
FIRST Assement Report (FAR)
See http://www.skepticalscience.com/contary-to-contrarians-ipcc-temp-projections-accurate.html for a rather more complete representation of the science. As well as some denialist predictions.
“- is the word the IPCC itself used in 1990”
Is the paid climate-Communist website “skeptical” “science” peer reviewed? No. The IPCC predicted in 1990 what the head posting said it had predicted. It used the words “We predict”. It made its predictions on the basis of what it called “substantial confidence” that its models had captured all the major features of the climate. It was wrong. Its predictions were exaggerations – on all datasets the actual rate of warming in the quarter-century since 1990 is below the least estimate made by the IPCC in that year.
The way real science works, if predictions are made and they fail, it is not scientific to try to pretend they did not fail, or that no predictions were made.
Yup, you’ve shown us that the science has been getting better in each Assessment report. 25 years of progress,while you have to use rhetoric in your eforts to make your point.
The predictions have been reduced, but so has the observed warming rate. The discrepancy between prediction and reality remains enormous.
“..high-school silliness – and what can one expect from an overpaid 18-year-old climate-communist troll, starry-eyed in his uncritical belief in the Party Line ..”
So, a human trial – with one subject -for your cure?
“That is one of the reasons why, when I am ill as I am at present, I am prepared to take the time patiently to answer the trolls’ absurdities. “
Off topic and characteristically malevolent. I am not suffering from an infection, so my treatment for infections would not be a sensible treatment in the circumstances, now, would it? Don’t be childish.
Global warming has not happened as predicted. Deal with it.
http://www.skepticalscience.com/Monckton_Myths.htm
bbickmore.wordpress.com/lord-moncktons-rap-sheet/
One does not deal with the failure of global warming to occur at anything like the predicted rate by linking to external climate-Communist websites one of which is run by a crook and the other by a lunatic. Are these your “peer-reviewed sources”? Not surprising your brain seems to have been lobotomized, if these are your trusted “authorities”. Must try harder.
Pennies or maybe parts of one… if one is on the climdep site
“And every time any of us presses the “Post” button, Marc Morano makes another few dollars to keep the truth circulating.”
Dollars, not pennies. Keep on with the futile comments. They’re a great financial help.
Recommend
Hey, just noticed this! My CRAAP post is on top!
Sort by Best
Join the discussion…
Attach
Post as Robert
−
Avatar
Robert
2 days ago
Some tools to use when analysing the op above
How to Evaluate Resources
The CRAAP Test* is a useful guide to evaluating resources. CRAAP is an acronym for the general categories of criteria that can be used to evaluate information you find. Use the CRAAP Test to decide if information is appropriate for your research! See also Evaluating Information from a Citation
So M.M. is paying you?1
“They’re a great financial help.”
No. I’m paid $2,155,000 a year, plus expenses, by a group of governments tired of the hard-Left propaganda of the climate Communists. I’m worth much more, of course, but one must do one’s duty to the truth, however little one is paid.
Thanks! Posting that as a new thread!
Hmmm, a nice round 2 attached to what you claim I’m paid….
Oh, wait. Does that include expenses? According to you, I get 35K.
Oh, wait. Again. Is that b4 or after the recent Canadian election?
Oops! That was a mistake. I’m paid £20,155,000 a year by the Interplanetary High Council. Plus warp-drive supplement.
Ahh, more Ipse dixit… thanks.
“..commenting to me that they now understand my frustration at the level of robotic stupidity to which the hard, Communist Left …”
“overpaid 18-year-old climate-communist troll”
That’s really solid evidence…. /s
“Everyone knows you are paid. ”
https://disqus.com/home/discussion/climatedepot/no_global_warming_at_all_for_18_years_9_months_a_new_record_8211_the_pause_lengthens_again_just_in_t/#comment-2350717850
Well, it’s more solid than your evidence that you’re not paid $155,000 a year plus expenses to argue dishonestly and fraudulently against your betters on matters of which you plainly know nothing except the Party Line. I suggest that you complete high school before making any more attempts to intervene in matters where you are so gluggingly out of your depth.
The head posting is really quite simple, if only you will find the time to read it. There has been no global warming for 18 years 9 months. That is the inconvenient truth. There is no, repeat no, basis for alarm about our influence on the climate. The rate of warming in the quarter-century since 1990 is little more than a third of the IPCC’s then central estimate. And there are very good scientific reasons, in the laws of physics and in the models’ errors, why we should not expect to see much in the way of global warming over the remainder of this century – if ever. This is a dead scare, scientifically speaking.
Maybe, if you post the missing citations and some documentation of your cures, I’ll post a scan of my IRS returns
“…more solid than your…”
As you well know, every fact in the head posting is nailed down with a reference to the data. And I have already explained that my medical research is off topic and that no claims will be made unless and until the research is successfully concluded.
Ipse dixit.
Thanks!
So, trust you? O trust the ipcc and the major scientific organizations who agree with what the ipcc reports…
What a tough decision… /s
“..there is no, repeat no, basis for alarm about our influence on the climate.”
Only a totalitarian would parade a head-banging acceptance of the authority of the governing power without asking any of the right questions. A libertarian, on the other hand, would ask whether the IPCC and its supporters had been right in their earlier predictions before believing their later ones. He would notice the startling discrepancy between the IPCC’s predictions and the far less exciting observed reality, and he would do what most ordinary people are now doing: he would not worry about the IPCC’s credibility or my credibility: he would look at the data and make up his own mind. That you are incapable of doing this illustrates how much of a slave to your paymasters you have become. You are incapable of thinking for yourself. All you can do is parrot the Party Line and kowtow to the high priests of the New Superstition. Contemptible, really, but then what can one expect of one who is too abjectly cowardly to reveal who he is?
The “right questions”:
http://www.emich.edu/library/help/craap/
Don’t be boringly repetitive. You have cut and pasted references to the notion that the source of scientific information is relevant to determining its reliability. In logic and in the scientific method, however, the argument from appeal to authority has no place. The reason why what I write is heeded despite the relentless attempts of paid climate-Communist trolls to damage my reputation is that it is so self-evidently true. Until I began regularly checking to find out whether global warming was happening as predicted, no one had bothered to check. It is now known to all that global warming is not happening at the predicted rate (and has recently not been happening at all). Now, that fact has not become part of the common currency of the climate debate because of any “authority” from me as its source: for I merely provide the data so that anyone can easily verify it for himself – if he bothers to read the head posting before posting hundreds of childish and hilariously off-beam attempts at criticizing what has neither been read nor understood.
So get used to the fact that argument from appeal to authority is a logical fallacy exposed as such by Aristotle 2350 years ago in his Sophistical Refutations. Get used to the fact that the argument from consensus is also a logical fallacy. Both of these are central to totalitarian thinking, but they have no place in civilized scientific discourse. So don’t waste any more time trying to trash my reputation. My reputation is entirely unimportant. What is important is the truth, and those who have eyes to see and ears to hear and brains to check can look closely at my postings and see for themselves that, in saying that the world has not been warming at anything like the predicted rate, I am right.
“source of scientific information ”
Actually, the links to CRAAP are for readers reading your claims.
You know. The ones without quotes or citations.
Don’t be childish. The head posting is full of references, if only you would be bothered to read it. So your whining that there are no references is manifestly false – by which I mean that all of the large numbers now enjoying your self-humiliation can see that it is false, simply by doing what you have not done – looking at the head posting. And the dozens of links to the leftist nonsense about whether the “author” of a scientific work has “credentials” merely confirm the depth of your ignorance of how the scientific method works. I suggest you read al-Haytham, or Popper’s masterly Logik der Forschung. Then you will have some idea of the fatuous and pusillanimous absurdity of your present – and clingingly desperate – appeals to the supposed “authority” of non-peer-reviewed political statements by scientific advocacy groups.
Appeal to authority has no, repeat no, place in true science. Your continuing to advocate it and to practise it merely shows off the abyssal depth of your ignorance. But then, your climate-Communist paymasters do not pay you $155,000 a year plus expenses to wise up, or you’d become more skeptical and less crashingly naive.
Where is your rebuttal?
http://www.youtube.com/watch?v=fbW-aHvjOgM&feature=related
Read the head posting. Read the rebuttal at WattsUpWithThat.com.
And get back on topic. Everyone knows that because I have been effective in countering the fraudulent elements of the global-warming scam I have been made a target by environmental-Communist advocacy groups and paid hacks such as yourself.
Meanwhile, no global warming for 18 years 9 months.
Not a surprise, but neither address the question.
“Read the head posting. Read the rebuttal at WattsUpWith……”
What evidence do you have that you are not still beating your life partner?
“… your evidence that you’re not paid $155,000 a year..”
The world continues not to warm very much. That is a problem for those who decided, prematurely and often for political and financial rather than scientific reasons, that they would take the wrong side in this debate. One realizes how Robert must feel as he learns from these exchanges just how wrong is the Party Line to which his paymasters have devoted so much of their cash and he so much of his valueless time.
And the headline of the head posting?
“No global warming at all”
“The world continues not to warm very much.”
Not learned very much, have you? If you had bothered to read some of the sources in the head posting, you’d have learned that the temperature trend since the Holocene climate optimum or the Old Kingdom optimum or the Minoan optimum or the Roman optimum or the Medieval optimum is a downtrend; that the trend since the depth of the naturally-occurring little ice age has been an uptrend; and that the trend since the turn of the 20th century has been a small uptrend; and that the trend since February 1997 has been a zero trend. So, as you would know if you had ever performed a statistical calculation of any kind, the trend is sensitive to the starting and ending dates.
However, the IPCC made predictions in 1990 about the rate of warming that should be occurring by now. So it is legitimate to determine a trend since then to see whether the warming has kept pace with the IPCC’s predictions. It has not. It has fallen catastrophically short. Your childish refusal to read the references that establish this fact provides further evidence, if any were needed, that you are well-paid but actually useless climate-Communist hack, paid to troll here and on dozens of other sites. Your briefing from the climate-Communist advocacy group that pays you is to be so vile to all who question the Party Line that they are frightened into silence, so that none of the facts that I update month by month will gain any traction with the wider public.
Well, it isn’t working. Your pathetic style of “argument”, little better than grunting yah-boo, and supported by no evidence that any scientist would recognize as evidence, is achieving nothing except to make you a plaything for my personal amusement while I recover from a bout of illness. And you are earning Mr Morano thousands – soon tens of thousands – for that’s how the advertising contracts work. But do try to be entertaining, rather than screeching the same tired climate-Communist talking points over and over again.
And try to come to terms with the fact that, like it or not, the temperature records with the least incomplete coverage – the satellites for the troposphere and the ARGO buoys for the ocean – show no warming at all in the last decade or two. And that, like it or not, is not what the IPCC predicted. The IPCC was wrong, and it matters not how many scientific advocacy groups swear it was right: the graph of its own 1990 prediction is in the technical annex to the head posting, for all to see. And a direct comparison between the relevant portion of that graph and the actual outturn as measured by the satellites is also provided. So come on, grow up a little: you’ll soon be old enough to vote.
http://www.youtube.com/watch?v=fbW-aHvjOgM&feature=related
Off-topic retreads of a long-discredited climate-Communist hack.
No global warming for 18 years 9 months.
http://climate.nasa.gov/evidence/
http://www.metoffice.gov.uk/news/release/archive/2015/2014-global-temperature
http://www.ncdc.noaa.gov/sotc/summary-info/global/201412
http://www.bbc.com/news/science-environment-34772166
http://www.theguardian.com/environment/climate-consensus-97-per-cent/2015/nov/05/scientists-warned-the-president-about-global-warming-50-years-ago-today
http://www.carbonbrief.org/met-office-confirms-2014-among-hottest-years-on-record
” No global warming for 18 years 9 months.”
You are paid $155,000 a year, plus expenses. But you’re not worth it. For you do not understand the elementary statistics of the situation. The models say that the fastest warming following a forcing occurs immediately. But, despite one-third of the forcings since 1750 having occurred in just 18 years 9 months, there has been no global warming at all in response. So, where is your evidence for the countervailing natural forcings that have been strong enough to overwhelm the supposedly strong signal from CO2? And, if there were no countervailing natural forcings, do you accept that the forcing from CO2 cannot have been anything like as strong as the Holy Books of IPeCaC have tried to tell us? Or is it those darned Martians again with those ray-gun thingies? Do. The. Math.
https://www.youtube.com/watch?v=fbW-aHvjOgM&list=PL82yk73N8eoX-Xobr_TfHsWPfAIyI7VAP&index=17
Your article is Horse sheet. Satellites say it hasn’t warmed in
almost 20 years. Why are you a satellite data denier. Why are you an
Arctic Sea Ice Denier. Why are you a denier that Anatractica has been
gaining ice?…
Have you read Hansen, et. al 1981 yet? No. Why not?…..
BECAUSE YOU ARE A LAZY RACIST BEETCH of a DEMOKKKrat
“My repeated assertions ”
Thank you for the verification that is what you are doing.
” often hate-filled comments ..”
Examples?
Gone missing….
What
A
Surprise
Or a concerned citizen of the world.
The world that is currenttly in the middle of a rather uncontrolled experiment.
“… who but a paid troll would want to waste his time trying to disrupt these threads. “
The experiment has been run and the results are in: no global warming for 18 years 9 months, notwithstanding one-third of all anthropogenic forcings since 1750 having arisen over those 225 months. And that is bizarre, because you deny the possibiliity of any countervailing forcings that might have attenuated the warming, and the evolutionary profile of warming in response to a forcing, in the models, is quite clear: it is that the fastest warming in response to a forcing happens in the decade immediately following the forcing. The mismatch between prediction and reality, therefore, is grave.
https://www2.uwstout.edu/content/profdev/rubrics/middlelschresearchrubric.html
“What can be asserted without proof can be dismissed without proof. … ”
C. Hitchens .
Warming set to breach 1C threshold
By Matt McGrath
Environment correspondent, BBC News
http://www.bbc.cOm/news/science-environment-34763036
http://www.ipcc.ch/report/ar5/wg1/
http://climate.nasa.gov
Hitchens is no philosopher; still less is he a logician. The statement that a = a, for instance, is axiomatic. It is not susceptible of proof, for it is a matter of definition: thus, a := a. Likewise, the fundamental postulate of logic, not (P and not P), is axiomatic. It is also not susceptible of proof. It cannot, however, be dismissed without proof, any more than the fact that a quantity is equal to itself cannot be dismissed without proof,.
I have already answered you on McGrath’s statement, which, as I have carefully explained, has a starting date of 1750, since when, if the Hadcrut4 record since 1850 is right, there has been 0.9 degrees’ warming. Since 1990, however, which was the subject when you tried to divert matters with the reference to McGrath, there has been only 0.27 degrees’ warming, when the IPCC’s central estimate in 1990 was to the effect that there would have been 0.72 degrees’ warming from 1990 to the present – almost three times the warming that has actually occurred.
And another impression of Prof. Irwin Corey….
Oppps, you slipped up…
“… IPCC’s central estimate in 1990…”
Monckton is no scientist. http://www.desmogblog.com/christopher-monckton
Off topic. When I publish in the reviewed journals, the usual custom is that the reviewers don’t know who I am. if they pass a paper for publication, they are accepting that it does not appear to them to be contrary to science.
And the data I present in the head posting are the data, whether I or anyone else presents them. So do try to cure yourself of the habit of the paid climate-Communist trolls, which is to resort to argument from appeal to authority, a long-exposed logical fallacy from which no rational conclusion can rationally be drawn except that the perpetrator is an ignoramus.
You are among the most vile people on earth. https://www.youtube.com/watch?v=fbW-aHvjOgM&index=17&list=PL82yk73N8eoX-Xobr_TfHsWPfAIyI7VAP
Your article is Horse sheet. Satellites say it hasn’t warmed in
almost 20 years. Why are you a satellite data denier. Why are you an
Arctic Sea Ice Denier. Why are you a denier that Anatractica has been
gaining ice?…
Have you read Hansen, et. al 1981 yet? No. Why not?
BECAUSE YOU ARE A LAZY RACIST BEETCH of a DEMOKKKrat
Interesting that you link to an uninformed and more than usually ignorant commentary by a non-scientist. Seems you cannot cite peer-reviewed papers, and are forced back on to quoting fellow paid climate-Communist hacks. Meanwhile, back in the world of real science rather than ersatz totalitarianism, the world continues to fail to warm at anything like the predicted rate.
More BS from the known liar. https://www.youtube.com/watch?v=C3giRaGNTMA&index=20&list=PL82yk73N8eoX-Xobr_TfHsWPfAIyI7VAP
Another link to your fellow climate-Communist. How infantile. Just four more such links and we get another couple of grand from the site’s sponsors. Keep it up! You’re doing well. But no one pays any attention to you climate Communists anymore. You are so passe. For there has been no global warming for 18 years 9 months, and you just can’t handle that, can you, Mr anonymous paid climate-Communist coward?
You are a liar willing to do harm to others.
The emerging story of what Exxon knew, and when they knew it, shows that the differences have never really been about the science questions – even the major oil companies knew the basic science truths 4 decades ago. They simply made a moral decision that the lives of the next ten thousand generations of human beings were not as important as their own profits, and we are now witnessing the early impacts of that decision.
People like you are just immoral creatures with no values that are willing do people harm, even let people die, as long as there is profit to be made. These people are the most vile among us, with no motivation other than greed and profit.
http://www.realclimate.org/index.php/archives/2010/08/monckton-makes-it-up/
Don’t be childish. Exxon is off topic. I know the current version of the Party Line requires all climate-Communist trolls to bang on about it in return for their pay, but don’t waste our time with it.
Instead, concentrate on the head posting. Find in it a single falsehood, and then produce your evidence that it is anything other than an error. If not, it will be assumed by all that your accusation that I am a “liar” is, like much else that you have written here, posted purely because you are paid to post hate-speech and lack the wit or scientific knowledge to do anything other than call people names from behind your cowardly anonymity. The contempt that the world community has for such infantile and craven tactics is infinite.
The world is not warming at the predicted rate, now, is it? That would lead any rational mind to question whether the basis for the predictions is a sound basis. The answer: no, it isn’t.
https://www.youtube.com/watch?list=PL82yk73N8eoX-Xobr_TfHsWPfAIyI7VAP&v=fbW-aHvjOgM
Don’t be childish. Linking repeatedly to a failed hack’s paid presentation that has long since been utterly refuted does not reflect well on your credibility, and is off topic. Do try to grow up.
Hello criminal. It is your credibility in question. You are the one spreading lies and misinformation to some of the most ignorant people. I know the teaparty type of nuts love ignorance, but when you do the whole world harm by taking advantage of their ignorance, just for greed, that is crimes against humanity. Even Exxon knows your BS “science” is BS.
Don’t whine. To establish fraud on my part, you would need to demonstrate that the facts in the head posting are materially false when they are materially true and unusually well evidenced; that I had intended to deceive, an allegation against which the self-evident truth of the facts in the head posting is an absolute defense; and that I had intended by that deception to profit some or to occasion loss to others, an allegation against which the self-evident truth of the facts in the head posting is an absolute defense. So don’t make self-evidently petty and false allegations of criminality.
And my credibility does not matter. I am old enough and wealthy enough not to care. There are no lies in the head posting, and you know it. There are no misinformations in the head posting, and you know it.
And to allege a crime against humanity you must demonstrate that by publishing the facts in the head posting I am intending to kill people in the millions. And that allegation will not stand, either, for the self-evident truth of the carefully-researched and well-evidenced facts in the head posting is an absolute defense against any such allegation.
Get used to it: there really has been no global warming for 18 years 9 months. And that is a problem for the climate Communists – a problem they are addressing by paying people like you to try to disrupt these threads with your blubbing and wailing and hate-filled shrieking. It is entertaining to watch as you all wriggle more and more, month by inexorable month, as the doom you so profiteered by predicting has so manifestly failed to come to pass – as the head posting definitively establishes.
“…the Party Line requires all climate-Communist trolls to bang on about it in return for their pay, …”
http://ingeniouspursuits.blogspot.com
Don’t be childish. The method of calculation of the start-date for the Pause is clearly explained in the head posting. One starts at the present and works backward until it is no longer possible to find a zero trend. The spike of a sufficiently substantial el Nino could, on this method, make the Pause disappear, so that some rate of warming (albeit well below the predicted rate) will be evident. Do try to learn a little science.
http://ingeniouspursuits.blogspot.com
Asked and answered. This posting is a mere otiose repetition by a climate-Communist paid troll.
Meanwhile, the rate of warming since 1990, on all three longest-standing terrestrial datasets and on both satellite datasets, is below the IPCC’s least warming rate predicted in 1990. That will continue to be the case if the coming el Nino is followed by a la Nina.
http://www.skepticalscience.com/contary-to-contrarians-ipcc-temp-projections-accurate.html
“..predicted in 1990. “
And previously –
monckton, “No. I’m paid $2,155,000 a year, plus expenses, by a group of governments tired of the hard-Left propaganda of the climate Communists. I’m worth much more, of course, but one must do one’s duty to the truth, however little one is paid.”
https://disqus.com/home/discussion/climatedepot/no_global_warming_at_all_for_18_years_9_months_a_new_record_8211_the_pause_lengthens_again_just_in_t/#comment-2351081300
“climate-Communist paid troll.”
And previously –
monckton, “I’m paid £20,155,000 a year by the Interplanetary Climate Council.” Or, in plain English, my financial affairs are none of your business.
Then neither are mine, nor the others you were trying that meme on.
Especially when you are trying to use what your few denialist buddies would consider a position of authority to make those assertions.
“In other words, my financial affairs are none of your business.”
Off topic and wrong. I have not asked about your financial affairs. I know you are a paid climate-Communist troll, bringing about the destruction of the Left by clinging to the stupidities of the Party Line and handsomely compensated for trying to trash threads such as these. You have asked about my financial affairs and, after giving you the truthful answer that I am a successful inventor and investor, when you went on I told you I was paid by a group of government, and by the intergalactic climate council.
Meanwhile, back on topic, on all five of the longest-standing global datasets, temperature in the 25 years since 1990 has risen far more slowly than even the least IPCC prediction in that year.
Hmmm, let’s see. A namecalling, blotivating, blogger. Or every major scientific organization, 97% of the papers, a long history of published research,
.
I don’t need to argue the science, it is enough to show the idiocy of your claims:
monckton, “No. I’m paid $2,155,000 a year, plus expenses, by a group of governments tired of the hard-Left propaganda of the climate Communists. I’m worth much more, of course, but one must do one’s duty to the truth, however little one is paid.”
https://disqus.com/home/discussion/climatedepot/no_global_warming_at_all_for_18_years_9_months_a_new_record_8211_the_pause_lengthens_again_just_in_t/#comment-2351081300
monckton, “Only 0.5 degrees’ global warming is expected by 2100, using mainstream considerations. That’s not a cause worth any climate-Communist money. So they must have other, ulterior motives. And so – if your claim that are not paid is any less mendacious than anything else you claim – must you.”
https://disqus.com/home/discussion/climatedepot/no_global_warming_at_all_for_18_years_9_months_a_new_record_8211_the_pause_lengthens_again_just_in_t/#comment-2350818365
..monckton, “You take money from a climate-Communist advocacy group to disrupt these threads with your hate-speech. You were paid $122,000 last year alone to do this. ”
https://disqus.com/home/discussion/climatedepot/no_global_warming_at_all_for_18_years_9_months_a_new_record_8211_the_pause_lengthens_again_just_in_t/#comment-2349919377
“Environmentalist Socialism killed 50 million with the hideously msiconceived ban on DDT”
https://disqus.com/home/discussion/climatedepot/no_global_warming_at_all_for_18_years_9_months_a_new_record_8211_the_pause_lengthens_again_just_in_t/#comment-2351630909
“You are paid $155,000 a year, plus expenses.” “Holy Books of IPeCaC ”
https://disqus.com/home/discussion/climatedepot/no_global_warming_at_all_for_18_years_9_months_a_new_record_8211_the_pause_lengthens_again_just_in_t/#comment-2351100136
“Yes, yes, we know your climate-Communist paymasters have asked you to babble ignorantly about Exxon Mobil, but that case is going to be deeply damaging to the hard Left, for Exxon will simply reverse its present knock-kneed chief executive’s kowtowing to the Party Line and come out fighting, on the climate science, and on whether it is “certain”.”
https://disqus.com/home/discussion/climatedepot/no_global_warming_at_all_for_18_years_9_months_a_new_record_8211_the_pause_lengthens_again_just_in_t/#comment-2351842325
Robert monckton a day ago
“Environmentalist Socialism killed 50 million with the hideously msiconceived ban on DDT”
1 Edit View in discussion
Robert
Robert monckton a day ago
“paid climate-Communist trolls”
“climate-communist trolls paid to disrupt these threads”
1 Edit View in discussion
Robert
Robert monckton a day ago
“paid climate-Communist trolls”
1 Edit View in discussion
Robert
Robert monckton a day ago
“climate-Communist technique ”
“Never mind: we rapidly approach the trigger-point at which Climate Depot makes tens of thousands of dollars because the comments have been so numerous. ”
“climate-Communist advocacy groups pay you to be futile..”
“global warming has not at any point happened at the predicted rate..”
“You have no answer to that scientific fact.”
“… the predicted rate… ”
“the”
“predicted”
IPCC’s use of the words “We predict” is cited, with the page reference, in the head posting. Get over it.
I make it a rule to avoid Climate Depot since the execrable Morano deserves no pageviews, but I wanted to make sure that you know that Russell Seitz thinks you and your troupe are imbeciles. http://vvattsupwiththat.blogspot.com/2015/11/just-cut-along-dotted-error-bars.html
Ahhhh, it is to laugh, Better sick Rowlatt on Harvard.
Hilarious! 🙂
I think I met Seitz once. He seemed confused on scientific matters to do with the climate. And, in a free country, he is entitled to his opinion.
But the subject of the head posting is not Seitz or his amiably barmy opinions. It is the ineluctable fact that there has been no global warming for 18 years 9 months – a fact you are wholly unable to refute.
Oh, you’re always rubbing shoulders with America’s most eminent physicists. I sometimes think you are doing performance art as an imperious twit pretending he is unaware he is a laughingstock.
Don’t be a silly old cherrypicker, Rowlatt. You know your “trend” is meaningless.
Well, yes, I once gave a talk at Princeton, for instance, where Freeman Dyson and Will Happer were in the audience, By invitation, I attend the World Federation of Scientists’ annual conferences on planetary emergencies in Erice, Sicily, once a year. Of course I meet eminent physicists at such events. So what? I’m lucky.
And if the trends shown in the head posting are meaningless, why are so many paid climate-Communist trolls trying to disrupt the thread here? You are all scared, that’s why. The Party Line cannot be wrong, you have always believed, and yet it is visibly wrong.
If you are ever actually in the presence of practicing physicists, you’re lucky they don’t beat you about the head and shoulders for the damage your farcical impersonation of a scientifically literate person has done to science’s reputation.
Don’t whine.
Big “if” involved there….
Notice the string of logical fallacies it takes monckton to develop a rebuttal?
Chris Monckton, not a smarty.
Exxon is very much ON topic — liars who fund people like you.
From Mr Appell, no scientific point, as usual, and off topic, as usual, and wrong, as usual. One knows he is paid well to peddle his falsehoods, but he is not worth what he is paid. He is too relentlessly inept and ill-informed.
My check from Exxon Mobil failed to arrive again this month.
Paid well? What a coward.
He claims to earn 2155k from govts trying to overturn ACC… and, according to him, I earn 155k + expenses as a climate communist troll. He even named the company……..
He is also claiming that comments posted on disqus earns ClimDep’s M. Morano thousands…..
I think Monckton tries to escape responsibillity for his claims by couching them in apparent silliness.
Not what I would have expected for a so-called “Lord.” Not at all.
Yes, Davikins, you are a coward. You are paid well to troll here, and to accuse people of lying when you know they are not lying. And don’t whine if they bite back. I’m not holding my breath for an apology, because you’re too stupid and too downright evil to give me one. And, to put it bluntly, you’re too much of a lying, craven coward.
The world continues to warm, on all datasets, at a rate well below even the lower bound of the IPCC’s prediction interval in 1990. There is no wriggling out of that fact. In trying to deny it, you put yourself at odds with mainstream climate science, as well as with those who, like me, do not recognize the concept of “mainstream” science: we recognize only the concept of science in the search for truth.
Monckton, you look foolish when your only response it to lie that the other person is paid.
No one pays me at all. I enjoy proving you wrong all on my own time.
Asked and answered. You falsely accused me of lying and you got called out on it. Don’t blub. You’re paid very well by the climate Communists, so don’t try to lie about that as you have lied about everything else. You lied about the ARGO dataset. You lied about the HadSST dataset. You lied about the NOAA dataset. You lied to the effect that 700 m depth was a surface stratum. And now, why should anyone believe you when you say you’re not a paid climate-Communist troll like the rest who have been seen off one by one in this thread?
Monkie: Still no link to your claimed ARGO data.
Still.
Don’t be wet. Just put ARGO marine atlas into Google and press the Return key.
Monkey can’t provide the data to support his claims.
Monkey never can.
Read the head posting. Data are cited in detail. Don’t be silly.
What is the URL to the ARGO 0-10 m data? I honestly don’t know where to find it.
Monkey can’t provide any data.
Monkey doesn’t know how to use the data.
Monkey couldn’t calculate his way out of a paper bag.
Monkie: Meanswhile, it’s clear you lied about the HadSST3 data:
“HadSST3 is produced (a slightly more detailed description) by taking in-situ measurements of SST from ships and buoys….”
http://www.metoffice.gov.uk/hadobs/hadsst3/
Time to admit you were wrong.
Don’t be childish. This is already asked and answered. The purpose of the HadCRUT4 dataset is to combine the UEA’s land-surface air temperatures with the Hadley Centre’s sea-surface air temperatures, so as to produce a global air-temperature dataset. Now that you know that, how do you suppose the Hadley Centre obtains its sea-surface air temperatures? Well, they tell you right there on line 1 of the HadSST3 website: they get them from ships and buoys. How would you do it? Eh? Come on, man, for Heaven’s sake. Try thinking. You impress not even yourself by displaying so little knowledge, so little intellect, so little willingness to learn from one who, as you must have noticed by now, knows far more about these things than you.
Thanks Monkey, for confirming that “HadSST3 is produced (a slightly more detailed description) by taking in-situ measurements of SST from ships and buoys…”
http://www.metoffice.gov.uk/hadobs/hadsst3/
“You lied to the effect that 700 m depth was a surface stratum.”
Another lie, Monkie. I never said 0-700 m was a surface measurement. Any Monkey knows it isn’t….
Don’t lie. You must by now have realized it will do you no good. This thread is being archived, and you are about to go down in history as one of the stupidest and most wicked climate Communists of them all. And that will not be an enviable reputation.
You had accused me of lying when I had said the ARGO bathythermographs showed no warming of the surface strata. You made three successive failed attempts to dig yourself out. First, you said that HadSST3 showed warming, for you did not even realize that it does not measure ocean temperatures at all, but air temperatures at the ocean surface. Next, you said that NOAA showed warming, but that was not the ARGO dataset. Then you said that, nevertheless, NOAA down to a depth of 700 m showed warming. Maybe it did, but 700 m is not a surface stratum, now, is it? Come on, man, you’re making an idiot of yourself.
Monkey said this thread is being archived?
Great! The future will see what a toad he was.
Lying, Monkey wrote: “First, you said that HadSST3 showed warming, for you did not even realize that it does not measure ocean temperatures at all, but air temperatures at the ocean surface.”
False.
“HadSST3 is produced (a slightly more detailed description) by taking in-situ measurements of SST from ships and buoys…”
http://www.metoffice.gov.uk/hadobs/hadsst3/
“Next, you said that NOAA showed warming, but that was not the ARGO dataset.”
It’s an independent measure, Monkey.
NOAA’s 15-yr SST trend is +0.11 C/dec.
http://www.ncdc.noaa.gov/cmb-faq/anomalies.php
A monkey wrote: “Then you said that, nevertheless, NOAA down to a depth of 700 m showed warming.”
It does! And an even better signal of a global energy imbalance is the top half (0-2000 m) of the ocean, which shows an average warming rate of 325 trillion Watts since ARGO started monitoring this region.
“You’re paid very well by the climate Communists….”
Who pays the Monkey?
I am not aware what the science in the head posting has to do with whether monkeys are paid. As far as I know, they are not paid, because they cannot supply the banks with sufficient information to comply with the know-your-client regulations.
Monckton proved: “The world continues to warm, on all datasets, at a rate well below even the lower bound of the IPCC’s prediction interval in 1990.”
Prove it.
https://uploads.disquscdn.com/images/625d5a6271f649628edaab1c49a61ab2485d6ca5c0ca5d39725ac54eaffd21fb.jpg
Appell continues to wriggle like a stuck pig. He produces an unsourced graph using unidentified predictions and an unidentified global-temperature dataset, and the predictions and the data are not even zeroed to 1990. Does he know any statistics at all? Or is he just so desperate, having been slammed down time and time and time again, that he will make up any old drivel?
He asks for proof, rather than doing any checking for himself. So here goes. The IPCC’s central estimate, based on its graph showing 1.0 [0.7, 1.5] K near-linear warming from 1990-2025, shows 0.72 K warming to 2015 as its central estimate and 0.50 K warming to 2015 as its least estimate. The warming rates on the five longest-standing global datasets (three terrestrial, two satellite) from November 1990 to October 2015, a period of exactly 25 years, are as follows: 0.44 K for NCDC, 0.42 K for HadCRUT4, 0.20 K for NCEI/NCDC; 0.26 K for RSS, and 0.24 K for UAH. And that’s the proof. Not difficult, provided you know enough math to determine least-squares linear-regression trends quickly.
Unsourced, Monkey? Do you really not know of Hansen’s famous 1981 paper. Shame on you for pretending to be an informed participant.
Don’t be childish. I read several hundred scientific papers a year and do not recall every detail of every diagram. And you continue to be unable to say where the temperature record added to Hansen’s Fig. 6 came from, inferentially because you do not know.
You can’t source your claim. Noted.
You must be talking of Fig. 6. But you have still not said where the “recorded observations” came from, nor why they were not zeroed to 1990, given that at the time when you first used Hansen’s graph you were accusing me of lying because you said global temperatures were following the predicted path.
Clearly the data isn’t zeroed at 1990.
Learn to read, and you won’t need to lie so much.
You are a non-scientist buddy. https://www.youtube.com/watch?v=fbW-aHvjOgM&index=17&list=PL82yk73N8eoX-Xobr_TfHsWPfAIyI7VAP
You have now linked to the same tired series by the same sniveling climate-Communist at least ten times. Excellent! Keep ’em coming. The traffic data you are generating for the Climate Depot site is most welcome, for it greatly increases our income – I mean greatly, because that is how the advertising contracts work.
Besides, otiose repetition – an unfailing hallmark of the minuscule mind – is also an indication that you have run out of arguments against the truth expressed in the head posting, which is that there has been no global warming for 18 years 9 months; that the IPCC did not predict that, as it has itself admitted in admitting that 111 of 114 models over-predicted the warming rate; and that the scare is over. You’re flogging a dead horse. And that’s a real waste of time. Do you suppose that your climate-Communist paymasters, when they realize just how incompetent you have been on this thread, will continue paying you $95,000 a year for this rubbish?
Will do. The public certainly needs to see what a filthy human being you are.
The emerging story of what Exxon knew, and when they knew it, shows that the differences have never really been about the science questions – even the major oil companies knew the basic science truths 4 decades ago. They simply made a moral decision that the lives of the next ten thousand generations of human beings were not as important as their own profits, and we are now witnessing the early impacts of that decision.
The deniers are just immoral creatures with no values that are willing do people harm, even let people die, as long as there is profit to be made. These people are the most vile among us, with no motivation other than greed and profit.
https://www.youtube.com/watch?v=PTY3FnsFZ7Q&list=PL82yk73N8eoX-Xobr_TfHsWPfAIyI7VAP&index=18
Meet Climate Depot everybody, a.k.a. The Rush Limbaugh Show.
http://www.exposethebastards.com/who_is_marc_morano
http://www.desmogblog.com/marc-morano
https://en.wikipedia.org/wiki/Marc_Morano
Another funny, …..”The traffic data you are generating for the Climate Depot site is most welcome, for it greatly increases our income – I mean greatly, because that is how the advertising contracts work.”
Especially when posting from the disqus site…..
Monckton wrote, “which is that there has been no global warming for 18 years 9 months”
What an absolute lie. Why do you ignore ocean warming, where 90+% of the trapped heat goes?
“Dear, cute Appell of my eye,” says Nanny in that soothing tone she uses when little Davikins loses his little temper and starts throwing all of his nice toys out of the stroller, “How many times have I told you that, unlike you, I’m not dim. So you only need to say things once. And you don’t need to be so rude about that nice Lord Monckton who is always so gentlemanly and polite when he runs into you. Tut, tut, I’d hoped I’d brought you up better than that.
“You see, ikkle Davy-wavy, the ARGO bathythermograph buoys don’t just measure the temperature of a slab of ocean a mile and a quarter deep. They do what is called a “temperature profile”, layer by layer. And the top layers, where you splash about and swim when I put your little red water-wings on, have not warmed at all in the entire 11-year record. The deeper layers have warmed a little – but only by enough to raise the ocean temperature by 1 degree every 430 years. And the point is, Davy-diddle-dum-dum, that the warming is not coming from above, so that the upper layers warm first and fastest. It’s coming from below.
“So why don’t you have a little fun tomorrow and do a transect of the eastern Pacific mid-ocean divergence boundary using the USGS seismic data, and see if you can’t find a little correlation between increased subsea seismic activity in the past decade and increased ocean temperature around a mile to a mile and a quarter down. You might get a nice little surprise, and find out that the tiny warming of the ocean is volcanic, not anthropogenic. Or you might not. But the point is, Davy-wavy-woo, that at least you’ll have tried to do some real scientific research all by yourself, rather than leaving it to that nice Lord Monckton, who is admittedly awfully good at it.”
Wow. Are you ever afraid of discussing science.
Well, the science is explained in the plainest terms, with all necessary references, in the head posting, which you have neither read nor understood. So, once you had falsely accused me of lying, I translated the science into very, very simple language and put it in the mouth of your Nanny, since that might have been easier for you to understand. If you don’t know that the eastern Pacific mid-ocean divergence boundary is a scientific term, or that the ARGO buoys are scientific instruments that produce scientific data, or that seismometers are scientific instruments producing scientific data, then don’t pretend to talk about science. All of these scientific concepts are discussed, in some detail, int the posting to which you are replying. So don’t lie. You can see, perfectly well, that I was discussing science. You don’t like that fact, because the science does not support the climate-Communist party line to which you adhere. Well, tough luck. You face a straightforward choice: go on lying and being caught out, just like the other paid climate-Communist trolls here, or abandon the Party Line, free yourself to think for yourself, and check out the science that I have explained to you, before stupidly saying I’m afraid of discussing science. You’re dim, but even you can’t be that dim. You’ll know, in future, not to accuse people of lying when you know they’re not. They tend to bite back, and their teeth, like their minds, are a whole lot sharper than yours.
Monkie: You lied about sea surface temperatures, as HadSST3 shows.
It’s really that simple.
Don’t be pathetic. I mentioned the temperatures of the surface strata of the ocean. Sea surface temperature are air temperatures. I have already explained the difference between the sea and the air to you. The ocean temperatures are measured by ARGO, about which I was talking (hint: I said I was talking about the ARGO buoys measuring the surface strata of the ocean). But you were not aware that HadSST measures sea surface air temperatures, not the temperatures of the upper strata of the ocean itself. You were, and remain, staggeringly ignorant. if you cannot even grasp the distinction between air and water, between bathythermographs and thermometers, but are prepared to drivel on, the climate-Communist advocacy group that employs you must be paying you very handsomely.
Monkey wrote: “Sea surface temperature are air temperatures.”
False, Monkey.
“HadSST3 is produced (a slightly more detailed description) by taking in-situ measurements of SST from ships and buoys….”
http://www.metoffice.gov.uk/hadobs/hadsst3/
Don’t be childish. I’ve answered this in detail five times before. The buoys and ships are measuring air temperature: ARGO measures sea temperatures.
False. What does “In Situ” mean??
“HadSST3 is produced (a slightly more detailed description) by taking in-situ measurements of SST from ships and buoys…”
http://www.metoffice.gov.uk/hadobs/hadsst3/
Link to your evidence? Data? Graph?
You can’t provide any of this.
“paid climate-Communist trolls”
Who cares… Niether are you
Your article is Horse sheet. Satellites say it hasn’t warmed in
almost 20 years. Why are you a satellite data denier. Why are you an
Arctic Sea Ice Denier. Why are you a denier that Anatractica has been
gaining ice?…
Have you read Hansen, et. al 1981 yet? No. Why not?
BECAUSE YOU ARE A LAZY RACIST BEETCH of a DEMOKKKrat
More BS. http://dialoguesonglobalwarming.blogspot.com/2015/05/wuwt-and-monckton-caught-lying.html
Your article is Horse sheet. Satellites say it hasn’t warmed in
almost 20 years. Why are you a satellite data denier. Why are you an
Arctic Sea Ice Denier. Why are you a denier that Anatractica has been
gaining ice?…
Have you read Hansen, et. al 1981 yet? No. Why not?
BECAUSE YOU ARE A LAZY RACIST BEETCH of a DEMOKKKrat…….
Uh huh, Even Google says you are just a bunch of liars, hurting our children and our grandchildren and making the world a much worse place.
Google’s chairman, Eric Schmidt…
“The facts of climate change are not in question anymore. Everyone understands climate change is occurring, and the people who oppose it are really hurting our children and our grandchildren and making the world a much worse place. And so we should not be aligned with such people — they’re just, they’re just literally lying.”
http://www.theguardian.com/environment/2014/sep/23/google-to-cut-ties-with-rightwing-lobby-group-over-climate-change-lies
Your claims….
“That is off topic. ”
.” That you are paid sums of that order is undeniable – ”
And previously –
monckton, “No. I’m paid $2,155,000 a year, plus expenses, by a group of governments tired of the hard-Left propaganda of the climate Communists. I’m worth much more, of course, but one must do one’s duty to the truth, however little one is paid.”
https://disqus.com/home/discussion/climatedepot/no_global_warming_at_all_for_18_years_9_months_a_new_record_8211_the_pause_lengthens_again_just_in_t/#comment-2351081300
Not previously. Subsequently. And after that I said I was paid £20,155,000 by the Interplanetary Climate Council. In other words, my financial affairs are none of your business.
Stick to the topic. No global warming for 18 years 9 months.
Then neither are mine, nor the others you were trying that meme on.
Especially when you are trying to use what your few denialist buddies would consider a position of authority to make those assertions.
“In other words, my financial affairs are none of your business.”
I am not paid. You are – by a climate-Communist advocacy group. That is why you spend so much time disrupting threads like this with your remarkably stupid comments. But you are a good advertisement for climate Communism: full of hatred, spite, and unreason. So enjoy your £155,000 a year being paid to lie from behind a cowardly curtain of craven anonymnity.
So, basic lying on your part. With two examples in one sentence. Thanks for hiliting the level of honesty that it takes to be a denialist.
“I am not paid. You are – by a climate-Communist advocacy group. ”
Also noted is the rhetoric and logical fallacies. Another excellent example of what it take to carry water for the denialist advocacy blogs.
Off topic and wrong.
Some tools to use when analysing the op above
How to Evaluate Resources
The CRAAP Test* is a useful guide to evaluating resources. CRAAP is an acronym for the general categories of criteria that can be used to evaluate information you find. Use the CRAAP Test to decide if information is appropriate for your research! See also Evaluating Information from a Citation
CRAAP
Questions to consider
Currency
When was the information published or last updated?
Have newer articles been published on your topic?
Are links or references to other sources up to date?
Is your topic in an area that changed rapidly, like technology or popular culture?
Relevance
Does the information answer your research question?
Does the information meet the stated requirements of the assignment?
Is the information too technical or too simplified for you to use?
Does the source add something new to your knowledge of the topic?
Authority
What are the author’s credentials?
Is the author affiliated with an educational institution or prominent organization?
Can you find information about the author from reference sources or the Internet?
Do other books or authors cite the author?
Accuracy
Are there statements you know to be false?
Are there errors in spelling, punctuation, or grammar?
Was the information reviewed by editors or subject experts before it was published?
What citations or references support the author’s claims?
What do other people have to say about the topic?
Purpose
Is the author’s purpose to sell, persuade, entertain, or inform?
Is there an obvious bias or prejudice?
Are alternative points of view presented?
Does the author omit important facts or data that might disprove the claim?
Does the author use strong or emotional language?
https://www.gettysburg.edu/library/research/tips/webeval/index.dot
Research Process Rubric – Middle School
https://www2.uwstout.edu/content/profdev/rubrics/middlelschresearchrubric.html
Then neither are mine, nor the others you were trying that meme on.
Especially when you are trying to use what your few denialist buddies would consider a position of authority to make those assertions.
“In other words, my financial affairs are none of your business.”
Repetitive, asked and answered, off topic and wrong. You are a handsomely-paid climate Communist with a mission to disrupt threads like these and bully those who might otherwise speak out and express their contempt for the Party Line you espouse.
Fyi:
https://disqus.com/home/discussion/pbsnewshourformsrodeo/has_exxon_mobil_mislead_the_public_about_its_climate_change_research/#comment-2355657106
monckton, “No. I’m paid $2,155,000 a year, plus expenses, by a group of governments tired of the hard-Left propaganda of the climate Communists. I’m worth much more, of course, but one must do one’s duty to the truth, however little one is paid.”
https://disqus.com/home/discussion/climatedepot/no_global_warming_at_all_for_18_years_9_months_a_new_record_8211_the_pause_lengthens_again_just_in_t/#comment-2351081300
dont waste time with jmac…
He thought it was earth shattering evidence when an Exxon scientist said they knew from the beginning that the ocean absorbs CO2…. Cold water even more….
Can you believe Exxon has been hiding this information that I learned in first year chemistry for so long?
The Party Line says Exxon is wicked, so of course jmac’s failure to learn elementary oceanic chemistry at his kindergarten is Exxon’s fault. After next week’s raffia class, he’s going to learn about how Exxon tried to cover up the existence of Henry’s law of relative partial pressures.
But it is necessary to take on these paid bullies from time to time, so as to keep alive the freedom of others to exercise their right to comment without being subjected to hate speech. These creatures are now banned from more and more websites because they act in breach of the rule that one should not – as they do to me – make personal hate-speech comments unless one is prepared to admit who one is. But these people are cowards. So I call them out as the cowards and craven climate-Communists they are, and I reveal that they are paid to disrupt threads such as this, and gradually those websites that have not yet banned them are telling them that if they cannot conduct a serious scientific conversation they must either reveal who they are or go elsewhere.
Some of them will be prosecuted when the international public authorities finally move in on the quite small number of people behind the fraudulent aspects of climate science and economics. For they have taken money to further the series of connected but now collapsing frauds by which the scare is falsely perpetuated. Their prison sentences will be long, because the death and damage caused by these frauds are very serious.
I dont share your optimism. No confidence in any international authorities.
I meant to say the national authorities in many countries. I am not particularly confident that they will act as they should, but they will certainly not act unless the evidence is meticulously marshaled and then put before them by way of an interlocking series of criminal complaints. It’s a tedious process, but someone’s got to do it or this scam will kill millions by denying them affordable electricity and gasoline.
ExxonMobil gave millions to climate-denying lawmakers despite pledge
Under pressure from shareholders, company promised eight years ago to stop funding climate denial – but financial and tax records tell a different story
““In 2008 we will discontinue contributions to several public policy groups whose position on climate change could divert attention from the important discussion on how the world will secure energy required for economic growth in an environmentally responsible manner,” Exxon said in its 2007 Corporate Citizenship report.”
http://www.theguardian.com/environment/2015/jul/15/exxon-mobil-gave-millions-climate-denying-lawmakers
Your article is Horse sheet. Satellites say it hasn’t warmed in
almost 20 years. Why are you a satellite data denier. Why are you an
Arctic Sea Ice Denier. Why are you a denier that Anatractica has been
gaining ice?
Have you read Hansen, et. al 1981 yet? No. Why not?
BECAUSE YOU ARE A LAZY RACIST BEETCH of a DEMOKKKrat
monckton is BS. https://www.youtube.com/watch?v=C3giRaGNTMA&list=PL82yk73N8eoX-Xobr_TfHsWPfAIyI7VAP&index=20
Off topic.
Your article is Horse sheet…. Satellites say it hasn’t warmed in
almost 20 years. Why are you a satellite data denier. Why are you an
Arctic Sea Ice Denier. Why are you a denier that Anatractica has been
gaining ice?…
Have you read Hansen, et. al 1981 yet? No. Why not?
BECAUSE YOU ARE A LAZY RACIST BEETCH of a DEMOKKKrat
Even Google says you are just a bunch of liars, hurting our children and our grandchildren and making the world a much worse place.
Google’s chairman, Eric Schmidt…
“The facts of climate change are not in question anymore. Everyone understands climate change is occurring, and the people who oppose it are really hurting our children and our grandchildren and making the world a much worse place. And so we should not be aligned with such people — they’re just, they’re just literally lying.”
http://www.theguardian.com/environment/2014/sep/23/google-to-cut-ties-with-rightwing-lobby-group-over-climate-change-lies
Of course you don’t. 🙂
Your article is Horse sheet. Satellites say it hasn’t warmed in
almost 20 years. Why are you a satellite data denier. Why are you an
Arctic Sea Ice Denier. Why are you a denier that Anatractica has been
gaining ice?
Have you read Hansen, et. al 1981 yet? No. Why not?
BECAUSE YOU ARE A LAZY RACIST BEETCH of a DEMOKKKrat..
https://www.youtube.com/watch?v=C3giRaGNTMA&list=PL82yk73N8eoX-Xobr_TfHsWPfAIyI7VAP&index=20
Your article is Horse sheet. Satellites say it hasn’t warmed in
almost 20 years….. Why are you a satellite data denier. Why are you an
Arctic Sea Ice Denier. Why are you a denier that Anatractica has been
gaining ice?…
Have you read Hansen, et. al 1981 yet? No. Why not?
BECAUSE YOU ARE A LAZY RACIST BEETCH of a DEMOKKKrat
monckton and you are among the most vile people on the planets. https://www.youtube.com/watch?v=C3giRaGNTMA&index=20&list=PL82yk73N8eoX-Xobr_TfHsWPfAIyI7VAP
Your article is Horse sheet. Satellites say it hasn’t warmed in
almost 20 years. Why are you a satellite data denier. Why are you an
Arctic Sea Ice Denier. Why are you a denier that Anatractica has been
gaining ice?…
Have you read Hansen, et. al 1981 yet? No. Why not?
BECAUSE YOU ARE A LAZY RACIST BEYOTTCH of a DEMOKKKrat.!!!
Your article is Horse sheet. Satellites say it hasn’t warmed in
almost 20 years. Why are you a satellite data denier. Why are you an
Arctic Sea Ice Denier. Why are you a denier that Anatractica has been
gaining ice?…
Have you read Hansen, et. al 1981 yet??? No. Why not?
BECAUSE YOU ARE A LAZY RACIST BEYOTTCH of a DEMOKKKrat.
Your article is Horse sheet……. Satellites say it hasn’t warmed in
almost 20 years. Why are you a satellite data denier. Why are you an
Arctic Sea Ice Denier. Why are you a denier that Anatractica has been
gaining ice?…
Have you read Hansen, et. al 1981 yet? No. Why not?
BECAUSE YOU ARE A LAZY RACIST BEETCH of a DEMOKKKrat
Monckton and apparently you are serial killers for the fossil fuels. Even Exxon knows it.
https://www.youtube.com/watch?v=fbW-aHvjOgM&index=17&list=PL82yk73N8eoX-Xobr_TfHsWPfAIyI7VAP
Your article is Horse sheet. Satellites say it hasn’t warmed in
almost 20 years. Why are you a satellite data denier. Why are you an
Arctic Sea Ice Denier. Why are you a denier that Anatractica has been
gaining ice?…
Have you read Hansen, et. al 1981 yet??? No. Why not?
BECAUSE YOU ARE A LAZY RACIST BEYOTTCH of a DEMOKKKrat..
Your article is Horse sheet. Satellites say it hasn’t warmed in
almost 20 years. Why are you a satellite data denier. Why are you an
Arctic Sea Ice Denier. Why are you a denier that Anatractica has been
gaining ice?…
Have you read Hansen, et. al 1981 yet??? No. Why not?
BECAUSE YOU ARE A LAZY RACIST BEYOTTCH of a DEMOKKKrat.!!!!
All your BS has been debunked before. https://www.youtube.com/watch?v=fbW-aHvjOgM&index=17&list=PL82yk73N8eoX-Xobr_TfHsWPfAIyI7VAP
Even Exxon knows your BS is just BS. Apparently far right wingers and their think tanks like the Heartland Institute think it is ok for a company or anyone to knowingly sell a product that they know can do harm (even cause death) to you and your friends. And use profits made from said product, to sponsor disinformation about the peer reviewed science warnings about the dangers of the product. They call that capitalism, especially when they get to have society pay for the damage done. The deniers are just immoral people with no values, that are willing do people harm, even let them die, as long as there is profit to be made. These people are the most vile among us, with no motivation other than greed and profit.
As Croasdale’s team was closely studying the impact of climate change on the company’s operations, Exxon and its worldwide affiliates were crafting a public policy position that sought to downplay the certainty of global warming.
http://graphics.latimes.com/exxon-arctic/
Your article is Horse sheet. Satellites say it hasn’t warmed in
almost 20 years. Why are you a satellite data denier. Why are you an
Arctic Sea Ice Denier. Why are you a denier that Anatractica has been
gaining ice?…
Have you read Hansen, et. al 1981 yet??? No. Why not?
BECAUSE YOU ARE A LAZY RACIST BEYOTTCH of a DEMOKKKrat.
Same question, same answer. BS is BS and even Exxon knows it. https://www.youtube.com/watch?v=fbW-aHvjOgM&index=17&list=PL82yk73N8eoX-Xobr_TfHsWPfAIyI7VAP
Uh huh, Apparently far right wingers and their think tanks like the Heartland Institute think it is ok for a company or anyone to knowingly sell a product that they know can do harm (even cause death) to you and your friends. And use profits made from said product, to sponsor disinformation about the peer reviewed science warnings about the dangers of the product. They call that capitalism, especially when they get to have society pay for the damage done. The deniers are just immoral people with no values, that are willing do people harm, even let them die, as long as there is profit to be made. These people are the most vile among us, with no motivation other than greed and profit.
As Croasdale’s team was closely studying the impact of climate change on the company’s operations, Exxon and its worldwide affiliates were crafting a public policy position that sought to downplay the certainty of global warming.
http://graphics.latimes.com/exxon-arctic/
Your article is Horse sheet. Satellites say it hasn’t warmed in
almost 20 years. Why are you a satellite data denier. Why are you an
Arctic Sea Ice Denier. Why are you a denier that Anatractica has been
gaining ice?…
Have you read Hansen, et. al 1981 yet? No. Why not???!?
BECAUSE YOU ARE A LAZY RACIST BEETCH of a DEMOKKKrat
Your article is Horse sheet. Satellites say it hasn’t warmed in
almost 20 years. Why are you a satellite data denier. Why are you an
Arctic Sea Ice Denier. Why are you a denier that Anatractica has been
gaining ice?…
Have you read Hansen, et. al 1981 yet? No. Why not?
BECAUSE YOU ARE A LAZY RACIST BEETCH of a DEMOKKKrat!!??
Your article is Horse sheet. Satellites say it hasn’t warmed in
almost 20 years. Why are you a satellite data denier. Why are you an
Arctic Sea Ice Denier. Why are you a denier that Anatractica has been
gaining ice?…
Have you read Hansen, et. al 1981 yet? No. Why not?
BECAUSE YOU ARE A LAZY RACIST BEETCH of a DEMOKKKrat!!@@
Your article is Horse sheet. Satellites say it hasn’t warmed in
almost 20 years. Why are you a satellite data denier. Why are you an
Arctic Sea Ice Denier. Why are you a denier that Anatractica has been
gaining ice?…
Have you read Hansen, et. al 1981 yet? No. Why not?
BECAUSE YOU ARE A LAZY RACIST BEETCH of a DEMOKKKrat!!!???
Your article is Horse sheet. Satellites say it hasn’t warmed in
almost 20 years. Why are you a satellite data denier. Why are you an
Arctic Sea Ice Denier. Why are you a denier that Anatractica has been
gaining ice?…
Have you read Hansen, et. al 1981 yet? No. Why not?
BECAUSE YOU ARE A LAZY RACIST BEETCH of a DEMOKKKrat!!!%%%
Your article is Horse sheet. Satellites say it hasn’t warmed in
almost 20 years. Why are you a satellite data denier. Why are you an
Arctic Sea Ice Denier. Why are you a denier that Anatractica has been
gaining ice?…
Have you read Hansen, et. al 1981 yet? No. Why not?
BECAUSE YOU ARE A LAZY RACIST BEETCH of a DEMOKKKrat!!!?@?@?
Your article is Horse sheet. Satellites say it hasn’t warmed in
almost 20 years. Why are you a satellite data denier. Why are you an
Arctic Sea Ice Denier. Why are you a denier that Anatractica has been
gaining ice?…
Have you read Hansen, et. al 1981 yet? No. Why not?
BECAUSE YOU ARE A LAZY RACIST BEETCH of a DEMOKKKrat!!!@##
?????
In an effort to deceive the public about the reality of global warming, ExxonMobil has underwritten the most sophisticated and most successful disinformation campaign since the tobacco industry misled the public about the scientific evidence linking smoking to lung cancer and heart disease.
As this report documents, the two disinformation campaigns are strikingly similar. ExxonMobil has drawn upon the tactics and even some of the organizations and actors involved in the callous disinformation campaign the tobacco industry waged for 40 years.
http://www.ucsusa.org/sites/default/files/legacy/assets/documents/global_warming/exxon_report.pdf
Your article is Horse sheet. Satellites say it hasn’t warmed in
almost 20 years. Why are you a satellite data denier. Why are you an
Arctic Sea Ice Denier. Why are you a denier that Anatractica has been
gaining ice?
Have you read Hansen, et. al 1981 yet? No. Why not?
BECAUSE YOU ARE A LAZY RACIST BEETCH of a DEMOKKKrat….
https://www.youtube.com/watch?v=fpF48b6Lsbo&index=19&list=PL82yk73N8eoX-Xobr_TfHsWPfAIyI7VAP
Off topic. The question in the head posting was how much global warming had occurred in the past 18 years 9 months. Answer: none.
One realizes that the paid climate-Communist trolls have received instructions to peddle the anti-Exxon line for the sake of making the NY climate-Communist attorney-general’s pantomime “investigation” of Exxon appear credible rather than sourly political. But it won’t work. If he tries to prosecute Exxon, they’ll dump Tillerson, reassert their previous position that global warming is not dangerous, and fight the AG in court on the science. And they’ll win.
The reason why the AG backed off against Peabody is that they remained firm that the science had been wildly exaggerated, and he knew that was true – just as the climate-communist trolls paid to disrupt these threads know it’s true. Well, the AG had better be careful that he does not, in thus abusing his office, lay himself open to charges under the RICO statute.
monckton and his lies. https://www.youtube.com/watch?v=fbW-aHvjOgM&index=17&list=PL82yk73N8eoX-Xobr_TfHsWPfAIyI7VAP
You have already posted this link to a fellow climate-Communist’s snide but inept and uninformed attempts at refuting true science, so why do so again? Inferentially because the climate-Communist technique is to set up a few hate-speech sites against those whom they find effective in pointing out the collapse of the Party Line, and then link endlessly to them in the hope that this will a) damage my reputation; and b) deter others from daring to challenge the Party Line.
Well, it’s costing a lot, but it isn’t working. The world continues not to warm at anything like the predicted rate. So what’s the point in flogging the dead horse global warming? Particularly as a fraud charge is waiting for the likes of you. Stick to science, and try to get it right, rather than citing non-scientists’ incompetent attempts at denying the truth that global warming has not at any point happened at the predicted rate; is not happening at the predicted rate; and is not going to happen at the predicted rate. Those are the points made in the head posting: those are the points that are on topic here; those are the points that you have embarrassingly failed to address.
And you are posting your links to hate-speech websites from behind a cowardly curtain of anonymity. Never mind: we rapidly approach the trigger-point at which Climate Depot makes tens of thousands of dollars because the comments have been so numerous. So carry on with your silly postings: the world is laughing at you – or, at least, at climate Communism for being so cowardly as to advance its failed and cruel cause via ill-educated, anonymous poltroons like yourself, whoever you are. And you cannot even legitimately complain that I am making personal remarks, because you have not revealed who you are. So, have the courage to come out of the shabby closet you inhabit, tell us who you are, where you live, what your qualifications are (if any), what your job is, and exactly how much the climate-Communist advocacy groups pay you to be futile, silly and ignorant here, displaying not only no knowledge of climate science but not the slightest interest in learning any.
You are a liar that is stump broke for the fossil fuel boys.
https://www.youtube.com/watch?v=PTY3FnsFZ7Q&list=PL82yk73N8eoX-Xobr_TfHsWPfAIyI7VAP&index=18
Don’t be childish. Don’t be repetitive. Don’t be full of hate-speech. Don’t lie. But do, if you want, go on linking to outdated, ill-informed commentaries by your fellow non-scientist climate-Communist paid trolls. That adds to the usage statistics and, because of the extraordinary length of the present thread, to Climate Depot’s revenues. Keep it up. You convince no one but yourselves., There’s a whole wide world out there laughing at you as global temperature continues to fall.
ExxonMobil gave millions to climate-denying lawmakers despite pledge
Under pressure from shareholders, company promised eight years ago to stop funding climate denial – but financial and tax records tell a different story
http://www.theguardian.com/environment/2015/jul/15/exxon-mobil-gave-millions-climate-denying-lawmakers
https://www.youtube.com/watch?v=fbW-aHvjOgM&list=PL82yk73N8eoX-Xobr_TfHsWPfAIyI7VAP&index=17
Meet Climate Depot everybody, aka The Rush Limbaugh Show.
http://www.exposethebastards.com/who_is_marc_morano
http://mediamatters.org/blog/2012/11/28/meet-the-climate-denial-machine/191545#morano
“…climate-Communist paid trolls.”
“climate-Communist technique ”
“Never mind: we rapidly approach the trigger-point at which Climate Depot makes tens of thousands of dollars because the comments have been so numerous. ”
“climate-Communist advocacy groups pay you to be futile..”
“global warming has not at any point happened at the predicted rate..”
“paid climate-Communist trolls”
“climate-communist trolls paid to disrupt these threads”
Monckton wrote: “The question in the head posting was how much global warming had occurred in the past 18 years 9 months. Answer: none.”
Of course, you dare not mention the large amount of warming in the ocean, where 90+% of the GHG-trapped heat goes.
Why is that, “Lord” Monckton?
“Now, look here, Davikins”, says Nanny, “Though you are the Appell of my eye, you don’t know anything more about the peerage than you do about global warming, and you know nothing at all about global warming. So don’t be rude to that nice Lord Monckton. And I’ve told you before and I’ll tell you again, don’t repeat yourself. You see, unlike you, Davy-wavy-woo, Lord Monckton is a grown-up, and he understands things first time around. He’s clever that way.
“You’ve already mentioned the oceans twice and he’s answered you twice. So don’t keep on whining about the oceans like a spoiled brat. They’re warming at only 1 degree every 430 years, and the surface layers, like your paddling-pool, are not warming at all. So say sorry to Lord Monckton. You only need say it once.”
False, Monckton. See the HadSST3 data I posted above. Or are you allergic to data?
Let’s be blunt. You’re hopelessly out of your league, and too small-minded and stupid to realize it. You accused me of lying when I said the ARGO data showed no warming of the upper strata of the ocean. In fact, the ARGO data show no warming of the upper strata of the ocean. I was telling the truth. Instead of admitting it and apologizing, you tried to change the subject by waffling about a completely different dataset that does not measure ocean temperatures: it measures the temperatures of the air at the sea surface. And it is at odds with both the satellite datasets, which measure lower-troposphere temperatures. And they show no warming for 18 years 6 months and 18 years 9 months respectively. And elementary theory dictates that the air at the sea surface should warm at only 83% of the mean lower-troposphere warming. Which means there’s something wrong with the HadSST dataset. What is wrong is that it has been relentlessly tampered with to make it look as though there is warming when in fact there is none. And, even if that were not the case, you cannot retain intellectual credibility when you accuse me of lying when, as you knew and know perfectly well, I was telling the truth.
You are bottomlessly ignorant on the climate question, and, like many others with small minds and smaller intellects, you went along with the herd, and the herd turns out to be a herd of lemmings, and the clifftop is approaching. You need to rethink – assuming that you can think at all, of which you have showed precious little evidence here.
Yes, you lied when you said “ARGO data showed no warming of the upper strata of the ocean.” In fact:
https://uploads.disquscdn.com/images/ca891b5da674f0cceb6eaedc12e9aca472b9ffd382fb2dd903574785279237d4.png
Don’t be childish. If you’re already deep in a hole of your own making, stop digging. The ocean heat content graph, with zettajoules helpfully converted to temperature, is actually displayed in the head posting, which you did not even read when the climate-Communist advocacy group that pays you to drivel about global warming told you the usual trolls were being crushed and ordered you into the firing line.
Note that the graph you display is for 0-700 m. Now, go back and do your homework properly. Find the data for 0-100 m, and let me know what it shows. Then for 0-10 meters. Then for 0-1000 meters. Then you’ll see what’s happening. The ocean is warming (at a rate for the entire 1.9 km slab that ARGO monitors) at a rate equivalent to 1 degree every 430 years. But the warming is occurring from below. Now, that is directly contrary to the theory that the ocean is being warmed by the atmosphere, because the atmosphere is not below the ocean. It is above it. Surely you know that much.
Monkie: Zettajoules and temperature are not equivalent units. You should understand that at least.
We’re talking about global warming here. So the 0-700 m layer is much more significant than the 0-100 m level. And the 0-2000 m level is even more significant — and it shows accelerating warming:
http://davidappell.blogspot.com/2015/08/latest-ocean-heat-content-numbers-show.html
http://davidappell.blogspot.com/2015/08/more-on-latest-ocean-heat-data-and.html
Don[t be childish. Does ARGO measure ocean heat content? No. It measures ocean temperatures. NOAA then converts the temperatures to Zettajoules of ocean heat content, using the standard formula that you will find in any physics textbook. Grow up and learn some elementary physics before presuming to lecture your betters on it.
Your admission that the 0-100 m layer is not warming, that the 0-700 m layer is warming and that the 0-2000 m layer is warming still more (albeit with a combined rate equivalent to only 1 degree per 430 years, which is not exactly a ground for manic panic, now, is it?) should suggest even to your more than commonly obtuse mind that the warming is coming from below, but the atmosphere where the “global warming” to which you refer is supposed to originate is coming from above. Are you incapable of understanding how fatuous you look, not being able to deal with these points?
The Monkey wrote: “Your admission that the 0-100 m layer is not warming”
Prove it. With data.
Don’t be gaga. I’ve answered this many times. ARGO marine atlas.
URL to 0-10 m graph? Attach it here.
Potty Lord Monkton wrote: “Does ARGO measure ocean heat content? No. It measures ocean temperatures.”
Of course they (unlike UAH) measure temperatures. Obviously. Then that is converted into heat gain, because heat gain is far more important to climate considerations.
Do you know why, Monkey?
UAH measures temperatures. RSS measures temperatures. HadCRUT4 measures temperatures. ARGO measures temperatures. It is temperature that is more important than heat content, because the heat capacity of the ocean is so very large that the ocean is barely affected by the puny changes in heat content that we can achieve. You could explode billions of Hiroshima bombs directly over the oceans and mean ocean temperature would scarcely change (though the surface would warm for a bit).
“UAH measures temperatures. RSS measures temperatures.”
Prove it.
Here you go, Monkey:
“By choosing measurement frequencies where the atmosphere is (almost) opaque, the upwelling radiation measured by microwave sounders is representative of the
temperature of thick layers of Earth’s atmosphere.”
page 8 of:
Climate Algorithm Theoretical Basis Document (C-ATBD)
RSS Version 3.3 MSU/AMSU-A
Mean Layer Atmospheric Temperature
http://images.remss.com/papers/msu/MSU_AMSU_C-ATBD.pdf
Are you hiding, Monkie?
“It is temperature that is more important than heat content, because the heat capacity of the ocean is so very large that the ocean is barely affected by the puny changes in heat content that we can achieve.”
Idiot. This is EXACTLY WHY temperaure is LESS important than heat content.
A given temperature change in the ocean would be about 1000 times more in the atmosphere….
The Monkey wrote: “albeit with a combined rate equivalent to only 1 degree per 430 years”
Wrong Lordie. The 0-2000 m is warming at an average linear rate of 0.036 C/decade, or 1 C/281 years.
But there’s a significant acceleration to the warming, on great Monkie. Changes everything:
http://davidappell.blogspot.com/2015/08/latest-ocean-heat-content-numbers-show.html
For the first 11 full years of data, the warming rate is equivalent to 1 degree every 430 years. One cannot include part-years because the global sea temperatures, unlike the overall surface temperatures, are seasonally auto-correlated. I should expect the warming rate to increase for the current year when it is concluded, because it is concluding with a strong but naturally-occurring el Nino. But the value given by the hapless Appell, even if it were correct, says it all: 1 degree in 281 years is no pretext for manic panic, now, is it?
Got it: Monkie agrees that SSTs are currently warming. Good to know.
I don’t understand why the Monckton’s of the world think they can get away with making false claims, when the data is readily available:
http://www.nodc.noaa.gov/OC5/3M_HEAT_CONTENT/
Don’t be pathetic. Get the graph for 0-10 m. It shows no warming from 2004-2014. And get it from the dataset I was citing, which is – for the nth time – the ARGO dataset, not the NOAA dataset. You accused me of lying when I said the ARGO dataset shows no warming of the upper or surface strata of the ocean. Now, go away and download the ARGO marine atlas and just check before digging yourself any further in.
You’ve already shifted your ground once by citing the HadSST dataset, which doesn’t even measure ocean temperatures; and now you’re shifting it again by citing NOAA data and not the ARGO data you accused me of lying about. And you are looking at data down to 700 m, and not the data for the upper or surface strata. 700 m down is not, repeat not, the surface, now, is it? How dumb can you get?
Besides, IPCC’s prediction in 1990 was about air temperature. And it was wrong. And the head posting says so. Even if the ocean surface wee warming, which it is not, that would not alter the fact that the IPCC’s predicted warming rate for the surface air temperature was – on all datasets – so excessive that the measured warming of the past 25 years does not even approach the lower bound of IPCC’s then prediction interval.
Monkie wrote: “Get the graph for 0-10 m. It shows no warming from 2004-2014. ”
More data you can’t provide. It’s not even surprising anymore.
I have on three previous occasions asked and answered this question. The data are in the ARGO marine atlas, which is available online, and in a previous comment I even told you exactly how to download the data and operate the atlas. So don’t be childish.
Monkie wrote: “You accused me of lying when I said the ARGO dataset shows no warming of the upper or surface strata of the ocean.”
Wrong, Lord Monkie. I said you did not provide a link to the data.
And you still haven’t.
Unless you can, your claim is a lie.
You accused me of lying when I said the ARGO dataset shows no warming of the upper or surface strata of the ocean. Your reason for calling me a liar was that you thought the HadSST3 data showed warming of the ocean. It doesn’t, because it doesn’t measure ocean temperature, as I have thrice explained.
And why would you call me a liar for allegedly not having provided a link to the data? Raise your game: you are being entirely pathetic, and you have already provided me with a chapter of laughs for my next book: and I don’t even have to pay you.
For the fourth time, if you want access to the ARGO marine atlas, type the words ARGO marine atlas into Google and press RETURN. Anyone else who may be tempted at this stage to take you seriously can of course try that for himself and find his way straight to the data, as could you, if you could be bothered. But you are too busy trolling here. After all, you’re not paid by your climate-Communist masters to do scientific research, which is just as well because you are clearly incapable of it. You’re paid to disrupt these threads, and you’ve finally come across someone who won’t be bullied. And you don’t like it. Hence the plaintive, wailing tone you adopt.
And before you whine to the effect that I’ve called you a paid climate Communist, you called me a liar and I’ve called you out on it. So no more blubbing, and no more lying to the effect that I haven’t told you the magic words ARGO marine atlas, that will take you straight to the data.
Monkey: No, I said you provided no evidence to support your claim about ARGO and the ocean surface.
And you still haven’t.
Do you understand, Monkey, that scientific claims require evidence???
Maybe not, since you solved HIV.
“And why would you call me a liar for allegedly not having provided a link to the data?”
Didn’t. You CAN’T provide any evidence.
Which is sadly typical of fake members of the House of Lords.
“For the fourth time, if you want access to the ARGO marine atlas, type the words ARGO marine atlas into Google and press RETURN.”
Where is your graph of this data, Lordo?
Do fake HoL members not know how to make graphs of data?
Monkie wrote: “And you are looking at data down to 700 m, and not the data for the upper or surface strata.”
We’re talking about global warming here, Monko. That means ocean warming. And the ocean is warming fast. That means the Earth has an energy imbalance. That means global warming, except for Monkies who cherry pick small intervals to hide it.
Don’t be childishly repetitive. The oceans are warming from below. CO2-driven global warming is from above. Ergo, the latter is not driving the former. Not very hard, is it, if you devote just a moment’s thought to what the data mean.
And the ocean is not warming fast. On six previous occasions in this thread alone, I have pointed out to you that the upper 1.9 km of the ocean is warming at a mean rate across all strata equivalent to 1 Celsius degree every 430 years. That is not “fast”, now, is it?
A monkey wrote: “The oceans are warming from below.”
Ding Dong!
And the Monkey’s evidence for this is what?????????
Monkie wrote: “I have pointed out to you that the upper 1.9 km of the ocean is warming at a mean rate across all strata equivalent to 1 Celsius degree every 430 years.”
I”ve downloaded the data, Monkfish, and I know how to use it. The rate is 1 C/280 years, and it’s accelerating.
Do you know how to calculate anything, fake?
“The oceans are warming from below.”
Evidenc?
“The oceans are warming from below.”
Then why has the 0-700 m region of the ocean gained 47 ZJ of heat in the last 10 years, while the 0-2000 m region has gained only 102 ZJ?
Sources:
0-700 m:
http://data.nodc.noaa.gov/woa/DATA_ANALYSIS/3M_HEAT_CONTENT/DATA/basin/3month/ohc_levitus_climdash_seasonal.csv
0-2000 m:
http://data.nodc.noaa.gov/woa/DATA_ANALYSIS/3M_HEAT_CONTENT/DATA/basin/3month/ohc2000m_levitus_climdash_seasonal.csv
“Which means there’s something wrong with the HadSST dataset.”
More likely there’s something wrong with the satellite data — satellites don’t even measure temperatures, do you realize that?
Actually, satellites do measure temperatures. They self-calibrate by using mirrors pointing outward to reflect the cosmic background radiation on to platinum-resistance thermometers, the most accurate of their kind in (or, rather above) the world. They use microwave sounding units to reconstruct tropospheric temperatures, and the platinum-wire thermometers provide the calibration that keeps the measurements within close tolerances. I happen to know the people who designed the satellites and invented the system, so I can bore for Britain about it. Once again, Appell doesn’t know his stuff and assumes that because he is ignorant everyone else must be also.
Wrong, Monkie. Satellites measure microwaves. They use a MODEL — a MODEL — to try to convert those to temperatures.
It’s quite a complicated model, Monkie. Do you need a reference?
You had said satellites did not measure temperatures. I had pointed out, correctly, that they do. In order to calibrate the results from the microwave sounding units to which I had referred in my previous comment, they use platinum resistance thermometers. You were wrong to say they don’t measure temperatures. They do. Get over it.
Monkey: No, satellites do not measure temperatures. Dummy.
They measure microwaves. They use MODELS to convert them to tempertatures:
Climate Algorithm Theoretical Basis Document (C-ATBD)
RSS Version 3.3 MSU/AMSU-A
Mean Layer Atmospheric Temperature
http://images.remss.com/papers/msu/MSU_AMSU_C-ATBD.pdf
Monkie: The satellite data (UAH, RSS) use very complicated models, that require many adjustments convert microwave readings into temperatures. Here’s a document that analyzes some of the complexity:
Climate Algorithm Theoretical Basis Document (C-ATBD)
RSS Version 3.3 MSU/AMSU-A
Mean Layer Atmospheric Temperature
http://images.remss.com/papers/msu/MSU_AMSU_C-ATBD.pdf
Good. You are at last beginning to understand how unsettled the “settled” science is. However, the published measurement, coverage and bias uncertainties in the terrestrial datasets are approximately a sixth of a degree either side of nominal. The uncertainties in the satellite datasets are far smaller, because they have near-total coverage, they use a uniform method of measurement, they self-calibrate using the most accurate thermometers in the world to measure the temperature of the cosmic background radiation as a reference point, and they are also confirmed in their accuracy by tens of millions of radiosonde measurements. The satellites, therefore, provide state-of-the-art temperature monitoring.
Does this mean they are in all respects correct? No. But it does mean that they are in all material respects far more likely to be correct than the terrestrial record.
Monkey wrote: “However, the published measurement, coverage and bias uncertainties in the terrestrial datasets are approximately a sixth of a degree either side of nominal.”
Bad monkey, bad. This is false. Gavin Schmidt told me last December their error bars are +/-0.05 C.
Don’t ask UAH, though. They can’t be bothered with producing error bars.
“And they show no warming for 18 years 6 months and 18 years 9 months respectively.”
You said such a year ago. Why isn’t this period getting longer….?
Don’t be pathetic. Exactly a year ago there had been no warming for 18 years 1 month, so the pause has lengthened by 8 months in a year, which is astonishing given that it’s a year in which a large el Nino has been growing throughout. The fact that both ends of the graph change is fully discussed in the head posting. Try reading it. Making stuff up, as you have now done yet again, does not impress, and it does not work with me.
Monkie wrote: “Exactly a year ago there had been no warming for 18 years 1 month, so the pause has lengthened by 8 months in a year.”
But it hasn’t lengthened by 12 months, HAS IT??
All you’re doing it utilizing the 1997-98 El Nino to offset recent gains.
You’re using natural variability to make claims about a period that isn’t representative of climate change.
And you know it, Monkie.
Read the head posting. The point is clearly, fairly and squarely addressed there.
Why isn’t the great pause lengthening, Lord Monkey? Instead it is CONTRACTING as time goes by…..
Three years ago the Pause was 16 years long. Now it is almost 19 years long. Extension is the opposite of contraction. Learn to count.
No pause at the surface: (from Karl et al 2015)
https://uploads.disquscdn.com/images/8e69f09c16fd746d7eb645aaec39324b236e730ea247d1302bb40be65a997998.jpg
No pause in ocean warming:
https://uploads.disquscdn.com/images/808425378c93e169ee934a3f740dc7f0232e564a0b680c72e53eed76649ccd9f.png
It’s a massive cherry pick: choosing the interval that gives you the results you want, whether or not they are representative of climate change.
Even the WMO thinks at least 30 years are needed for a period representative of climate and not noise.
I discussed this piont with Jarraud, then WMO CEO, at Durban four years ago. One must take 60-year periods to avoid the distorting effects of the 30-year positive followed by 30-year negative cycles of the PDO. However, NOAA, in its State of the Climate report in 2008, concluded that for the purpose of evaluating the accuracy of the models’ computer predictions (which is not the same thing as establishing climatic patterns) 15 years without warming would indicate a discrepancy between prediction and reality. There has now been a near-19-year period without warming.
As to your rebarbative repetition of the allegation of cherry-picking, read the head posting, where that point is answered in detail, both in the main report and in the technical annex. And for heaven’s sake, grow up. You’re repeating yourself futilely. I don’t mind: I’m ill at present and can amuse myself demolishing you: thousands are watching you wriggle and squirm and behave like a spoiled little climate-communist troll. And you use the Communist technique of never paying the slightest attention to your opponent’s argument: you simply restate the Party Line, over and over and over and over. How intellectually bankrupt is that?
The Monkey wrote: “One must take 60-year periods….”
Happy to. Over the last 60.0 years, HadSST3 shows +0.54 C of warming. Very statistically significant.
So, after four-fifths of the entire anthropogenic forcing since 1750, the resultant warming is equivalent to less than 1 Celsius degree per century. Not exactly planet-threatening, now, is it?
“So, after four-fifths of the entire anthropogenic forcing since 1750, the resultant warming is equivalent to less than 1 Celsius degree per century. Not exactly planet-threatening, now, is it?”
The difference between the glacial and interglacial periods of the recent ice ages is only 8 C, on a global average.
So we’re had 10-15% of an inverse ice age. And climate change is just getting started.
The Monkey wrote: “And you use the Communist technique of never paying the slightest attention to your opponent’s argument”
Notice how the Monkey can’t write a paragraph without demonizing his debater.
Shows the weakness of Monkey’s hand.
Read the head posting. And read your own comments here, in which – to take one example, you have asked some 20 times where to find the ARGO data, and I have told you precisely how to find it, and you have merely repeated the question over and over and over again as though it had not been answered over and over and over again. That technique is a well-known technique of paid climate-Communists.
Monkton: What is the URL to the ARGO 0-10 meter data?
Asked and answered.
You have never provided a URL, and by now it’s clear you can’t.
You are a fake, Monckton, just as the House of Lords says.
Asked and answered,
Monckton cannot provide a simple URL to data to support his claims.
I gather this is hardly the first time.
Asked & answered.
Monckton couldn’t present data to back up his claim if he life depended on it.
For plenty of well sourced data, see the head posting.
Monckton still can’t provide proof of his claim.
BTW, the latest ocean heat content data shows global warming is accelerating:
http://davidappell.blogspot.com/2015/11/more-big-gains-in-ocean-heat-content.html
ARGO marine atlas.
ARGO marine atlas ..
Monckton can’t provide the simple data to support his claim.
Why should anyone take Monckton seriously?
ARGO marine atlas
I’m not going to guess what data you’re talking about.
Put the graph up here.
You can’t, because you are a fake.
What is the URL to the ARGO 0-10 m data? Why can’t you say?
…because 18 years X months says nothing about climate change, but about climate noise.
Don’t be rebarbatively repetitive. And don’t simply ignore information you’ve been given earlier in the conversation. Those two tactics are hallmarks of paid climate-Communist trolls, and they don’t work. Not any more. NOAA’s state of the climate report for 2008 said a period of 15 years or more without warming – their figure, not mine – would indicate a discrepancy between prediction and observation. The models would have been proven wrong. Well, you have been citing NOAA at me over and over again, so one assumes that, with the habitual and head-banging deference of the unthinking climate Communist to the Party Line, you regard NOAA as “mainstream science”. Well, if “mainstream science” says a period of 15 years or more without warming indicates a discrepancy, then a fortiori a period of 18 years 9 months indicates a discrepancy. Your disagreement, therefore, is not with me so much as with the Party Line. Be careful: the goons will come and kick your door down at 3 in the morning and send you off to the re-education camps.
Monkie wrote: “The models would have been proven wrong.”
https://uploads.disquscdn.com/images/625d5a6271f649628edaab1c49a61ab2485d6ca5c0ca5d39725ac54eaffd21fb.jpg
Asked and answered. The predictions are from an unknown and unstated source – probably a climate-Communist website or rent-seeking governmental organization. The data are from an unidentified source. The data and the predictions are not zeroed to 1990. The graph, therefore, contributes nothing of value. The RSS and UAH data both show no warming for nigh on 19 years. NOAA said an absence of warming for 15 years would indicate a discrepancy between prediction and reality. The discrepancy is now an abyss. An honest man would accept that the models are wrong and rethink.
A Monkey wrote: “The predictions are from an unknown and unstated source”
Monkey can’t find Hansen’s 1981 paper.
Monkey isn’t very smart, is he?
People with integrity and who don’t cherry-pick know the highly-adjusted satellite record shows warming.
Ewwwps.
Best,
D https://uploads.disquscdn.com/images/8d5f5415b57b758aab82205a2e23df2d24e3b4f7cce43949db7b630b319d4535.png
The RSS dataset shows no warming from February 1997 to October 2015. The UAH dataset shows no warming from May 1997 to October 2015. Those were the dates plainly stated in the head posting. Yet the graph above is not even displaying the monthly datasets. The statistical rule is that one should aim for the greatest possible number of degrees of freedom, and that means using monthly data where they are available. And one should certainly not be as dim as to try to refute a monthly dataset by using an annual dataset and not even using the same periods as the ones in the head posting.
The very definition of cherry-picked analysis, well done.
Best,
D
All five datasets are mentioned and graphed in the head posting. Nothing is cherry-picked. But that phrase is the Party Line. So now that you’ve trotted out the Party Line, you can get paid by whichever climate-Communist advocacy group foolishly thinks it worthwhile to try to disrupt these threads.
Dishonest assertion. The start points you cherry-picked are the very definition of cherry-picking, as my link demonstrated.
Best,
D
Asked and answered. The surface strata of the ocean are not warming at all. The ocean is warming from below, at a rate equivalent to 1 degree in 430 years.
Prove it!!!
This site allows you to include a pictoral graph in your response.
So include your’s.
Asked and answered…
Monkton can’t attach a graph that supports his claims.
Is it any surprise the House of Lords considers him a liar?
Proof the ocean is warming from below?
Cause?
Asked and answered.
Monckton says the ocean is warming from below, but can’t provide any data to support this claim.
If he wasn’t a clown, Monckton would get no attention at all.
Asked & answered. ARGO marine atlas.
Monckton can’t post a graph here backing up his claim.
Monckton lives up to his reputation.
See the ARGO graphs in the head posting. For more graphs, go to ARGO marine atlas.
Monckton can’t post one graph here in support of his claim.
Not one.
See the graphs in the head posting. For more, go to ARGO marine atlas.
The latest ocean heat content data shows global warming is accelerating:
http://davidappell.blogspot.com/2015/11/more-big-gains-in-ocean-heat-content.html
Mobius Look, on Monckton:
“He is only person I’ve ever heard of that the UK House of Lords has felt compelled to write and publish a letter to publicly stating that he is a liar and demanding that he stops lying.”
https://disqus.com/home/discussion/climatedepot/no_global_warming_at_all_for_18_years_9_months_a_new_record_8211_the_pause_lengthens_again_just_in_t/#comment-2356673365
Off topic. Wrong.
What is heating the oceans from below? Not volcanic activity.
“There are a number of ways to attack this poor reasoning, but I’ll try to go with the ones I think are most convincing.
This argument suggests that volcanic activity (not just volcanoes) on the ocean floor must be increasing over the last few hundred years. We see no evidence of this – and the author of the post only uses evidence that we have discovered more volcanoes (up to 3.4 million) on the seafloor.
The author claims “that 3,477,403 number, coming from two well-respected oceanographers, does reinforce my point rather nicely, namely, that underwater volcanoes are heating the seas.” Sure, there might be a lot of volcanoes but he makes no mention of how many might be active enough to heat the ocean water. We can see at surface volcanoes that not all of them are erupting or puffing away simultaneously – why would undersea volcanoes be different? Additionally, of those 3.4 million ‘volcanoes’ he cites from a 2007 study, how many were considered active?
Finally, you would expect in this situation that ocean water would warm from the bottom (near the volcanoes) upwards, but it is actually the surface waters that are warming, not the deep ocean. This suggests that heating is coming from exchange with the atmosphere, not from some deep source on the ocean floor.
It is very easy to try to throw around some partially baked ideas about volcanism to try to explain the changing in the ocean temperature worldwide, but they would require extraordinary circumstances where ocean volcanic activity was increasing exactly when human carbon dioxide production was also increasing. Sorry, the subsurface volcanoes are no source for your ocean heating (and if I had the time, I’d calculate how much energy would take to heat all the oceans by 0.5C – it is bound to be more than you can get out of a few hundred thousand Ruapehus).””
http://volcano.oregonstate.edu/deep-sea-volcanoes-and-ocean-warming-reprint
Not sure what Jack Dale is on about. His quotation of 3.4 million volcanoes does not seem to come from me. The head posting mentions only the volcanic eruptions of el Chichon and Pinatubo, both of which are land-based volcanoes.
The evidence that the ocean is heating from below comes from the ARGO marine atlas, which shows the nether strata warming while the upper strata are not, and the warming decreases as one nears the surface, until it reaches zero at the surface itself.
One possible reason for the warming from below is a change in the pattern of volcanic activity on the seabed, particularly along the mid-ocean divergence boundaries, especially in the eastern Pacific, where the tectonic plates are moving apart quite rapidly. However, there is no way of knowing for sure, because these deep-sea trenches, some of which are seven miles deep, are largely unmonitored.
Another reason for the ARGO results may be that the buoys are not reading ocean temperatures accurately. The problem is that the “official” storyline relies on too few observations (each ARGO buoy has to cover 200,000 cubic kilometers of ocean) with too large an uncertainty; yet we are foolishly told the science is settled.
Why the ocean is warming from below is not at all certain: all one can say is that warming from above is what one would expect if the “official” theory were correct, and the observations are the very opposite of what theory would predict.
Of course, the satellites show no warming at all in the lower troposphere for getting on for two decades. It may be that one reason for the absence of warming at the ocean surface, as measured by ARGO, is that the atmosphere above the ocean is not warming. The three longest-standing terrestrial datasets all showed no surface warming until, in the last 18 months or so, all of them were altered so as to show some warming, while RSS, which has not been altered much over the period, continues to show no warming at all.
Even on the altered versions of the terrestrial tamperature datasets, the rate of warming since 1990 is well below even the IPCC’s least prediction that year.
https://uploads.disquscdn.com/images/0d22951e4d313c03710da65bbb372d4e4f86a2d8794e460fb274c3482f51b56e.jpg
60% and up, 2/3 ARGO floats failed, about half-way through their expected lifetime (2 to 2½ years). They have violated the temperature stability specification of 0.0002°C/year, and record temperatures that reached or exceeded the 0.002°C accuracy specification.
3/3, meaning 100% of the ARGO floats, artificially record warmer-than-reality for the colder temperatures, by 0.001°C to 0.003°C. (Oka 2005). All of the ocean warming is 0.005°C to 0.002°C, according to Roemmich 2015: “The net 0–500 m global average temperature warmed by 0.005 °C yr^−1. Between 500 and 2,000 m, steadier warming averaged 0.002 °C yr^−1 with a broad intermediate-depth maximum between 700 and 1,400 m…” Few of the Argo floats have been recovered and inspected. Most of those few failed inspection and no longer met the expected, specified temperature accuracy. The magnitude of the error is the same size as the “Global Warming” that is being reported … about 0.005°C.
Oka, Eitarou 2005. “Long-term sensor drift found in recovered Argo profiling floats.” Journal of Oceanography
http://www.terrapub.co.jp/journals/JO/pdf/6104/61040775.pdf
2/3 of ARGO floats report artificially warm temperatures. 1/3 is at the current limit, indistinguishable from failure.
”The accuracy requirement of the float measurements in Argo
is[was] 0.005°C for temperature [now 0.002°C] … The temperature requirement is relatively easy to attain, …””Furthermore, the temperature sensor of the floats actually shows some drift, causing an equivalent drift in salinity, but…”
”Riser and Swift (2003) reported recovery of three profiling floats.” Apparently unpublished.
”Using the calibration bath at JAMSTEC, manufactured by Sea-Bird, we can simultaneously calibrate both temperature and conductivity sensors of a float, in ranges of 1–32°C … (Inoue et al., 2002). We estimate that the precision of our calibration is 2 × 10^-3 °C [0.002°C, current spec is 0.002°C] for temperature … as follows: in the temperature calibration the accuracy (1 × 10^-3 °C) of the reference sensor and the nonuniformity (1.7 × 10^-3 °C) of the temperature distribution in the bath (Inoue et al., 2002) affect the calibration uncertainty, resulting in a total error of 2 × 10^-3 °C, which is the square root of the sum of squares of the errors.”
”As the precision of calibration at Sea-Bird is thought to be comparable to that at JAMSTEC (N. Larson, personal communication), all the sensors were calibrated with the same precision. The calibrations were conducted twice within a few days for each of Floats 1–3 in order to confirm the results.”
”The temperature sensor of Float 1 indicates higher values than the reference sensor by 1.1–2.0 × 10^-3 °C, [0.001°C to 0.002°C, spec is 0.002°C] while that of Float 2 shows lower values by 0.7–1.9 × 10^-3 °C. … These residuals in temperature … for both floats are comparable in magnitude to the precisions of calibration. … The floats adequately fulfill the accuracy requirement of Argo. The temperature … sensor of Float 3 indicates higher … values than the reference sensor by 0.2–1.6 × 10^-3 °C … ”
”Three Argo profiling floats were recovered after operating for four to nine months and their temperature … sensors were recalibrated.”
Oka, Eitarou, and Kentaro Ando 2004. “Stability of temperature and conductivity sensors of Argo profiling floats.” Journal of oceanography
http://www.jamstec.go.jp/J-ARGO/results/2003oka.pdf
The ocean is truely vast, and even 4000 probes just does not cover the huge expanse. The earth’s global oceans – about 361,900,000 square kilometres, are measured by only 4,000 Argo profiler buoys: – that is just one Argo float per 90,000 square kilometres. That is just one Argo float for an area of ocean even larger than the island of Ireland … one float for a space of ocean twice the size of Switzerland (or twice the size of Denmark). In US States, that is just one Argo float for an oceanic area the size of entire state of Maine … or Indiana, or South Carolina. D.M. Legler 2015 reports: ”An analysis of Argo float locations on 25 August 2014 shows an r.m.s. nearest-neighbour distance of 170 km, with actual nearest-neighbour separations varying from 1 km to a single lonely float 780 km [485 miles] from its nearest neighbour” in the Journal of Operational Oceanography. If there is no land around that lonely float, then it is reporting for a surface area of about two million square kilometres.
The total oceanic volume is about 1,335 million cubic kilometres {http://www.ngdc.noaa.gov/mgg/global/etopo1_ocean_volumes.html}. Dividing that by 4000 profilers, each float is supposed to measure and represent 334,000 cubic kilometres of seawater. Argo profiling floats measures the upper 2000m, at best. The surface area of the global oceans (361,900,000 square km) to a depth of 2 km (2000m) is about 723 million cubic kilometres. Divide that by 4000 floats. Each Argo float, if evenly spaced, is credited with measuring about 181,000 cubic kilometres of seawater – a ratio of 1.8, i.e., a float measures the warmest half, and alarmists represent this as the whole global ocean’s heat content.
The total volume of all the Great Lakes is 22,520 cubic kilometres. Just one Argo float has to measure and report on a volume of water eight times the volume all the Great Lakes. Pretty tough job. Then, the alarmists extend the spotty coverage of the Argo float, as if it went all the way to the bottom, and pretend that the Argo float accurately characterized a volume of seawater that is fourteen times as large as the total volume of all the Great Lakes. One float that profiles the water, three times a month … in 181,000 cubic kilometres of seawater.
The ARGO bathythermographs are indeed too few to draw reliable conclusions. What they appear to show, however, is that the surface strata of the ocean have not warmed at all during the 11 full years of data. Since the lower troposphere has not warmed at all either over the same period, the inference is that surface temperature has not increased. So there is something wrong with the terrestrial temperature datasets.
That does not seem to tally with the HADSST3 data set.
http://woodfortrees.org/plot/hadsst3gl/from:1979/to:2016/mean:12/plot/hadsst3gl/from:1979/to:2016/trend/plot/hadsst3gl/from:1997/to:2016/trend
The HadSST data were tampered with to force ARGO into line with the far less accurate and far less complete ship data from earlier periods. ARGO is the least ill-resolved dataset we have. It shows no warming till the present El Niño.
So in the ever decreasing circles of your argument, yet another team of scientists are engaged in fraud because you don’t accept their findings.
No evidence whatsoever to back up your spurious allegation, no detail of how the fraud is executed, or indeed maintained in the face of the independent scrutiny of peer review.
Nothing here but the failing words of a man denounced by the UK House of Lords no less as a liar.
The matter is quite simple. The least ill-resolved record of temperatures in the surface strata of the global ocean is the ARGO bathythermograph dataset, compiled from some 3600 automated floats reporting thrice monthly by satellite link. These data show no warming of the surface strata, though there is some warming coming from below – directly counter to what one would expect on the basis that CO2 is the driver of the climate.
Karl et al. (2015), desperate to pretend that there had not, after all, been any pause in global temperatures, issued a paper in which they compared the ship-based earlier data with the far bettter-resolved and more accurate ARGO data, found a discontinuity, and decided to resolve it by tampering with the results from ARGO. This nakedly political and anti-scientific rejection of the better and more recent data without adequate explanation has rightly attracted widespread criticism.
The truth is that all datasets that show some sort of warming over the past 18 years 9 months owe the greater part of that warming to alteration of the original records ex post facto. Even if Karl (whom I have caught out tampering with results before) had made honest changes to the sea-surface temperature data, without those changes there would have been little or no warming over the period, even though one-third of all anthropogenic forcings since 1750 occurred during the same period.
Any honest scientific appraisal would conclude that the original exaggerated predictions of very rapid warming that the IPCC made in 1990 as the basis for the climate scare were incorrect. For further details of some of the errors made by the climate models, see Monckton of Brenchley et al. (2015), Science Bulletin of the Chinese Academy of Sciences, Vol. 60 (1).
Serial, paid disinformer disinforms. SHOCKER
Best,
D
Chris M wrote:
“These data show no warming of the surface strata, though there is some warming coming from below – directly counter to what one would expect on the basis that CO2 is the driver of the climate.”
Are you actually claiming that higher atmo CO2 should lead to ocean cooling?
Tammmprrin! Drink!
Best,
D
Argo: Overlapping error bars is a sign that the data contains no significance. https://uploads.disquscdn.com/images/ebe02eb68d25593177d80172fcab0bb431a433388e5b1b9b12a01e7327cb0dd3.png
https://uploads.disquscdn.com/images/ab61e94e18572468543c342a5f46ba1b69f91a4d7de1c922510ce2aeaeb0917e.jpg
…especially in the cold areas. The sampling completely misses the entire formation of Antarctic bottom water (AABW, which is extra salty from the brine rejection in the formation of sea ice, so it gets colder than ordinary seawater can get, ie, one or two degrees below zero)
https://uploads.disquscdn.com/images/2b0d1da8c7f7fdc1f8f50635fda0a8c7be67f396bdc5c1e0178b75e111f8f1c6.jpg
“The coldness of the deep ocean is due to interaction of the ocean with the polar atmosphere. … Streams of very cold water can be traced spreading primarily from the Antarctic along the sea floor, warming, en route, by mixing with overlying water, into the world’s oceans (Figure 2).”
”The coldest bottom water, Antarctic Bottom Water (AABW), … At a few sites, the shelf water salinity is sufficiently high, greater than 34.61‰, … density is sufficiently high to allow it to sink to great depths of the ocean. … the final product, arriving at the sea floor, at the foot of Antarctica, is about -1.0°C.”
”The ocean is cold. Its average temperature of 3.5°C is far colder than the warm veneer, capping much of the ocean. Waters warmer than 10°C amount to only 10% of the total ocean volume; about 75% of the ocean is colder than 4°C. Along the seaSoor the ocean temperature is near 0°C. The cold bottom water is derived from Southern Ocean, the ocean belt surrounding Antarctica. Sea water at its freezing point of -1.9°C is formed in winter over the continental shelf of Antarctica. Where the salt content of shelf water is high enough, roughly 34.61‰ (parts per thousand) the water is sufficiently dense to descend as convective plumes over the continental slope into the adjacent deep ocean. In so doing Antarctic Bottom Water is formed. It is estimated that on average between 10 and 15 x10^6 m^3 of Antarctic bottom water forms every second! … North Atlantic Deep Water… is estimated to form at a rate of around 8 x10^6 m^3 s^-1 .”
Book: Gordon, A. 2009 Bottom water formation. Academic Press
http://curry.eas.gatech.edu/Courses/5225/ency/Chapter11/Ency_Oceans/Bottom_Water_Formation.pdf
https://uploads.disquscdn.com/images/64bc22d29cae4171c0541c90697194694ea1117ea07212189eb3994bba4dce53.jpg https://uploads.disquscdn.com/images/062fc291be6f61450da78892e8fa6405f3f59a63c6dce2084834358051968c55.jpg
As a counterpart to the formation of -2°C seawater in Antarctica, the North Atlantic Deep Water formation (NADW) is a bit warmer, and a lot more shallow. Still cold, but fresher, this water is formed in the Denmark Strait (between Iceland and Greenland) at only 600m deep. Unfortunately, this icy-cold water production is not measured by Argo floats.
Chris M wrote:
“The ARGO bathythermographs are indeed too few to draw reliable conclusions.”
Prove it. Define “reliable.” Let’s see your math.
Don’t whine. And don’t be lazy. Do the math yourself.
Look up the ARGO website. Find the number of bathythermographs currently operating. Find from an atlas the area of the global ocean in square kilometers. Multiply by 1,9 kilometers (the depth to which the bathythermographs sink) to determine the number of cubic kilometers of ocean that each buoy must cover with its three readings each month. Then think, for Heaven’s sake, rather than just whining.
On the other hand, if you accept ARGO as part of the gospel of your faith, then know this: it shows no warming of the surface strata of the ocean throughout the 12-year record, with the possible exception of the last couple of months, with an active el Nino in progress. It does show some warming taking the entire 1.9 km as a single slab – but the warming rate is equivalent to about 1 degree per 430 years, which is not exactly life-threatening. Oh, and the warming is coming from below, not from the atmosphere above.
So, if you want to accept ARGO as reliable, by all means: but it does not support your case for childish panic. Not at all.
The ocean is by far the best indicator of global warming, because it has the largest heat capacity.
And it shows large heating — there’s no doubt about that.
https://uploads.disquscdn.com/images/7973d5e75d313ef8d12a2858d30015d34d5cc5fa2c48c1a6f49684809ff779d9.png
Misleading as always.
ARGO is an extremely valuable system, however the first buoys were only deployed in 2003 with the system reaching full coverage only in 2007.
The scientists who operate the system state categorically that this time frame is too short to yet draw any conclusions about longer term trends.
One other consideration, the buoys cannot be deployed on land, nor where there is sea ice, so do not cover Arctic and Antarctic seas. Therefore the figures have to be combined with the surface and satellite data sets to generate a global picture.
The latest data on ocean heat content is just out: still more warming:
http://davidappell.blogspot.com/2016/01/latest-data-for-ocean-heat-content.html
Chris M wrote:
“It does show some warming taking the entire 1.9 km as a single slab – but the warming rate is equivalent to about 1 degree per 430 years”
You need to learn the difference between heat and temperature. Need a textbook suggestion?
“….and the warming is coming from below, not from the atmosphere above.”
Prove it.
The data clearly show less warming below 2000 meters depth in the ocean than in the upper 2000 meters.
“see more” – see how deep it really goes …
https://uploads.disquscdn.com/images/a4d6bbc865bfa887e441c3470b1c702aed2408feffd312b58a46155f4baa56be.jpg
An order of magnitude – that is a 1000% increase, in known seamounts. In 2007, that could not have been figured in to the IPCC’s models of climate, including the Assessment Report 2007 (AR4).
Not only do seamounts release CO2 and heat, but, they also warm the ocean around them, which causes the CO2 dissolved in the ocean to be released, magnifying the effect over that of a land-based volcano emitting the same amount of CO2.
”Globally (±60° latitude), we use bathymetry data acquired along 39.5•10^6 km of ship tracks to find 201,055 probable seamounts, an order of magnitude more than previous counts”
”…. we predict 39 ± 1 •10^3 large seamounts (h > 1 km), implying that ~24,000 (60%) remain to be discovered.”
”Satellite altimetry has complete spatial coverage, so analysis of these data [Wessel and Lyons, 1997; Wessel, 2001] has yielded the largest number of Pacific seamounts to date; 8,882 (h > ~2 km). Using a power-law [technique for estimating the total, thus] ~70,000 large seamounts were predicted.”
Hillier, John K., and A. B. Watts 2007. “Global distribution of seamounts from ship‐track bathymetry data.” Geophysical Research Letters
ftp://wserv2.esc.cam.ac.uk/pub/jkh34/Publications/2007GL029874.pdf
Monckton again can’t provide any data whatsoever to support his claims.
Monckton is anti-scientific.
How accurately are the ocean temperatures measured, in order to determine this “90+% of all global warming heat”? …
Not very.
Randomly drifting ARGO bathythermographic probes, from which the “Ocean Heat Content” is reported, have many problems.
(1) They drift, randomly. When one encounters a swift current (like the Gulf Stream, N of Florida, or the discharge of a river), the probe tends to be pushed aside. Unfortunately, this is precisely where high difference, in temperatures, really are.
(2) They don’t do shallow areas. Unfortunately, the temperatures aren’t uniform, in shallow areas, which are influenced (to a much greater extent) by the continental margins, river discharges, overturning, and high wave action, which mixes layers.
(3) They don’t properly cover the poles … which is where the really cold water is.
(4) They don’t go deep enough… Many probes are limited to 1500m, quite a few reach 2000m, but the ocean is an average of 5000 m deep … and that tends to be colder!
(5) The ocean is truely vast, and 3500 probes just does not cover the huge expanse. The ARGO probes measure, about four times per month, a volume comparable to the entire Lake Superior. One thermometer, the entire Lake Superior ….
This ARGO network has been studied:
”The accuracy with which the Argo profiling float dataset can estimate the upper ocean temperature and heat storage in the North Atlantic is investigated. A hydrographic section across 36°N is used to assess uncertainty in Argo-based estimates of the temperature field. The root-mean-square (RMS) difference in the Argo-based temperature field relative to the section measurements is about 0.6°C. The RMS difference is smaller, less than 0.4°C, in the eastern basin and larger, up to 2.0°C, toward the western boundary.”
”…outside of the western boundary, the mixed layer monthly heat storage in the subtropical North Atlantic has a sampling error of 10–20 W/m^2 when averaged over a 10° X 10° area. This error reduces to less than 10 W/m^2 when seasonal heat storage is considered. Errors of this magnitude suggest that the Argo dataset is of use for investigating variability in mixed layer heat storage on inter annual timescales. However, the expected sampling error increases to more than 50 W/m^2 in the Gulf Stream region and north of 40°N, limiting the use of Argo in these areas.”
”The Argo project aims to have one float in every 3° square of ocean, equivalent to roughly 3000 floats globally”
”The noise is less than 0.5°C in the eastern basin and below 1000 m in the western basin. However, there are two main regions centered at 500 m in the western basin where the noise exceeds 2°C.”
”Over much of the section, the Argo-based estimates of temperature agree with the cruise measurements to within 0.5°C. However, there are several regions in the 500 – 1000 m layer west of about 40°W where the differences exceed this value (Figure 9a). Furthermore at the western boundary, west of 74°W, the temperature is more than 2°C warmer in the Argo section than in the cruise section.”
”Decomposition of the RMS differences into errors associated with estimating the temperature field (Figure 12b) and errors associated with estimating the mixed layer depth (Figure 12c) indicates that the former is generally the higher source of error. This is particularly true of the Gulf Stream region where errors arising from inaccuracies in the estimated temperature field result in heat storage errors of more than 200 W/m^2 . The error arising from inaccuracies in the estimated mixed layer depth are typically less than 20 W/m^2 . However, within the Labrador basin where large fluctuations in mixed layer depth occur, the errors arising from estimating the mixed layer depth from a subsampled temperature field become large, exceeding 200 W/m^2 . It should be noted that the two sources of error are not linear. The discrepancy between the total RMS difference (Figure 12a) and the sum of the RMS differences arising from the two error sources (Figures 12b and 12c) is shown in Figure 12d. Nonlinear effects are small in the subtropics but exceed 100 W/m^2 in the Labrador Sea”
Hadfield, R. E., et al. 2007 “On the accuracy of North Atlantic temperature and heat storage fields from Argo.” Journal of Geophysical Research: Oceans
http://www.rsmas.miami.edu/users/mocha/mocha_pubs/hadfield_etal_07_jgr.pdf
The last time I looked, ARGO robots were measuring to the nearest 0.005 C.
https://uploads.disquscdn.com/images/b8a22b5f7d1508a9992bd6b25dcc160d06cadfc721c4b40d9dfdeb3bf6e7a0d1.jpg
First off, you confuse precision with accuracy. Precisely measuring a sample, while completely missing another sample, ends up with the wrong conclusion. Take a look at the Atlantic Overturning Circulation (AMOC). Warm water circulates north, at less than 1000m. Cold water circulates south at depths over 4000m. Randomly-floating ‘robots’ maybe hit, maybe miss the warm currents, but definitely miss most cold currents. They’re the best we’ve got, and the data is way more precise and numerous than we’ve ever had before. …but it is insufficient and way inaccurate to draw ¾W/m^2 overheating conclusions from.
Why do ARGO robots miss cold currents?
https://uploads.disquscdn.com/images/04bf39b6300217073472e2ecdbdea1f596f3d53fc84c123564d4cd50e9734b2e.gif Most COLD CURRENTS are too deep Many ARGO floats stop at 1500m, many do 2000m.
Your picture explains precisely nothing.
Ok, David … it is the best illustration that I have.
ARGO ‘robots’ reach down to 1,500m, the new ones to 2000m.
That isn’t deep enough to reach most cold currents… or, just pools of not-currents, “just sitting on the bottom feeling cold” waters.
Measuring various levels of warm currents tells you nothing about the deeper cold currents that ARGO doesn’t reach. That is just one reason why ARGO floats don’t tell you what you really need to know.
Wunsch and Heimbach 2014 ”Interpretation requires close attention to the long memory of the deep ocean, and implying that meteorological forcing of decades to thousands of years ago should still be producing trend-like changes in abyssal heat content. At the present time, warming is seen in the deep western Atlantic and Southern Ocean, roughly consistent with those regions of the ocean expected to display the earliest responses to surface disturbances.”
“Parts of the deeper ocean, below 3600 m, show cooling.” ARGO floats sample the upper 1,500m to 2,000m range; below 3,600m show cooling!
Wunsch, Carl, and Patrick Heimbach 2014 “Bidecadal thermal changes in the abyssal ocean.” Journal of Physical Oceanography
So, David, ARGO floats – ‘robots’ – bathytheromographs – don’t measure deep enough, and … Wunsch and Heimbach 2014 says, at least parts, are COOLING. So, if you measure the upper layers of water, and don’t measure the deeper layers of water, how can you conclude ANYTHING about ocean heat content?
“Deep ocean heat content changes estimated from observation and reanalysis product and their influence on sea level change.”
Kouketsu et al, GRL v116 (March 2011)
http://onlinelibrary.wiley.com/doi/10.1029/2010JC006464/abstract
This paper finds a warming of +0.05 W/m2 below 3000 m.
Mannkind’s increase in CO2 emissions has apparently caused the oceans to “eat all the global warming” at 3000m?
Oh no. Do your ‘three degrees in the field’ cover the use of tracers in ocean currents? Okay, assume that your Kouk paper is correct … they show that the largest increase in ocean heat content is really deep. The atomic bomb tests of the fifties and the sixties released huge amounts of radioactive Caesium into the oceans. This Caesium acts as a “tracer”.
https://uploads.disquscdn.com/images/8991eaaae77b80ab0c1989831a06db565a814491fa12af13b1954b6882ece631.jpg
Using the 137Cs as a tracer to monitor the ocean currents, that 137Cs has not yet crossed the 1000m depth line. So, how did the CO2 “warming” reach 3000m?
https://uploads.disquscdn.com/images/38f49d94bf58521e0beb8108a4a77953261aa8791c08ebba3ecfefe2a973cb5f.jpg
How OLD are these high-heat-content waters?
https://uploads.disquscdn.com/images/b5a188b23059a3bf3db5b7f4f7cbe3eea20f92bfc7a2088c4c36d1a808c93a0a.jpg
By what mechanism did Mannkind’s CO2 emissions heat this really deep water, and manage to not heat the lower troposphere for the last 18 years, and barely budge the surface-thermometer-record?
“Okay, assume that your Kouk paper is correct … they show that the largest increase in ocean heat content is really deep.”
False.
Below 3000 m they found a change in heat content of 0.8e22 Joules/decade. That works out to 0.05 W/sq-meter.
By comparison, the ocean heat content change for the 0-700 m ocean region is 0.30 W/m2, and 0.64 W/m2 for the 0-20000 m region.
“So, how did the CO2 “warming” reach 3000m?”
Warmth is transported by conduction and convection, same as in any fluid. And by ocean currents that dive deep when they get to the Northern Atlantic from the southwestern Atlantic.
Seeing as the radioactive tracer, Caesium salt dissolved in the ocean, hasn’t reached that depth, that means the convection that has descended to that level was warmed at the surface around 1750 AD. Conduction to that depth would take even longer.
The ocean conveyer belt takes about 1600 yrs to cycle once. Warming happening there may be from many centuries ago….
Mannkind had nothing to do with it.
Mankind does for upper ocean warming, and, eventually, for the deep ocean.
Most of the ‘upper ocean warming’ is actually just noise.
Repeatedly measuring the exact same thing increases the resolution of the measurement of the thing. Significant digits of measurement can be added, increasing, theoretically, as the number of repeated measurements (actually, increasing as thesquare rootof the number of measurements). Basic bell-shaped curve statistics. This technique is erroneously applied in certain ‘real world’ scenarios, where repeated measurements are totally impossible, yet, the same mathematics are applied, as if it were possible. Clearly, there are similarities – some things are “close enough” … but, just as clearly, there are limitations to the extent of how many additional significant digits can be added. Limitations to the conclusions drawn from these repeated measurements, must also be drawn.
Repeated measurements of the mass of rocks does not increase your knowledge of the mass of rocks, or, the average mass of a rock. Obviously, rocks come in all different shapes, sizes, and compositions. Where one scientist, or another, draws the line between a rock, and a bit of sand … or, between a rock, and a boulder, differ significantly. Repeated measurements of the mass of the exact same rock will improve the measurement accuracy of the mass of that particular rock. Of rocks, though … it is a waste of time.
Measurements of the ocean’s temperature cannot, repeatedly, measure the exact same bit of ocean. Movement of water -currents, for example-, both large and tiny, change which molecules of water influence the thermometric probe. Quantifying the amount of similarity is a lot like deciding which samples are rocks, and which samples are sand.
If a measurement is made of a singular, unchanging thing, using a tool that has limited numeric resolution, repeated measurements definitely do tell you something …but, what, exactly? Consider this sequence of theoretical ‘measurements’: 2, 2, 3, 2, 3, 2, 3, 2, 2. Obviously, the thing’s measurement is constrained somewhere between 1 and 4. Numerically, it appears to be two and a third. Is it legitimate to say that the value is 2.5, or 2.3, or 2.33333? The sum is, thus far, 21. The number of measurements is 9. In reality, for that sequence, all you are permitted to say, is “2”. Not 2.3, not 2.33. Not even “two and a third”. If the next measurement is a 3, it is illegitimate to announce that the value has increased by 2.8%. If the next measurement was a 2, it cannot be concluded that the value has decreased 1.4%.
If two scientists observe separate, mercury & glass thermometers, marked in one-degree increments, right now … and one reports, “73” while the other reports “72.9975”, would you be suspicious? Is the first one being lazy? Is the second one lying? Does it matter, if the first scientist says, “I read my thermometer, just now” and the second one says “I read mine 2048 times, just now”. Is the 2nd scientist justified, in using the square root of 2048 to extend his apparent significance? Multiple readings of the same thing are supposed to extend the resolution by the square root of the measurement repetition…
One hundred sailors stood in a ten by ten grid, evenly spaced, one metre apart, across the breezy deck of an empty cargo vessel. Each held aloft a somewhat identical, glass and mercury thermometer, marked in one-degree increments. Each sailor reported the reading of his thermometer, in whole degrees – no fractions. It is legitimate to sum those readings, divide by 100, and report the average temperature, with no decimal places. Is it legitimate to sum those readings, and divide by a hundred, and report that reading with one decimal place? Two? How about if we discard one of the highest readings, one of the lowest readings, sum the rest, and divide by 98? Each sailor is not measuring the same air … but it seems awfully close to the same air.
ARGO probes are used to measure the ocean’s temperature, and other stuff. ARGO probes just drift about, and measure the temperature about once a week. To what extent can nearby ARGO probes’ temperatures be averaged, and the significance of their readings, extended by the square root of the number of measurements?
This web site: http://web.clark.edu/ggrey/Chem141/_notes/significant_digits_and_precision.htm has some advice on measuring with a ruler, or metre-stick; the stuff you have heard about estimating the space between marks. Then, the web site goes on to recommend a totally false practice, about reading a digital multimeter … it says ❝For digital readings, the electronics sets the level of significance❞ which is totally wrong. For example, a cheap, no-brand meter that shows three decimal places, might be significantly off the mark, when compared to a device with only two decimal places, from a reputable manufacturer, costing many times more than the cheap one. Designing an electronic meter’s internal measurements’ accuracy has little to do with the number of digits that the display can show. One might hope that the manufacturer isn’t throwing away precision by not displaying it, but, you can be sure that some manufacturers just include more digits, because it might sell better. Even the price you pay is not a total assurance of accuracy. A non-expired sticker, indicating that the device has been tested to a laboratory standard (that is traceable to a reputable national standard) would be a good thing. The electronic thermometers that I have used have ‘expiration dates’ … they require annual calibration. ARGO floats are not retrieved, so there is no checking the calibration, once released.
No, there’s much less noise in ocean warming than in surface or lower tropospheric warming. Easy to see here:
https://uploads.disquscdn.com/images/467c1f3b9e8ad0c53927234cbf5c9ae448e153d37b1786abe3b3f4ada411252f.png
”The noise is less than 0.5°C in the eastern basin and below 1000 m in the western basin. However, there are two main regions centered at 500 m in the western basin where the noise exceeds 2°C.”
”Over much of the section, the Argo-based estimates of temperature agree with the cruise measurements to within 0.5°C. However, there are several regions in the 500 – 1000 m layer west of about 40°W where the differences exceed this value (Figure 9a). Furthermore at the western boundary, west of 74°W, the temperature is more than 2°C warmer in the Argo section than in the cruise section.”
”Decomposition of the RMS differences into errors associated with estimating the temperature field (Figure 12b) and errors associated with estimating the mixed layer depth (Figure 12c) indicates that the former is generally the higher source of error. This is particularly true of the Gulf Stream region where errors arising from inaccuracies in the estimated temperature field result in heat storage errors of more than 200 W/m^2 . The error arising from inaccuracies in the estimated mixed layer depth are typically less than 20 W/m^2 . However, within the Labrador basin where large fluctuations in mixed layer depth occur, the errors arising from estimating the mixed layer depth from a subsampled temperature field become large, exceeding 200 W/m^2 . It should be noted that the two sources of error are not linear. The discrepancy between the total RMS difference (Figure 12a) and the sum of the RMS differences arising from the two error sources (Figures 12b and 12c) is shown in Figure 12d. Nonlinear effects are small in the subtropics but exceed 100 W/m^2 in the Labrador Sea”
Hadfield, R. E., et al. 2007 “On the accuracy of North Atlantic temperature and heat storage fields from Argo.” Journal of Geophysical Research: Oceans
http://www.rsmas.miami.edu/users/mocha/mocha_pubs/hadfield_etal_07_jgr.pdf
So? What was NOAA’s response?
“Measurements of the ocean’s temperature cannot, repeatedly, measure the exact same bit of ocean.”
All the better — more coverage.
If you don’t think ocean scientists take this, or noise, into account, you really need to read some of their papers.
“By what mechanism did Mannkind’s CO2 emissions heat this really deep water, and manage to not heat the lower troposphere for the last 18 years, and barely budge the surface-thermometer-record?”
Wrong about the surface: It has warmed 0.22 (0.40 F) in 18 years, not “barely budged.” Historically this is a large rate of warming — much faster than when the Earth warmed from its last icy period 25000 yrs ago.
I don’t think anyone understands what’s going on in the troposphere, or even if the data are correct. (The models used to calculate temperatures are quite complicated.) Here’s the leader of one of the satellite groups:
Carl Mears, leader of the RSS satellite group, Sept 2014:
“Does this slow-down in the warming mean that the idea of anthropogenic global warming is no longer valid? The short answer is ‘no’. The denialists like to assume that the cause for the model/observation discrepancy is some kind of problem with the fundamental model physics, and they pooh-pooh any other sort of explanation. This leads them to conclude, very likely erroneously, that the long-term sensitivity of the climate is much less than is currently thought.
“The truth is that there are lots of causes besides errors in the fundamental model physics that could lead to the model/observation discrepancy. I summarize a number of these possible causes below. Without convincing evidence of model physics flaws (and I haven’t seen any), I would say that the possible causes described below need to be investigated and ruled out before we can pin the blame on fundamental modelling errors.”
“A similar, but stronger case can be made using surface temperature datasets, which I consider to be more reliable than satellite datasets….”
http://www.remss.com/blog/recent-slowing-rise-global-temperatures
Deflection.
By what mechanism did Mannkind’s emissions heat this really deep, REALLY OLD water?
DA, do you understand radioactive tracers in ocean currents?
The balloon radiosondes aren’t complicated, and the satellite tropospheric temperatures agree with the balloons, just fine.
”The result is that the satellite temperature measurements are accurate to within three one-hundredths of a degree Centigrade (0.03 C) when compared to ground-launched balloons taking measurements of the same region of the atmosphere at the same time.”
http://science.nasa.gov/science-news/science-at-nasa/1997/essd06oct97_1/
”Changes in temperature observed in surface data records are corroborated by measurements of temperatures below the surface of the ocean, by records of temperatures in the troposphere recorded by satellites and weather balloons, in independent records of air temperatures measured over the oceans and by records of sea-surface temperatures measured by satellites.”
http://www.metoffice.gov.uk/climate-guide/science/temp-records
Radiosondes and satellites show same tropospheric changes. Reanalysis shows more warming:
http://davidappell.blogspot.com/2015/07/interesting-graphs-from-noaas-press.html
The problem is, people keep finding errors in UAH’s algorithm.
A decade ago it was the diurnal correction — Christy and Spencer made a sign error, but resisted all efforts to point this out for several years.
Recently a significant cold bias was found in their TMT data:
http://www.atmos.washington.edu/~qfu/Publications/jtech.pochedley.2012.pdf
http://journals.ametsoc.org/doi/abs/10.1175/JTECH-D-12-00131.1
Christy and Spencer don’t share their algorithms or code, so no one really knows what they’re up to….
You forgot ‘tropical’ … TMT tropical.
Po-Chedley, Stephen, Tyler J. Thorsen, and Qiang Fu 2014. “Removing diurnal cycle contamination in satellite-derived tropospheric temperatures: Understanding tropical tropospheric trend discrepancies.” Journal of Climate
A bias in their tropical TMT data means a bias in their global TMT data.
Also a bias in the warm target factor:
“A Bias in the Midtropospheric Channel Warm Target Factor on the NOAA-9 Microwave Sounding Unit,” STEPHEN PO-CHEDLEY AND QIANG FU, JOURNAL OF ATMOSPHERIC AND OCEANIC TECHNOLOGY VOLUME 29 (2012).
http://www.atmos.washington.edu/~qfu/Publications/jtech.pochedley.2012.pdf
Po-Chedley et al have identified important biases in the satellite data that aren’t being corrected for.
Refresh my memory of Po Chedley … at what point does he show that TMT Tropical in turn affects other regions?
I don’t know exactly. You’d have to read his papers.
He didn’t. Po Chedley addresses the TMT, and only in the tropical band. The missing ‘hot spot’ is in the TTT and TLS territory (up 10km) and the satellites show no warming in that region.
Nothing in his papers make any accusation of any other problem with the satellite readings in any other altitude region, or latitude bands. You insinuation of Po Chedley finding “significant problems” is absurd.
The first link you gave was written by Roy Spencer. So pardon me if I don’t accept it at face value. You shouldn’t either.
“Mannkind’s increase in CO2 emissions has apparently caused the oceans to “eat all the global warming” at 3000m?”
Whoever wrote this, it wasn’t me.
VooDude: Why don’t you try reading the papers you cite?
Wunsch and Heinbach wrote:
“In the global average, changes in heat content below 2000 m are
roughly 10% of those inferred for the upper ocean over the 20-yr period.”
1) That’s positive
2) That’s much smaller than upper ocean warming.
Read on, then.
You cited Line 15: “In the global average, changes in heat content below 2000 m are roughly 10% of those inferred for the upper ocean over the 20 year-period.”
Is that, as you say, “positive”? …or is that just the magnitude of changes …?? Perhaps that is clarified by the parenthetical injection, observed on line 355:
Line 355: “Of that total amount, approximately 10% is the contribution (a cooling) from below 2000 m…”
167 ”The ocean is dominated by the very cold, intermediate salinity values of the vast abyssal interior, and a calculation of net heat content change requires measurements of this cold-water sphere with volume averages precisions consistent with Table 1.”
288 ”The western Atlantic and sectors of the deep Southern Ocean display a warming, with the remainder of the ocean either cooling (northwestern Indian Ocean, eastern basin of the Atlantic) or little or no change (the great bulk of the Pacific).”
317 ”In a formal sense, the apparent trends show a warming in the upper ocean and a net cooling below 2000 m.”
460 ”A very weak long-term cooling is seen over the bulk of the rest of the ocean below that depth, including the entirety of the Pacific and Indian Oceans, along with the eastern Atlantic Basin. The pattern below 3600 m is similar, with much smaller amplitude. These results differ in detail and in numerical values from other estimates, but the determining whether any are “correct” is probably not possible with the existing data sets.”
https://uploads.disquscdn.com/images/4ccb09c6329c95eb78e10e9638eabf6f76a413a0ed023a5b7b543824d53eeeda.jpg
You have to combine what you learned in the previous post, from the diagram of the AMOC, which shows the deep, cold current at 1,700m and deeper…
https://uploads.disquscdn.com/images/a4d6bbc865bfa887e441c3470b1c702aed2408feffd312b58a46155f4baa56be.jpg
Maybe this will help.
Average depth:
Arctic Ocean 1,050m-1,205m
Atlantic Ocean 3,300-3,646m
Indian Ocean 3,900-3,741m
Pacific Ocean 4,300-4,080m (10,924 in the trench)
If you have a point, then state it.
DA, you have such a short attention span.
Argo floats are insufficient to detect and measure the tiny little supposed “warming” of about ¾W/m^2.
Argo’s record is too short to prove anything …
Argo is inaccurate, infrequent, and too sparse to support the claim.
Argo doesn’t go deep enough to quantify the cold waters. Argo misses the formation of North Atlantic’s coldest waters (DSOW),
https://uploads.disquscdn.com/images/062fc291be6f61450da78892e8fa6405f3f59a63c6dce2084834358051968c55.jpg
Argo is too sparse in the Northern Polar regions
https://uploads.disquscdn.com/images/ff01c62b5ccd8f1ec3770a4248f09cbb6d4ff6aeb0def1261c98142904465320.jpg
and misses the Antarctic (AABW) formation, entirely.
https://uploads.disquscdn.com/images/969514b34b3c7426a2d18c17b7b1b35307523b5bcdb5ed5481c676995f2c403a.jpg
https://uploads.disquscdn.com/images/2b0d1da8c7f7fdc1f8f50635fda0a8c7be67f396bdc5c1e0178b75e111f8f1c6.jpg
So, DA, your claim of
… is unsupported. Just rash, alarm-ism.
https://uploads.disquscdn.com/images/aaae0ee1d03e82aff5048656cd0311dc480bc112d6db274583ff16b10dbc8ace.jpg
https://disqus.com/home/discussion/climatedepot/no_global_warming_at_all_for_18_years_9_months_a_new_record_8211_the_pause_lengthens_again_just_in_t/#comment-2389291576
“Argo’s record is too short to prove anything …”
Prove it. Let’s see your math on that claim.
“Argo doesn’t go deep enough to quantify the cold waters.”
Those deep waters take ~1500 yrs to complete one cycle. They gain/lose heat when they surface then, and otherwise are ancient water. That is, they don’t gain much heat at all.
Nonetheless, they too are slowly gaining heat:
Deep ocean heat content changes estimated from observation and reanalysis product and their influence on sea level change
Kouketsu et al, GRL v116 (March 2011)
http://onlinelibrary.wiley.com/doi/10.1029/2010JC006464/abstract
Carl Wunsch and Patrick Heimbach, 2014: Bidecadal Thermal Changes in the Abyssal Ocean. J. Phys. Oceanogr., 44, 2013–2030.
doi: http://dx.doi.org/10.1175/JPO-D-13-096.1
Says: “For 1992-2011…. In the global average, changes in heat content below 2000 m are roughly 10% of those inferred for the upper ocean over the 20-yr period.”
Neither paper you cite uses Argo.
By your own account, that means it was warm enough, 1,500 years ago to heat the ocean … warmer than it was before; ie not Mannkind’s fault. Nothing to do with CO2 emissions.
So you cite Wunce & Heimbach 2014? The folks who said:
288 ”The western Atlantic and sectors of the deep Southern Ocean display a warming, with the remainder of the ocean either cooling (northwestern Indian Ocean, eastern basin of the Atlantic) or little or no change (the great bulk of the Pacific).”
293 ”At all depths, but particularly in the upper ocean, regions of warming are at least partially compensated in the global integrals by extended regions of cooling (especially the tropical Pacific … and North Atlantic subtropical gyre). These patterns emphasize the problem of having adequate spatial sampling to generate mean values consistent with the accuracies [claimed] in Table 1.”
317 ”In a formal sense, the apparent trends show a warming in the upper ocean and a net cooling below 2000 m.”
355 ”Of that total amount, approximately 10% is the contribution (a cooling) from below 2000 m”
460 ”A very weak long-term cooling is seen over the bulk of the rest of the ocean below that depth, including the entirety of the Pacific and Indian Oceans, along with the eastern Atlantic Basin. The pattern below 3600 m is similar, with much smaller amplitude. These results differ in detail and in numerical values from other estimates, but the determining whether any are “correct” is probably not possible with the existing data sets.”
Comment in Figure 14: ”The strong spatial structure represents a major observational challenge to determining an accurate mean change.” Insufficient accuracy to conclude ¾W/m^2 of warming.
”Recent observationally based estimates… closer to 0.5 W/m^2, exacerbating the detection problem.”
Notice that – Wunce & Heimbach 2014 says that there is a detection problem.
”The major observational obstacle to understanding the role of the ocean in climate is the extreme brevity of the instrumental record…”
”Even in this recent period, major spatial and temporal inhomogeneities exist in these and related data.”
”At the present time, the Argo array …is confined to the upper 2000m and with the bulk of the extant values above 1000 m.”
”Most of the available abyssal measurements are sparse … sometimes designed to depict special regions ”
”Much of the recent literature focuses on the ability to detect past and ongoing trends in ocean temperatures and heat content. The reality and magnitude of such changes is not the central goal here; rather it is to characterize the extent to which more general variability can be detected using the much more dense observational system of the last 10–20 yr. On the other hand, some order of magnitude numerical values are helpful for context.”
”Estimating the global average change is especially challenging and here is only a by-product.”
”About 52% of the ocean lies below 2000m and about 18% below 3600m.”
”…many papers have been published that simply assume no significant changes have taken place in the deep ocean over the historical period.”
https://uploads.disquscdn.com/images/81b5d5a9a5797038deba96ba96957b6a6142a6a5366fe1ca141a3b555502d89d.jpg
Notice the deep-blue polar areas … read the scale – they are LOOSING heat. Again, where is the Argo array sparse? In the polar regions, especially.
Shinya Kouketsu 2011 et al. said they detected
Large temperature increases … around Antarctica … notice again, the deep blue around the polar regions (graphic, above)…
Kouketsu 2011 admits, “… the actual temporally and spatially sparse observations … although the uncertainty is large.…”
“[7] Furthermore, the uncertainty of previous estimates of HC changes in the deep ocean, especially that due to temporal variability, is not clear … because most WHP sections were surveyed only twice, it is difficult to evaluate the uncertainty due to temporal variability using only the observational data.” Insufficient accuracy to conclude ¾W/m^2 of warming.
The temperature at these depths does not change much … so what needs to be checked, more accurately, is the volume of these cold waters. Measurements of volume require the utmost accuracy of the measured depths … Kouketsu 2011 says, “[11] The WHP and revisit cruises were designed to take observations at the same locations. However, slight differences exist in station locations and in the maximum depth of the observations.”
“[14] The available observational data in the deep ocean are too sparse to determine the temporal variability. … the magnitude of the variability is unclear and the aliasing effect in the analysis used to describe the long-term changes may not be negligible. Furthermore, estimation with spatially sparse observations can cause a bias in the calculation of HC changes.”
“…the Earth Simulator at JAMSTEC [was used] to derive an ocean state estimate for the period from 1957 to 2006.”
Do you realize how inaccurate and sparse the data was, back in 1957? Insufficient accuracy to conclude ¾W/m^2 of warming.
Right, ARGO doesn’t (yet) go below 2000 meters.
But others measurements have been done, such as the paper I cited. Read it.
I have read it. I have critiqued it. It does not support you.
You cite Wunce & Heimbach 2014? “COOLING” is mentioned eight times in that paper. You’re citing the folks who said:
288 ”The western Atlantic and sectors of the deep Southern Ocean display a warming, with the remainder of the ocean either cooling (northwestern Indian Ocean, eastern basin of the Atlantic) or little or no change (the great bulk of the Pacific).”
293 ”At all depths, but particularly in the upper ocean, regions of warming are at least partially compensated in the global integrals by extended regions of cooling (especially the tropical Pacific … and North Atlantic subtropical gyre). These patterns emphasize the problem of having adequate spatial sampling to generate mean values consistent with the accuracies [claimed] in Table 1.”
317 ”In a formal sense, the apparent trends show a warming in the upper ocean and a net cooling below 2000 m.”
355 ”Of that total amount, approximately 10% is the contribution (a cooling) from below 2000 m”
460 ”A very weak long-term cooling is seen over the bulk of the rest of the ocean below that depth, including the entirety of the Pacific and Indian Oceans, along with the eastern Atlantic Basin. The pattern below 3600 m is similar, with much smaller amplitude. These results differ in detail and in numerical values from other estimates, but the determining whether any are “correct” is probably not possible with the existing data sets.”
Comment in Figure 14: ”The strong spatial structure represents a major observational challenge to determining an accurate mean change.” Insufficient accuracy to conclude ¾W/m^2 of warming.
”Recent observationally based estimates… closer to 0.5 W/m^2, exacerbating the detection problem.”
Notice that – Wunce & Heimbach 2014 says that there is a detection problem.
”The major observational obstacle to understanding the role of the ocean in climate is the extreme brevity of the instrumental record…”
”Even in this recent period, major spatial and temporal inhomogeneities exist in these and related data.”
”At the present time, the Argo array …is confined to the upper 2000m and with the bulk of the extant values above 1000 m.”
”Most of the available abyssal measurements are sparse … sometimes designed to depict special regions ”
”Much of the recent literature focuses on the ability to detect past and ongoing trends in ocean temperatures and heat content. The reality and magnitude of such changes is not the central goal here; rather it is to characterize the extent to which more general variability can be detected using the much more dense observational system of the last 10–20 yr. On the other hand, some order of magnitude numerical values are helpful for context.”
”Estimating the global average change is especially challenging and here is only a by-product.”
”About 52% of the ocean lies below 2000m and about 18% below 3600m.”
”…many papers have been published that simply assume no significant changes have taken place in the deep ocean over the historical period.”
https://uploads.disquscdn.com/images/81b5d5a9a5797038deba96ba96957b6a6142a6a5366fe1ca141a3b555502d89d.jpg
Notice the deep-blue polar areas … read the scale – they are LOOSING heat. Again, where is the Argo array sparse? In the polar regions, especially.
Shinya Kouketsu 2011 et al. said they detected
Large temperature increases … around Antarctica … notice again, the deep blue around the polar regions (graphic, above)…
Kouketsu 2011 admits, “… the actual temporally and spatially sparse observations … although the uncertainty is large.…”
“[7] Furthermore, the uncertainty of previous estimates of HC changes in the deep ocean, especially that due to temporal variability, is not clear … because most WHP sections were surveyed only twice, it is difficult to evaluate the uncertainty due to temporal variability using only the observational data.” Insufficient accuracy to conclude ¾W/m^2 of warming.
The temperature at these depths does not change much … so what needs to be checked, more accurately, is the volume of these cold waters. Measurements of volume require the utmost accuracy of the measured depths … Kouketsu 2011 says, “[11] The WHP and revisit cruises were designed to take observations at the same locations. However, slight differences exist in station locations and in the maximum depth of the observations.”
“[14] The available observational data in the deep ocean are too sparse to determine the temporal variability. … the magnitude of the variability is unclear and the aliasing effect in the analysis used to describe the long-term changes may not be negligible. Furthermore, estimation with spatially sparse observations can cause a bias in the calculation of HC changes.”
“…the Earth Simulator at JAMSTEC [was used] to derive an ocean state estimate for the period from 1957 to 2006.”
Do you realize how inaccurate and sparse the data was, back in 1957? Insufficient accuracy to conclude ¾W/m^2 of warming.
Let me again quote that paper’s conclusion:
Carl Wunsch and Patrick Heimbach, 2014: Bidecadal Thermal Changes in the Abyssal Ocean. J. Phys. Oceanogr., 44, 2013–2030.
doi: http://dx.doi.org/10.1175/JPO-D-13-096.1
“For 1992-2011…. In the global average, changes in heat content below 2000 m are roughly 10% of those inferred for the upper ocean over the 20-yr period.”
DA, have you read any further than the Abstract? What you quote isn’t in the “conclusions”
https://uploads.disquscdn.com/images/442d0f60b7637ce58e00385023057cd506f7eaa9dd991970fcfe69514396f1cc.jpg
Wunsch, Carl, and Patrick Heimbach 2014 “Bidecadal thermal changes in the abyssal ocean.” Journal of Physical Oceanography
http://ocean.mit.edu/~cwunsch/papersonline/heatcontentchange_26dec2013_ph.pdf
https://uploads.disquscdn.com/images/de500d1955add12f96bd547c19e9fe08a9f07643b294642c2c51cfc587c18b97.jpg
What’s in the abstract is what’s in the paper. Of course.
https://uploads.disquscdn.com/images/442d0f60b7637ce58e00385023057cd506f7eaa9dd991970fcfe69514396f1cc.jpg “…changes in heat content…” Not increase, not decrease, but changes… https://uploads.disquscdn.com/images/de500d1955add12f96bd547c19e9fe08a9f07643b294642c2c51cfc587c18b97.jpg
They clarify the changes in heat content…
“…10%…(a cooling) from below 2000 m…’
We can all quote OTHER papers from your church saying pot’s like heroin. Any Hillbilly can write a paper, the POINT is that 99.999% of them mean NOTHING.
Point out how yours is much more well detailed and chronicled than all the others, and who has replicated your paper’s conclusions in physical experiment.
If it isn’t verified by being repeated by multiple people, it’s fake.
Just like your church’s claim Pot is like Heroin.
Pot’s not like heroin, and your church’s leadership admitted it stopped warming in 1998, YEARS ago in exchange for not being jailed.
World’s #1 climatologist Phiddlin’ Phil Jones:
‘The scientific community would come down on me in no uncertain terms if I said
THE WORLD COOLED SINCE 1998. OK IT HAS… but it isn’t but seven years data and it isn’t statistically significant.”
Jones in 2010: fesses up to STAY OUT of JAIL:
BBC: IS it TRUE there’s been NO WARMING SINCE 1995?
JONES: Yes. I have done the math and find there has been no warming since 1995.
BBC: is it TRUE there has been COOLING since 2002?
JONES: I have done the math and although the trend is not statistically significant, there has been slight not statistically significant, COOLING.
Jones was STILL demoted for not admitting the world COOLED since 1 9 9 8.
Aug 2013 the world’s #1 CLIMATOLOGY org after DEMOTING JONES, issues a Press release
ADMITTING: TEMPS have relatively FLAT since 1998. (Relatively Flat is the slight, not statistically significant COOLING we see Jones admit multiple times)
”The Recent Pause In Warming”
July 2013 – Global mean surface temperatures
rose rapidly from the 1970s, but have been relatively flat over the
most recent 15 years to 2013. This has prompted speculation that human
induced global warming is no longer happening, or at least will be much
smaller than predicted. Others maintain that this is a temporary pause
and that temperatures will again rise at rates seen previously.
The Met Office Hadley Centre has written three reports that
address the recent pause in global warming and seek to answer the
following questions:
What have been the recent trends in other indicators of climate over this period?
What are the potential drivers of the current pause?
How does the recent pause affect our projections of future climate?
What PAUSE in WARMING? the ONE since 1998.
Your church’s claims are as ludicrous and worthless as their reputations. And yours.
You won’t see ARGO floats reporting from most areas in the white-line areas, which are mostly on the edges of continents. Argo floats don’t do the shallow areas … but the white line area is the boundary between warming and cooling, so the ARGO floats mostly never report on the neutral zone.
https://uploads.disquscdn.com/images/81b5d5a9a5797038deba96ba96957b6a6142a6a5366fe1ca141a3b555502d89d.jpg
Argo floats don’t do shallow seas, or coastal areas. The red area is covered by Argo. The black, is land. The other two colors – ocean areas that are not covered by Argo. https://uploads.disquscdn.com/images/0a2fa9f5297a9efcc9987223e908162e0ec5b94361225d30548b1de6bdad2def.jpg
Roemmich, Dean, 2013
http://ceres.larc.nasa.gov/documents/STM/2013-10/14_Global_averages.pdf
So, what do they do with the areas not profiled by Argo? They guess. They ASSUME. ”…how these observational gaps are infilled [Gregory et al., 2004]… but implementations differ. For example, Ishii et al. [2003, 2006], Ishii and Kimoto [2009], and Levitus et al. [2000, 2005, 2009, 2012] assume an initial guess of zero temperature anomaly in unsampled areas (e.g., relax toward climatological values), whereas Lyman et al. [2010] and Johnson et al. [2012, 2013] assume that the mean anomaly of sampled areas is representative of unsampled areas for global integrals [Lyman and Johnson, 2008]. Willis et al. [2004], Guinehut et al. [2004], Lombard et al. [2006], and Johnson et al. [2012, 2013] (for their global maps) infill in situ gaps based on spatially variable linear regressions with satellite altimeter sea level, but this is only possible from 1993 onward.”
”Palmer et al. [2007], von Schuckmann and Le Traon [2011], and Gouretski et al. [2012] calculate area-weighted anomaly averages within (2° × 2° or 5° × 5°, respectively) grid boxes, and sum the results, to derive global estimates. While unsampled grid boxes in von Schuckmann and LeTraon [2011] and Gouretski et al. [2012] have zero anomaly, Palmer et al. [2007] apply the averaged anomaly of sampled areas to the unsampled grid boxes, similar to the representative average approach of Lyman and Johnson [2008].”
”…(derived from satellite altimeter sea level measurements) is combined with thermal expansion observations to produce spatially complete fields from 1950 onward. OHC 0–700 m is then subsequently estimated based on spatially variable linear regressions with thermal expansion.”
Abraham, J. P., et al. 2013 “A review of global ocean temperature observations: Implications for ocean heat content estimates and climate change.” Reviews of Geophysics
http://www.aoml.noaa.gov/phod/docs/Abraham_etal_2013.pdf
If there has been no warming, why is your graph showing above temperatures above the mean? Above average means warmer.
Denialist!
Don’t be childish. There has been no warming for 18 years 9 months on the RSS dataset, or 18 years 6 months on the UAH dataset. The matter is one of straightforward calculation using least-squares linear-regression analysis, which will be found in any textbook of elementary statistics.
You might find this comment, and following ones, interesting.
https://andthentheresphysics.wordpress.com/2015/11/15/what-is-it-with-journalists-and-agw/#comment-66954
The article and thread are interesting -https://andthentheresphysics.wordpress.com/2015/11/15/what-is-it-with-journalists-and-agw/#comments
Exxon knew about man made Climate Change decades ago, then just like big tobacco did, in order to prolong their profits started spending money to finance the blogs, opinion pieces, political campaigns, and think tanks to promote anti-science and cause doubt in folks minds and delay action.
http://insideclimatenews.org/content/Exxon-The-Road-Not-Taken
Your article is Horse sheet. Satellites say it hasn’t warmed in almost 20 years. Why are you a satellite data denier. Why are you an Arctic Sea Ice Denier. Why are you a denier that Anatractica has been gaining ice?
Have you read Hansen, et. al 1981 yet? No. Why not?
BECAUSE YOU ARE A LAZY RACIST BEETCH of a DEMOKKKrat
Monckton is BS and even Exxon knows it. https://www.youtube.com/watch?v=C3giRaGNTMA&list=PL82yk73N8eoX-Xobr_TfHsWPfAIyI7VAP&index=20
Your article is Horse sheet. Satellites say it hasn’t warmed in
almost 20 years. Why are you a satellite data denier. Why are you an
Arctic Sea Ice Denier. Why are you a denier that Anatractica has been
gaining ice?
Have you read Hansen, et. al 1981 yet? No. Why not?
BECAUSE YOU ARE A LAZY RACIST BEETCH of a DEMOKKKrat…..
Here, again. https://www.youtube.com/watch?v=fpF48b6Lsbo&index=19&list=PL82yk73N8eoX-Xobr_TfHsWPfAIyI7VAP
Your article is Horse sheet. Satellites say it hasn’t warmed in
almost 20 years. Why are you a satellite data denier. Why are you an
Arctic Sea Ice Denier. Why are you a denier that Anatractica has been
gaining ice?……………….
Have you read Hansen, et. al 1981 yet? No. Why not?
BECAUSE YOU ARE A LAZY RACIST BEETCH of a DEMOKKKrat
https://www.youtube.com/watch?v=fbW-aHvjOgM&index=17&list=PL82yk73N8eoX-Xobr_TfHsWPfAIyI7VAP
Becaus you are to stupid. Your video is Horse sheet. Satellites say it hasn’t warmed in
almost 20 years. Why are you a satellite data denier. Why are you an
Arctic Sea Ice Denier. Why are you a denier that Anatractica has been
gaining ice?…
Have you read Hansen, et. al 1981 yet??? No. Why not? BECAUSE YOU CANT READ>
BECAUSE YOU ARE A LAZY RACIST BEYOTTCH of a DEMOKKKrat.??
Better BS. https://www.youtube.com/watch?v=fbW-aHvjOgM&index=17&list=PL82yk73N8eoX-Xobr_TfHsWPfAIyI7VAP
More BS. Even Exxon knew about man made Climate Change decades ago, then just like big tobacco did, in order to prolong their profits started spending money to finance the blogs, opinion pieces, political campaigns, and think tanks to promote anti-science and cause doubt in folks minds and delay action.
http://insideclimatenews.org/content/Exxon-The-Road-Not-Taken
Even Google says you are just a bunch of liars, hurting our children and our grandchildren and making the world a much worse place.
Google’s chairman, Eric Schmidt…
“The facts of climate change are not in question anymore. Everyone understands climate change is occurring, and the people who oppose it are really hurting our children and our grandchildren and making the world a much worse place. And so we should not be aligned with such people — they’re just, they’re just literally lying.”
http://www.theguardian.com/environment/2014/sep/23/google-to-cut-ties-with-rightwing-lobby-group-over-climate-change-lies
Becaus you are to stupid. Your video is Horse sheet. Satellites say it hasn’t warmed in
almost 20 years. Why are you a satellite data denier. Why are you an
Arctic Sea Ice Denier. Why are you a denier that Anatractica has been
gaining ice?…
Have you read Hansen, et. al 1981 yet??? No. Why not? BECAUSE YOU CANT READ>
BECAUSE YOU ARE A LAZY RACIST BEYOTTCH of a DEMOKKKrat.!!!!
Here is better BS from your leader. https://www.youtube.com/watch?v=fbW-aHvjOgM&index=17&list=PL82yk73N8eoX-Xobr_TfHsWPfAIyI7VAP
Even Exxon knew about man made Climate Change decades ago, then just like big tobacco did, in order to prolong their profits started spending money to finance the blogs, opinion pieces, political campaigns, and think tanks to promote anti-science and cause doubt in folks minds and delay action.
http://insideclimatenews.org/content/Exxon-The-Road-Not-Taken
Even Google says you are just a bunch of liars, hurting our children and our grandchildren and making the world a much worse place.
Google’s chairman, Eric Schmidt…
“The facts of climate change are not in question anymore. Everyone understands climate change is occurring, and the people who oppose it are really hurting our children and our grandchildren and making the world a much worse place. And so we should not be aligned with such people — they’re just, they’re just literally lying.”
http://www.theguardian.com/environment/2014/sep/23/google-to-cut-ties-with-rightwing-lobby-group-over-climate-change-lies
Becaus you are to stupid. Your video is Horse sheet. Satellites say it hasn’t warmed in
almost 20 years. Why are you a satellite data denier. Why are you an
Arctic Sea Ice Denier. Why are you a denier that Anatractica has been
gaining ice?…
Have you read Hansen, et. al 1981 yet??? No. Why not? BECAUSE YOU CANT READ>
BECAUSE YOU ARE A LAZY RACIST BEYOTTCH of a DEMOKKKrat.!!!!!!
Here is your leader in action: https://www.youtube.com/watch?v=fbW-aHvjOgM&index=17&list=PL82yk73N8eoX-Xobr_TfHsWPfAIyI7VAP
It’s tough on a denier now. Even Exxon knows your BS is BS. https://www.youtube.com/watch?v=C3giRaGNTMA&index=20&list=PL82yk73N8eoX-Xobr_TfHsWPfAIyI7VAP
Becaus you are to stupid. Your video is Horse sheet. Satellites say it hasn’t warmed in
almost 20 years. Why are you a satellite data denier. Why are you an
Arctic Sea Ice Denier. Why are you a denier that Anatractica has been
gaining ice?…
Have you read Hansen, et. al 1981 yet??? No. Why not? BECAUSE YOU CANT READ!!!
BECAUSE YOU ARE A LAZY RACIST BEYOTTCH of a DEMOKKKrat.
Even Exxon knows your BS is BS. https://www.youtube.com/watch?v=C3giRaGNTMA&index=20&list=PL82yk73N8eoX-Xobr_TfHsWPfAIyI7VAP
Becaus you are to stupid. Your video is Horse sheet. Satellites say it hasn’t warmed in
almost 20 years. Why are you a satellite data denier. Why are you an
Arctic Sea Ice Denier. Why are you a denier that Anatractica has been
gaining ice?…
Have you read Hansen, et. al 1981 yet??? No. Why not? BECAUSE YOU CANT READ>
BECAUSE YOU ARE A LAZY RACIST BEYOTTCH of a DEMOKKKrat.@
If you are so cock sure of your claim, why not bring forward the quote and citation to the ipcc report that says that?
Try reading the technical note appended to the head posting, which explains exactly in what fashion the IPCC made its predictions in 1990, and on what pages, and with what graphs, and on the basis of what assumptions about forcing. It’s all there, carefully, properly and completely cited. Just read it and think, rather using your paid-troll technique of pretending the citations are not there. They are. Grow up.
Quote it in the nearly infinitely large space below…..
“…paid-troll technique of pretending the citations are not there. They are.”
What we are seeing is more obfuscation.
Asked and answered. Read the head posting, and don’t whine till you’ve read it. You’ve been commenting on it all this time without even having read it, a despicable technique that is entirely characteristic of the paid climate-Communist troll who is not in the least interested in the truth.
And the truth is that in 1990 IPCC predicted 1.0 [0.7, 1.5] degrees’ warming, in a near-straight line, from then to 2025, implying about 0.72 degrees’ warming by now. Instead, there has been 0.27 degrees’ warming – little more than a third of what the IPCC had predicted in 1990. For all the necessary references, just read the head posting, and don’t be childish. You do neither yourself nor your hateful cause any good by behaving like a three-year-old tossing its toys out of the stroller.
I wonder how the claims, projections, predictions, assertions the denialists were making in 1990 have panned out.
What predictions? Please provide citations.
My first prediction was made in November 2006. I said that, though some global warming was to be expected, on balance there would not be very much. In the 107 months since then, according to the mean of the three longest-standing terrestrial and two satellite datasets, there has been one-seventh of a Celsius degree of warming. I’d say I called that one about right.
“My first prediction ” isn’t the same as , “..predictions, assertions the denialists…”
Do you think you are the only denialist?
What we are seeing is either willful misdirection or a reading comprehension isue.
If the former , then we have just more evidence of how rhetoric is being used in your postings.
And I don’t see much evidence of the latter.
I have asked for evidence and citations concerning predictions by those of whom you use the hate-speech term “denialists” in 1990. You seem unable to provide even a single instance. Given how often your standard climate-Communist technique is to demand references even when they have been supplied to you in plenty, you seem to be operating a disfiguring double standard in being unable to supply any references of your own when requested.
One takes it that the predictions made by those who were then skeptics (I did not revisit the subject myself till 2006, having formerly advised HM Government that the scientists were beginning to express concern and that the science should be studied) were in fact right on the button, and you are unwilling to admit that.
Says the boy that works for the killers at Heartland.
Your article is Horse sheet. Satellites say it hasn’t warmed in
almost 20 years. Why are you a satellite data denier. Why are you an
Arctic Sea Ice Denier. Why are you a denier that Anatractica has been
gaining ice?
Have you read Hansen, et. al 1981 yet? No. Why not?
BECAUSE YOU ARE A LAZY RACIST BETCH of a DEMOKKKrat/
Asked and answered but here you go. https://www.youtube.com/watch?v=fpF48b6Lsbo&index=19&list=PL82yk73N8eoX-Xobr_TfHsWPfAIyI7VAP
Your article is Horse sheet. Satellites say it hasn’t warmed in
almost 20 years. Why are you a satellite data denier. Why are you an
Arctic Sea Ice Denier. Why are you a denier that Anatractica has been
gaining ice?…
Have you read Hansen, et. al 1981 yet? No. Why not?………..
BECAUSE YOU ARE A LAZY RACIST BEETCH of a DEMOKKKrat
BS is BS. Here you go. https://www.youtube.com/watch?v=fbW-aHvjOgM&index=17&list=PL82yk73N8eoX-Xobr_TfHsWPfAIyI7VAP
When will the paid climate-Communist trolls learn that, when the data show what I demonstrate that they show, it doesn’t matter whether it is I or anyone who says what the data show. The data show that the rate of global warming since 1990 is well below even the least estimate then made by the IPCC. The IPCC itself has accepted this, and has all but halved its medium-term warming projections since then. Of course it is hard for the climate Communists who are paid not to understand these things that the science is so unsettled that the IPCC has been compelled to make that drastic downward revision, which occurred between the pre-final and final drafts of the Fifth Assessment Report. So get used to the idea that if you ignore the facts it is no use pleading that you have the right to ignore them because I am among those who point the facts out. That is not science.
BS. https://www.youtube.com/watch?v=fbW-aHvjOgM&index=17&list=PL82yk73N8eoX-Xobr_TfHsWPfAIyI7VAP
Your article is Horse sheet. Satellites say it hasn’t warmed in
almost 20 years. Why are you a satellite data denier. Why are you an
Arctic Sea Ice Denier. Why are you a denier that Anatractica has been
gaining ice?…….
Have you read Hansen, et. al 1981 yet? No. Why not?
BECAUSE YOU ARE A LAZY RACIST BEETCH of a DEMOKKKrat
BS is just BS. https://www.youtube.com/watch?v=fbW-aHvjOgM&index=17&list=PL82yk73N8eoX-Xobr_TfHsWPfAIyI7VAP
Another childishly-repeated link to a non-scientific, unauthoritative, inept source. Try having a go at addressing the data actually shown in the head posting. Oh, I forgot: you are entirely incapable of maintaining a rational argument, for you have no intention to reach the truth.
Meanwhile, whether you or any of the other futile climate Communists who infest these sites like it or not, the world will inexorably continue to warm – if at all – at a rate well below the official estimates given in the Holy Books of IPeCaC, to which you cravenly kowtow. One day, you may learn how to think for yourself, how to do your own research rather than latching on to fellow climate-Communists’ long-discredited and outdated talking-points.
The predicted warming is not happening. The predicted disasters are not occurring. The message was overblown. And the more you behave like a cowardly, spoiled child, sniveling behind a curtain in the hope of not being identified, you will have wasted the hours you are paid to spend trolling these sites and frightening off those who might otherwise voice more openly their increasing disagreement with the manic panic you had hoped to provoke. The game’s up: go and do something more useful with your miserable, inconsequential little life.
You are a non-scientist lying piece of humanity. The emerging story of what Exxon knew, and when they knew it, shows that the differences have never really been about the science questions – even the major oil companies knew the basic science truths 4 decades ago. They simply made a moral decision that the lives of the next ten thousand generations of human beings were not as important as their own profits, and we are now witnessing the early impacts of that decision.
The deniers are just immoral creatures with no values that are willing do people harm, even let people die, as long as there is profit to be made. These people are the most vile among us, with no motivation other than greed and profit.
Exxon Mobil is off topic. I have no connection with them, and, even if I did, that would not alter the data in the head posting, which are being circulated all over the world by those whom you cannot reach, bully or buy. Those data show no global warming for 18 years 9 months, notwithstanding that one-third of all manmade forcings since 1950 have occurred since then.
BS. Who would waste time on your BS. It’s all lies from a flim flam man.
https://www.youtube.com/watch?v=fbW-aHvjOgM&list=PL82yk73N8eoX-Xobr_TfHsWPfAIyI7VAP&index=17
The myth of the pause has been debunked as many times as Monckton has been caught lying – almost. Anybody can google it.
These right wing values voters sure are messed up.
The point we have been at for decades now is that even Exxon, like Big Tobacco et al, before it, KNEW of the dangers and used profits to fund criminal sociopaths to mislead the public on the science. Even Exxon and the Koch bros with unlimited resources have been unable to produce a credible study that disproves man made climate change. In fact, both of their studies came to the same conclusion as the consensus.
The only thing they have left is to attempt to create doubt; which takes time away from creating viable methods for mitigation, adaption to lessen the damage that is coming. Intentionally delaying the process for mitigation and adaption, so that fossil fuel boys can extend their profits, is a crime that will affect people, countries and economies.
“Doubt is our product, since it is the best means of competing with the ‘body of fact’ that exists in the minds of the general public. It is also the means of establishing a controversy.” — Brown & Williamson
This should be reposted at the top.
Each time m adds a month.
Monckton wrote, “Those data show no global warming for 18 years 9 months”
Notice how this number never increases…. It is the ultimate cherry pick, which is defined as using an interval to give the result you want, whether it is representative of climate change or not.
Here, it is not.
Most paid climate Communists can’t count, and the accident-prone Appell is one among many. Last month’s chart shows no global warming for 18 years 8 months. This year’s chart shows no global warming for 18 years 9 months. That is – ah, let me ask the supercomputer – oh, yes, of course, it’s one month longer than last year’s chart. So the number that “never increases” has increased by 1 month in one month.
Indeed, one can go back three years to the Doha climate conference, at which time I told fellow-delegates there had been no global warming for 16 years. So the left-hand end of the graph has indeed shortened by three months, but the right-hand end has lengthened by three years. Hint: years are 12 times longer than months.
Furthermore, if Mr Appell were to ask Nanny to read him the head posting in words of one syl-la-ble, she would tell him, in soothing tones, that Monckton has specifically referred to the fact that the left-hand end of the graph is slowly moving closer to the present. But the point is that the right-hand end of the graph is moving rightward 12 times as fast, so that the overall effect is inexorably to lengthen the Pause.
If Mr Appell is very, very good (unlikely, on past form, one must admit), he may even be able to persuade Nanny, before she tucks him up and kisses his golden curls and puts out the big light and leaves on the night-light, to read to him the NOAA State of the Climate report in 2008, which said that a period of 15 years or more without global warming would indicate a discrepancy between prediction and reality – a discrepancy that the IPCC has admitted, by conceding that 111 of its 114 models had over-predicted temperature trends recently, and by acting on the advice of expert reviewers including me by all but halving its medium-term global warming projection. And that point, as Nanny will explain to him before she leaves the door open a crack and tiptoes out, is “representative of climate change”.
Perhaps tomorrow evening Nanny will read some more of the exciting head posting to the Appell of her eye. And she will read to him the bits where it is explained how the start date for the graphs is not cherry-picked but calculated. And if he does not interrupt too much, she will even tell him about the six-monthly updates for three major terrestrial tamperature datasets and two satellite datasets, across a variety of timescales, that I publish at WattsUpWithThat.com.
And she will tell him not to be a naughty little boy, sneering at that nice Lord Monckton, who, as she will explain, is always, always right.
Seems monckton has entered a creative writing class
“persuade Nanny, before she tucks him up and kisses his golden curls and puts out the big light “
http://nanowrimo.org
A huge cherry pick.
Such short intervals say nothing about climate — they are about the noise (natural variability).
You are, of course, entitled to your spectacularly uninformed opinion: but you are at odds with mainstream science. NOAA’s State of the Climate Report for 2008 said what I said it said: that a period of 15 years or more without warming would indicate a discrepancy between prediction and observation. If you consider that statement “a huge cherry-pick”, then get on to your fellow climate Communists at NOAA and tell them you know better than they. But don’t come whining to me about it. It’s their statement, not mine.
That you can’t debate without name calling like “Communists” shows the weakness of your position.
Is Bill Gates also a communist?
http://i100.independent.co.uk/article/bill-gates-says-that-capitalism-cannot-save-us-from-climate-change–b1xNpbL8O_x
Bill Gates is a profiteer. You are a climate Communist. You don’t tell the truth; you spout the Party Line; and when caught out in lies you go on spouting the Party Line. You called me a liar when you knew I was telling the truth. So don’t blub now that you’re being called what you are – a paid climate-Communist troll, wicked enough to lie for money. I invite anyone to look at your catastrophic interventions here and put forward any more rational explanation than that you are being paid for your bad behavior and your staggering ignorance of all aspects of elementary climatological physics, math, statistics, data, and logic.
Bill Gates knows far more than you, Monkey.
I know the science. Far, far better than you. And I”m confident enough that I don’t need to lie about my opponents to prove it.
No scientific point is disclosed. And in previous comments you have repeatedly displayed not only a fundamental ignorance of just about every relevant aspect of climatological physics, mathematics, and statistics, but also an unwillingness to acknowledge that your points have been answered. For instance, you ask where to find the ARGO bathythermograph data. I tell you, in detail, and then you ask precisely the same question again and again and again. Anyone who knew anything about the scientific method, and about civilized discourse, would not do that. Visit a doctor and check for Alzheimer’s.
Asked and answered. Only paid climate-Communist trolls cut and paste and repeat themselves like small children, chanting the Party Line with glazed eyes.
You inability to debate without demonizing your opponent speaks to your character.
I would have expected better, even from a fake Lord.
https://bbickmore.wordpress.com/lord-moncktons-rap-sheet/
You called me a liar and I called you out on it, and you’ve been whining ever since. You now link to the website of a Mormon university lecturer whose students say he is mad. Hardly an authoritative source.
You are a liar — you can’t provide evidence to support your claims.
A lying Monkton. Who really is surprised by that?
Where is your data for your claim?
You have avoided this question since the first time I asked. You’re a liar.
Yes, your 18 yrs X months is a huge cherry pick. It’s the DEFINITION of a cherry pick, which is picking the interval to get the result you want, whether it has any significance for climate or not.
Asked and answered. Don’t be boringly repetitive. If you haven’t anything new to say, be silent. The basis for calculating (not cherry-picking) the start date for each graph is made entirely explicit in the head posting. Your current comment does not address the head posting, and does not address the explanation therein given.
Monckton wrote, “Those data show no global warming for 18 years 9 months”
Why do you ignore ocean warming, where 90+% of the trapped heat goes? And why do you avoid stating that the land surface is warming, and the ocean surfac is warming?
“There, there, Appell of my eye,” says Nanny, dotingly, as she wipes a gob of snot from his cutely retrousse little nose. “Tonight when I tuck you up in your nice warm bed with your Superman pyjamas on, I’ll read you some more bits of the fascinating and exciting head posting, which has not one but three graphs all about ocean temperatures. And I’ll explain to you all about what big, grown-up scientists like Lord Monckton call “heat capacity”. And I’ll explain all about just how big the heat capacity is, and that that’s why the ocean has warmed in the entire 11-year record of the ARGO bathythermographs at a rate equivalent to just 1 degree every 430 years. And I’ll show you how the ocean heat capacity is so very, very big that even billions of those nasty Hiroshima bombs would barely be able to warm it up.”
http://nanowrimo.org
What you see here is someone who does not understand the concept of a heat versus temperature.
Did you take Physics 101?
Don’t be childish. If a fluid medium has a large heat capacity, then even a substantial change in the temperature of another fluid medium in contact with it will alter its temperature very little, especially if its heat capacity is three orders of magnitude greater than that of the fluid medium where the warming is supposed to be occurring. It seems you didn’t do Physics 101, where you would have learned the conversion between heat content (not the same thing as heat capacity) and temperature. Do try to keep up.
Wrong again, Monkie. The heat building up in the ocean means the atmosphere too will get warmer. It’s inevitable, and it’s already happening.
Don’t be silly. The heat building up in the ocean reflects itself in the rate of ocean warming, which, for the upper 1.9 km, is equivalent to only 1 K per 430 years. Not exactly a problem, now, is it? Can’t you calculate the least-squares trend on the ARGO temperature data (from which the heat-content data are calculated?)
Monkie still doesn’t understand the difference between heat and temperature.
Every study any physics, Lordo Monkey?
I ken fine the difference, and you have produced not a whit of evidence that I do not. And yes, I have not only studied physics but lectured in it all over the world at faculty level, and have won awards for it. Have you? Nope. Thought not.
Where is your evidence?
By the way, I have a PhD in theoretical physics.
Where is your evidence, data, and graphs?
You can’t provide them. That makes you a liar.
Big deal, you’ve lectured physics. I doubt it, and if it’s as stupid as you claim you solved HIV and every other disease, I feel sorry for your students.
” Holy Books of IPeCaC”
“miserable, inconsequential little life.”
“fellow climate-Communists’ ”
“the other futile climate Communists”
“The predicted warming is not happening. “
Actually, they don’t. the case I’ve seen is pretty weak and you don’t even understand basic chemistry.
Yes, they do. Exxon knew about man made Climate Change decades ago, then just like big tobacco did, in order to prolong their profits started spending money to finance the blogs, opinion pieces, political campaigns, and think tanks to promote anti-science and cause doubt in folks minds and delay action.
http://insideclimatenews.org/content/Exxon-The-Road-Not-Taken
YOU MORON. They knew about the theory. That’s all that’s been disclosed. Your article is worthless. A third grader could have written a more meaningful article. We’ve already been down this road. We’ve know for a 100 years that oceans absorb CO2… That has almost nothing to do with Global Warming.
YOU’re not only a Gruber. You must be a racist DemoKKKrat.
Monckton fights to create doubt. Just like his Heartland Institute did to extend profits for the tobacco boys. He and apparently you are the among the most vile people on the planet. Sociopaths that don’t care about the lives of others as long as their is money to be made.
ExxonMobil gave millions to climate-denying lawmakers despite pledge
Under pressure from shareholders, company promised eight years ago to stop funding climate denial – but financial and tax records tell a different story
““In 2008 we will discontinue contributions to several public policy groups whose position on climate change could divert attention from the important discussion on how the world will secure energy required for economic growth in an environmentally responsible manner,” Exxon said in its 2007 Corporate Citizenship report.”
http://www.theguardian.com/environment/2015/jul/15/exxon-mobil-gave-millions-climate-denying-lawmakers
Your article is Horse sheet. Satellites say it hasn’t warmed in
almost 20 years. Why are you a satellite data denier. Why are you an
Arctic Sea Ice Denier. Why are you a denier that Anatractica has been
gaining ice?…
Have you read Hansen, et. al 1981 yet? No. Why not?!!!!
BECAUSE YOU ARE A LAZY RACIST BEETCH of a DEMOKKKrat
Your article is Horse sheet. Satellites say it hasn’t warmed in
almost 20 years. Why are you a satellite data denier. Why are you an
Arctic Sea Ice Denier. Why are you a denier that Anatractica has been
gaining ice?
Have you read Hansen, et. al 1981 yet? No. Why not?
BECAUSE YOU ARE A LAZY RACIST BEETCH of a DEMOKKKrat…
Here you go. https://www.youtube.com/watch?v=fpF48b6Lsbo&index=19&list=PL82yk73N8eoX-Xobr_TfHsWPfAIyI7VAP
Your article is Horse sheet. Satellites say it hasn’t warmed in
almost 20 years. Why are you a satellite data denier. Why are you an
Arctic Sea Ice Denier. Why are you a denier that Anatractica has been
gaining ice?…
Have you read Hansen, et. al 1981 yet? No. Why not? Why not?
BECAUSE YOU ARE A LAZY RACIST BEETCH of a DEMOKKKrat
Why don’t I play your game? Because it’s all just BS and been shown to be such hundreds of times. This short video will give you some insight into your BS self. https://www.youtube.com/watch?v=fbW-aHvjOgM&index=17&list=PL82yk73N8eoX-Xobr_TfHsWPfAIyI7VAP
Becaus you are to stupid. Your video is Horse sheet. Satellites say it hasn’t warmed in
almost 20 years. Why are you a satellite data denier. Why are you an
Arctic Sea Ice Denier. Why are you a denier that Anatractica has been
gaining ice?…
Have you read Hansen, et. al 1981 yet??? No. Why not?
BECAUSE YOU ARE A LAZY RACIST BEYOTTCH of a DEMOKKKrat.
Waste of time to talk science with BS people. Even Exxon knows your BS is BS.
https://www.youtube.com/watch?v=fbW-aHvjOgM&index=17&list=PL82yk73N8eoX-Xobr_TfHsWPfAIyI7VAP
Apparently far right wingers and their think tanks like the Heartland Institute think it is ok for a company or anyone to knowingly sell a product that they know can do harm (even cause death) to you and your friends. And use profits made from said product, to sponsor disinformation about the peer reviewed science warnings about the dangers of the product. They call that capitalism, especially when they get to have society pay for the damage done. The deniers are just immoral people with no values, that are willing do people harm, even let them die, as long as there is profit to be made. These people are the most vile among us, with no motivation other than greed and profit.
As Croasdale’s team was closely studying the impact of climate change on the company’s operations, Exxon and its worldwide affiliates were crafting a public policy position that sought to downplay the certainty of global warming.
http://graphics.latimes.com/exxon-arctic/
Becaus you are to stupid. Your video is Horse sheet. Satellites say it hasn’t warmed in
almost 20 years. Why are you a satellite data denier. Why are you an
Arctic Sea Ice Denier. Why are you a denier that Anatractica has been
gaining ice?…
Have you read Hansen, et. al 1981 yet??? No. Why not? BECAUSE YOU CANT READ>
BECAUSE YOU ARE A LAZY RACIST BEYOTTCH of a DEMOKKKrat.
Why would anybody waste time debating science with a known liar?
https://www.youtube.com/watch?v=fbW-aHvjOgM&index=17&list=PL82yk73N8eoX-Xobr_TfHsWPfAIyI7VAP
And this report identifies how strategies and tactics used by ExxonMobil mirror the well-documented campaign by the tobacco industry to prevent government regulation by creating public confusion about the link between smoking and disease.
“Doubt is our product, since it is the best means of competing with the ‘body of fact’ that exists in the minds of the general public. It is also the means of establishing a controversy.” — Brown & Williamson
ExxonMobil underwrites well-established groups such as the American Enterprise Institute, the Competitive Enterprise Institute, the Heartland Institute and the Cato Institute that actively oppose mandatory action on global warming as well as many other environmental standards.But the funding doesn’t stop there.
http://www.ucsusa.org/sites/default/files/legacy/assets/documents/global_warming/exxon_report.pdf
Becaus you are to stupid. Your video is Horse sheet. Satellites say it hasn’t warmed in
almost 20 years. Why are you a satellite data denier. Why are you an
Arctic Sea Ice Denier. Why are you a denier that Anatractica has been
gaining ice?…
Have you read Hansen, et. al 1981 yet??? No. Why not? BECAUSE YOU CANT READ>!!
BECAUSE YOU ARE A LAZY RACIST BEYOTTCH of a DEMOKKKrat.
BS is BS. https://www.youtube.com/watch?v=fbW-aHvjOgM&index=17&list=PL82yk73N8eoX-Xobr_TfHsWPfAIyI7VAP
The point we have been at for decades now is that even Exxon, like Big Tobacco et al, before it, KNEW of the dangers and used profits to fund criminal sociopaths to mislead the public on the science.
“Doubt is our product, since it is the best means of competing with the ‘body of fact’ that exists in the minds of the general public. It is also the means of establishing a controversy.” — Brown & Williamson
There was this…
“They know perfectly well – for reasons I shall not go into here, but you can watch my interventions in Paris and Essen next month for details – “
LOL.
“for reasons I shall not go into” = because they are so ridiculous that even I can’t repeat them with a straight face.
“…startled to see a paleface staring out at them from under the seemly-pinched wimple of the kheffiyeh. ”
MONCKTON OF ARABIA
http://www.nationalreview.com/planet-gore/334989/how-un-hides-secret-talks-public-monckton-arabia
Some strawman building…
“I guess you are an environmentalist-Socialist: for it is only that totalitarian group that clings foolishly to the belief, demolished by Aristotle in his Sophistical Refutations 2350 years ago and confirmed by Thales of Miletus, Abu Ali Ibn al-Haytham, Newton, Einstein and Popper, to name but a few, that science is done by a supposed “consensus” of imagined “experts”. ”
w a dash of monckton/gish gallop
It’s some pathetic attempt to establish superiority through demonstration of a classical education.
Plenty of us had one but didn’t turn out to be complete wänkers like Monckton.
Notice he didn’t actually ‘prove’ anything, but just rehashed a couple of denialist talking points based on a willful misinterpretation of scientific consensus.
And, not a single link to any quotes by any of the people he lists.
Then you missed this ‘gem’:” Yah-boo is the grunt of the yahoo. “
Count the logical falacies:.
“One close to me was found in a recent cold winter, collapsed on the floor of her unheated house (the indoor temperature was below freezing), because she could no longer afford to keep the heating on. The sole reason: the price hikes to subsidize useless windmills and solar panels, which cause environmental devastation at vast cost, and actually add in net terms to the quantity of CO2 emitted (not that that is a problem).”
Warming in all parts of the climate system is in line with predictions, and completely inconsistent with that expected from natural climate forcings alone:
https://a.disquscdn.com/uploads/mediaembed/images/1388/5376/original.jpg?w=800&h
That includes the oceans, of course.
Penetration of Human-Induced Warming into the World’s Oceans
Barnett et al
Science 8 July 2005:
Vol. 309 no. 5732 pp. 284-287
DOI: 10.1126/science.1112418
The ocean temperature data were and (even after ARGO) remain wholly inadequate to draw conclusions such as those in the Barnett paper. At the time it was written, ARGO had been operational only for a year. The 3600+ bathythermographs are the least ill-resolved network of ocean monitoring we have, but each buoy takes only three temperature and salinity profiles a month, in a single location surrounded by 200,000 cubic kilometers of ocean. Before ARGO, the coverage was even more laughably inadequate.
The ARGO record, such as it is, shows the oceans warming at a rate equivalent to only 1 Celsius degree every 430 years. This, if it is true, demonstrates that the ocean has so very large a heat capacity that any warming of the atmosphere (which is 1000 times more tenuous than the ocean) cannot have much effect on ocean temperature. The vast heat capacity of the ocean sees to that.
More BS. https://www.youtube.com/watch?v=PTY3FnsFZ7Q&list=PL82yk73N8eoX-Xobr_TfHsWPfAIyI7VAP&index=18
Your article is Horse sheet. Satellites say it hasn’t warmed in
almost 20 years. Why are you a satellite data denier. Why are you an
Arctic Sea Ice Denier. Why are you a denier that Anatractica has been
gaining ice?…
Have you read Hansen, et. al 1981 yet? No. Why not?..
BECAUSE YOU ARE A LAZY RACIST BEETCH of a DEMOKKKrat
Off topic. The head posting is what is under discussion.
“The heat merely accumulates in the oceans”
Thereby killing the coral reefs and the thousands of species that rely upon them directly and indirectly.
That’s OK with you is it?
Thereby causing thermal expansion of the oceans and melting ice, raising sea levels to inundate arable land and destroy the livelihoods of some of the poorest people on the planet.
That’s OK with you too?
You re, at best, an idiot and a fraud or, at worst, a cynical apologist for the petrochemical industry who cares more about his “sponsors” and the money you receive from them than the future of our planet.
Hang your head in shame.
Now, let me sess, how long have the corals been around. Ah, here we are: the calcite corals evolved 550 million years ago and the aragonite corals first achieved algal symbiosis 175 million years ago. And these corals are so fragile, having survived temperatures ten degrees above today’s, that they can’t now endure an increase in temperature equivalent to 1 degree every 430 years, which is what the ARGO bathythermographs show? Oh, come off it.
As for thermal expansion of the oceans, Grinsted et al. (2009) carried out a reconstruction of sea levels globally over the past 1100 years. What that reconstruction shows is that sea level was higher by 8 inches in the mediaeval warm period than it is today (this remains one of the clearest indications that the mediaeval warm period was indeed warmer than the present), and lower by 8 inches in the little ice age than it is today. Temperatures in the middle ages were 1 degree above today’s; temperatures in the little ice age were 1 degree below today’s. Accordingly, sea level changes by 8 inches per degree.
Now, the previous central estimate of climate sensitivity was 3.3 degrees per CO2 doubling. However, a reduction in the feedback sum by the CMIP5 models compared with CMIP5 brings this down to 2.1 degrees per doubling. But on the RCP6 “business-almost-as-usual” scenario of the IPCC’s most recent assessment report, only three-quarters of the forcing equivalent to a CO2 doubling will occur between now and 2100. And, even if all of that forcing were to occur at once today, only two-thirds of equilibrium warming in response to that forcing would arise by 2100. But IPCC predicts the forcing will arise in small, steadyish annual increments in more or less a straight line, halving the in-century warming. So the warming that mainstream IPCC methods and data would lead us to expect from now to 2100 is three-quarters of two-thirds of one-half of 2.1 degrees, which is 0.5 degrees. In that event, the corresponding thermal expansion of the oceans will, on past form, be approximately 4 inches, or about half the rate of increase in the 20th century.
I am working with underwriters on the London market to offer climate-change insurance to those who have been foolishly misled into believing that we face an imminent and serious sea-level rise. Professor Niklas Moerner, who knows more about this subject than anyone else alive, says we might expect 2 inches plus or minus 4 inches of sea level rise this century. Not exactly a problem for the starving millions, is it? Their real problem is that they can’t get access to cheap, coal-fired electricity, because the totalitarians want to show them who’s boss.
So, if you are capable, try to cut back on the climate-Communist invective. It doesn’t work on me. Try doing some science instead, and see if you can produce a reasoned argument in response to the points I have made here. If not, don’t worry: those who are archiving these exchanges for future use will know what to make of your declarations that I’m an idiot and a fraud when you simply lack the intellect or scientific knowledge or even ordinary human curiosity to try to find out the truth for yourself, still less to recognize it when it is staring you in the face.
Now, do some proper science or belt up.
Bollox.
http://www.teachoceanscience.net/teaching_resources/education_modules/coral_reefs_and_climate_change/how_does_climate_change_affect_coral_reefs/
I am not sure that that word is reasonable; nor is the conclusion it expresses legitimately argued for. The reference provided appears unfamiliar with the reasons why the oceans are overwhelmingly self-buffering and cannot much change their pH; unfamiliar with Grinsted’s work on sea-level reconstruction; and certainly unfamiliar with the mathematics and physics of climate sensitivity, which tells us via the mainstream argument outlined by me earlier that we should not expect to see more than 0.5 K anthropogenic global warming this century.
By all means cite climate-Communist websites if you wish: it’s a free country, where even cruel absurdities such as Communism/Fascism (they are two sides of the same dismal totalitarian coin) are permitted. But, if you are capable, try actually addressing the specific points made in the postings to which you responding. That is the intellectually and scientifically credible way.
Monckton lies. http://www.desmogblog.com/directory/vocabulary/1245
Your article is Horse sheet. Satellites say it hasn’t warmed in
almost 20 years. Why are you a satellite data denier. Why are you an
Arctic Sea Ice Denier. Why are you a denier that Anatractica has been
gaining ice?…
Have you read Hansen, et. al 1981 yet? No. Why not?
WHEN ARE YOU GOING TO READ IT YOU LAZY RACIST BEETCH of a DEMOKKKrat
No scientific point to make, then. Just a link to a racketeers’ website funded by a convicted internet-gaming fraudster whom a court ordered to repay $185 million of his ill-gotten gains from scamming customer of a bogus internet-gaming bank he had established. His name is Lefebvre.
From the guy that can lie like a mofo.
https://www.youtube.com/watch?v=fbW-aHvjOgM&index=17&list=PL82yk73N8eoX-Xobr_TfHsWPfAIyI7VAP
Another tediously repeated link to another climate-Communist hate-speech merchant with no scientific qualifications, no track-record of publication in the learned journals. How intellectually feeble can you paid climate-Communist trolls get? But do carry on pressing the “repeat” button: that is about as far as your intellect seems able to take you.
Meanwhile, the rest of the world is in fits of laughter at the antics of the climate-Communist trolls paid to disrupt this and other sites: for they are so bad at what they are paid to do; so uninformed; so manifestly malevolent. Every time you link to a hate-speech site about me, you increase my apparent importance in the eyes of those who are laughing at you, and you illustrate your inability to understand one of the most fundamental of all logical fallacies, which is that to attack the man rather than to address his argument is to perpetrate the argumentum ad ignorationem elenchi, the argument from ignorance of the method of conducting a legitimate and informed and rational discussion. Go ahead: make my day, and make more money for Marc Morano every time you press the Repeat button.
ClimateDepot gets even more money every time someone links from it to an external website, so do go ahead: make us rich, while helping us to ensure that the truth re-emerges before tens of millions more die at the hands of environmentalist Communism. It has already killed 50 million with its ban on DDT. How many more will you play your part in killing, by denying them the cheap, clean, harmless, reliable, base-load, coal-fired electricity they so desperately need? Answer me that.
What? More errors my Lord?
https://www.youtube.com/watch?v=TRCyctTvuCo&index=21&list=PL82yk73N8eoX-Xobr_TfHsWPfAIyI7VAP
“..climate-Communist hate-speech merchant ..”
Monckton wrote, “Another tediously repeated link to another climate-Communist hate-speech merchant”
Notice how Monckton can’t debate science without a lot name calling. Shows his weak hand.
“Dear Davikins, Appell of my eye,” says Nanny in that soothing tone she puts on quite a lot of the time, because Davikins loses his little temper quite a lot of the time, “one day you’re going to be a growed-up real man. And your nice red pyjamas with the tiny hammer and the ickle sickle on the bogey-deposit pocket will be exchanged for a real live Communist Party card. And, you see, Davy-wavy, a lot of climate Communists have been calling that nice Lord Monckton all sorts of names. But when he does it back, they all do what you do, Davikins: they burst into tears and come running to Nanny.
“Well, if I’ve told you once, I’ve told you a thousand times: don’t be rude to that nice Lord Monckton. If you want to argue with him about climate science, you will have to spend more time on your homework and less time coloring your “My Little Lenin” coloring book. You see, that nice Lord Monckton knows what he’s talking about. So he puts stacks and stacks of really interesting science into his postings. And when little climate-Commies like you, Davikins, come along and can’t maintain any kind of argument, because you just don’t know enough yet, you start calling him names. But, you see, he doesn’t really mind. He likes little kiddiwinks really, and he hopes that one day they will grow up and perhaps become Great Men like him. Wouldn’t that be nice, Davy?”
It seems far right wingers and their think tanks like the Heartland Institute think it is ok for a company or anyone to knowingly sell a product that they know can do harm (even cause death) to you and your friends. And use profits made from said product, to sponsor disinformation about the peer reviewed science warnings about the dangers of the product. They call that capitalism, especially when they get to have society pay for the damage done. The deniers are just immoral people with no values, that are willing do people harm, even let them die, as long as there is profit to be made. These people are the most vile among us, with no motivation other than greed and profit.
As Croasdale’s team was closely studying the impact of climate change on the company’s operations, Exxon and its worldwide affiliates were crafting a public policy position that sought to downplay the certainty of global warming.
http://graphics.latimes.com/exxon-arctic/
Yes, yes, we know your climate-Communist paymasters have asked you to babble ignorantly about Exxon Mobil, but that case is going to be deeply damaging to the hard Left, for Exxon will simply reverse its present knock-kneed chief executive’s kowtowing to the Party Line and come out fighting, on the climate science, and on whether it is “certain”. For no competent and honest scientist would say that the predicted rate of global warming was “certain”: otherwise, why would IPCC predict betwen 0 and 4.5 degrees’ warming by 2100 in its current ASSessment report? Of course the rate of global warming isn’t “certain”, and any attempt by the Attorney General of New York to try to maintain that is will end in his ignominious and total defeat, just as Al Gore’s mawkish sci-fi comedy-horror movie was defeated in the UK High Court.
Bring on the RICO charges, what people like you have done is crimes against humanity. You are the same people that denied the science against tobacco so they could extend profits and kill people.
The emerging story of what Exxon knew, and when they knew it, shows that the differences have never really been about the science questions – even the major oil companies knew the basic science truths 4 decades ago. They simply made a moral decision that the lives of the next ten thousand generations of human beings were not as important as their own profits, and we are now witnessing the early impacts of that decision.
The deniers are just immoral creatures with no values that are willing do people harm, even let people die, as long as there is profit to be made. These people are the most vile among us, with no motivation other than greed and profit.
“climate-Communist paymasters “
See how Monckton can’t debate science without insinuating that he debator is paid off?
That’s the sign of a very weak hand.
“Now, Davy-wavy-woo,” says Nanny, “you are the Appell of my eye, but sometimes you’re frightfully naughty. You see, that nice Lord Monckton has evidence that a group of paid trolls is disrupting these threads. And if they’re anonymous he tells them he knows they’re being paid. And they can’t deny it.
“And sometimes, Davikins, he says that you’re a paid troll too. And he does that when you say naughty things about him, like that he’s a liar. Now, that’s not very nice, is it, Davy baby? Really, I think you ought to say Sorry.
“And by now you ought to know that Lord Monckton knows an awful lot about the climate, and really you don’t. So you’re a bit out of your league calling him names. Best to go to bed now, Davy, and perhaps you’ll feel all better in the morning.”
You’ve avoiding debate by being juvenile.
Don[‘t blub. You accused me of lying when you knew and know I was telling the truth. I have had some fun at your expense, and the thousands now watching my demolition of you and your fellow paid climate-Communist trolls are ROFLTAO. You are out of your depth in a freezing ocean, and praying for global warming that isn’t happening won’t help. My suggestion is that you go and take a course in climatological physics, so that at least you will know something of what you are talking about. The ignorance you have displayed here is, even by the very low standards on display from your fellow trolls, dismal and abysmal.
In future, don’t accuse people of lying when you know they are telling the truth. And, if you do make such false accusations, withdraw them when you are caught out lying, and apologize. And if you don’t withdraw your lies, don’t whine if you are treated with something of the contempt you deserve. Now, wipe your snotty nose, stop blubbing and go and learn some science.
I have demonstrated explicitedly that you weren’t telling the truth.
And you can’t even be honest about that.
Don’t be childish and petty. You accused me of lying when I said the ARGO bathythernographs showed no warming of the surface layers for the first 11 years of the record (the 12 year is not complete). I was not lying. The ARGO record shows no warming of the surface layers. You tried, with characteristic stupidity and ignorance, to say the surface layers of the ocean were warming because HadSST said so. But HadSST doesn’t measure the temperature of the surface layer of the ocean. It measures ocean surface air temperature. And that’s not just a different place: it’s a different medium. So grow up and accept you were and are lying.
Monkie: You have yet to provide a link to the data behind your claim.
HadSST3 shows warming over 11 years, of +0.15 C:
http://www.metoffice.gov.uk/hadobs/hadsst3/data/HadSST.3.1.1.0/diagnostics/HadSST.3.1.1.0_monthly_globe_ts.txt
Asked and answered. HadSST does not measure ocean temperatures. It measures air temperatures above the ocean. ARGO measures ocean temperatures and shown no warming during the entire 11 full years of the record at the surface. RSS and UAH both show no warming of the lower troposphere – the air above the surface. By some repeal of the law of thermodynamics, then, HadSST shows warming of the air between the non-warming lower troposphere and the non-warming upper ocean. In the circumstances, any competent statistician would question the reliability of the HadSST dataset.
Monkie wrote: “HadSST does not measure ocean temperatures.”
Monkie lies. From the Hadley Centre:
“HadSST3 is produced (a slightly more detailed description) by taking in-situ measurements of SST from ships and buoys….”
http://www.metoffice.gov.uk/hadobs/hadsst3/
Asked and answered. HadCRUT4 is a global air-temperature dataset, using land temperatures kept by the UEA and sea-surface air temperature kept by the Hadley Centre, which gets its sea-surface air-temperature measurements from ships and from surface buoys. How else would it get sea-surface air temperatures, but from ships and buoys, and where else would they be but in situ. Now, I have already answered you four times on this point. Are you just going on and on and on in the hope that I will eventually stop answering and you can then get the final word? Well, it’s too late. The Lord Monckton Foundation has already archived this discussion and is already picking out the best gems of your sullen, whining idiocy. My advice is that you should stop before you make any more of a fool of yourself.
False Monkey. What do you think IN SITU means???
“HadSST3 is produced (a slightly more detailed description) by taking in-situ measurements of SST from ships and buoys…”
http://www.metoffice.gov.uk/hadobs/hadsst3/
Dave, I don’t know if Chris is right about the climate, but I am starting to believe what he says about you, aussie, Robert and Icarus .
Me, Aussie, Robert and Icarus know how shifty Monckton is. If you knew anything, you would too.
So I know nothing?
So I know nothing?
Yes, it appears that, in fact, you do know nothing.
David, so from one very brief interaction on the web, you’ve come to the conclusion that I know nothing about anything, is this correct?
David, so after a very brief discourse on the internet, you’ve come to the conclusion that I know nothing about anything, is this correct?
David, so from a brief interaction on the internet, you’re convinced that I know nothing about anything, is this right?
Give it up, clown.
Interesting, would I be correct in saying that you’re not from North America?
No, I’m from Mars.
Ha ha… ok then.
I’m assuming that because I started this convo by saying that Chris seemed to right about you and several other of his critics being petty and childish at times, that I’ve offended you.
That was merely my observation.
If you are the scientist you claim to be, I would’ve thought you’d be aware of rational thinking and dissenting debate.
Ha Ha… ok then.
I’m assuming that since I started this convo by saying that Chris appeared to be correct about his assessment of you and other’s pettiness and childishness, that I’ve offended you.
That was merely my observation at that time.
If you are the scientist you claim to be, I would’ve thought that you’d understand rational thinking and dissenting debate.
You haven’t offended me. Frankly I couldn’t care less about you….
David, as we go through life, we find that anti-social behavior, even under the cloak of anonymity on the internet, is harmful to oneself (family, friends, etc) and collective humanity.
Do you think I am not truthful?
No where did I say that you know nothing or are being untruthful.
I know better than that.
For one thing, you rightly pointed out an error Chris has made concerning HadSST. If I understand correctly, he feels they don’t measure water temp, but the link you provided and a subsequent PDF download indicate clearly they do measure water temp.
So I know nothing?
David 1 – Chris 0
… so far.
I’ve just started this journey and am looking for reliable sources.
So I know nothing?
Maybe you didn’t see this, so I’ll repost:
No where did I say that you know nothing or are being untruthful.
I know better than that.
For one thing, you rightly pointed out an error Chris has made concerning HadSST. If I understand correctly, he feels they don’t measure water temp, but the link you provided and a subsequent PDF download indicate clearly they do measure water temp.
So I know nothing?
Maybe Disqus is messing up… or you’re using a bot, but if you had read my last 3 responses, I have clearly answered that question with evidence.
Maybe you didn’t see this, so I’ll repost:
Nowhere did I say that you know nothing or are being untruthful.
I know better than that.
For one thing, you rightly pointed out an error Chris has made concerning HadSST. If I understand correctly, he feels they don’t measure water temp, but the link you provided and a subsequent PDF download indicate clearly they do measure water temp.
Disqus is glitching, it’s not showing several of my posts.
Try again.
Maybe you didn’t see this, so I’ll repost:
No where did I say that you know nothing or are being untruthful.
I know better than that.
For one thing, you rightly pointed out an error Chris has made concerning HadSST. If I understand correctly, he feels they don’t measure water temp, but the link you provided and a subsequent PDF download indicate clearly they do measure water temp.
Wow… either this convo is being moderated, or Disqus is glitching. Taking screenshot this time.
Maybe you didn’t see this, so I’ll repost:
No where did I say that you know nothing or are being untruthful.
I know better than that.
For one thing, you rightly pointed out an error Chris has made concerning HadSST. If I understand correctly, he feels they don’t measure water temp, but the link you provided and a subsequent PDF download indicate clearly they do measure water temp.
So I know nothing?
So I know nothing?
Here in North America, both Canada and the USA, when you first meet someone, there is a mutual respect, even if we disagree.
There is discourse and openness to new ideas.
But I’m from Mars, not North America.
So I know nothing??
I don’t know if our convo is being moderated, or Disqus is glitching, cuz a bunch of my comments aren’t showing. I’ve got screenshots to prove it.
Screenshots to prove it???
Man, I”m quaking in fear…..
Ha ha… so you can read these. A few aren’t showing, hence the screenshot comment.
Not sure why you’re repeating yourself concerning ‘not knowing anything’, But again, as I scroll up, many comments missing.
Maybe you didn’t see this, so I’ll repost:
No where did I say that you know nothing or are being untruthful.
I know better than that.
For one thing, you rightly pointed out an error Chris has made concerning HadSST. If I understand correctly, he feels they don’t measure water temp, but the link you provided and a subsequent PDF download indicate clearly they do measure water temp.
So I know nothing?
Maybe you didn’t see this, so I’ll repost:
No where did I say that you know nothing or are being untruthful.
I know better than that.
For one thing, you rightly pointed out an error Chris has made concerning HadSST. If I understand correctly, he feels they don’t measure water temp, but the link you provided and a subsequent PDF download indicate clearly they do measure water temp.
Look: I think you’re a bug. I’ve been playing with you, but that’s getting old already.
Goodbye and good luck.
Leave. me. alone.
So I know nothing?
Monckton the flim flam man
https://www.youtube.com/watch?list=PL82yk73N8eoX-Xobr_TfHsWPfAIyI7VAP&v=fbW-aHvjOgM
“The Lord Monckton Foundation has already archived this discussion and is already picking out the best gems of your sullen, whining idiocy.”
You act like a child.
Monkey wrote: “ARGO measures ocean temperatures and shown no warming during the entire 11 full years of the record at the surface.”
Prove it, Monkey. With data.
I have already told you where to get the data, and I have already told you what they show. I can do no more for you. You do not want the truth, so you follow a pattern easily recognizable among paid climate-Communist trolls: you go on asking for data even after you have been given clear, straightforward instructions on how to find the data, and on what they show. Not very adult, are you? Not very bright, either.
Where is your graph, Monkey?
I’m not going to guess where you are hiding your data. Either provide a graph or get used to being called a dumb monkey.
Link to the data?
I don’t think you know the link, Monckton. I think you’re full of crap.
Monkey: are you familar with the huge errors that have been found in UAH’s work in the past?
http://en.wikipedia.org/wiki/UAH_satellite_temperature_dataset#Corrections_made
I note that you are not citing a peer-reviewed source, but are instead citing CreepyMedia, the encyclopaedia that any idiot can edit but only a cretin would credit. Provide a more serious reference than that.
I am aware that all global temperature datasets are subject to numerous uncertainties and errors, but that, for reasons that I have already explained to you in detail earlier in this thread, the satellite data are more reliable than the terrestrial data (and have been altered far less often).
You haven’t cited a source yet, Monkey.
I provided a link to a list of UAH’s many errors.
Even deniers know about their sign error in the 1990s-2000s. You should too — it was a major embarassment to that group.
https://en.wikipedia.org/wiki/UAH_satellite_temperature_dataset#Corrections_made
Wikipedia is well referenced. Read it — you will learn something.
Monkey wrote: “I have already explained to you in detail earlier in this thread, the satellite data are more reliable than the terrestrial data (and have been altered far less often).”
No such thing. Satellites don’t even measure temperatures. So how are they more reliable?
What claim?
Monkey: Your claim about the ARGO data 0-10 m.
Asked and answered, repeatedly. Get the data from the ARGO marine atlas.
Monkie wrote: “The ARGO record shows no warming of the surface layers.”
Prove it, Monkie.
Certainly. The ARGO marine atlas is available online. Download it. Download the updates. Select any depth you are interested in. Pick your units. Pick your region of the planet. Download the data for the period you have chosen (hint: you need to download only full years, for there is strong seaonal auto-correlation). Then lift out the data and determine the least-squares linear-regression trend. Don’t come back till you’ve done that homework.
Where is the data/graph proving your ARGO 0-10 m claim?
I’ve asked several times monkey. You haven’t answered once.
Asked and answered. ARGO marine atlas.
URL to the graph of 0-10 m ARGO data?
I want yours. I don’t want to have to guess it.
Let’s see you post the graph here, Monkey. Right in your next comment.
Asked and answered. Argo marine atlas. It draws graphs. You don’t accept the graphs in the head posting, so do your own.
URL?
Monkie wrote: “But HadSST doesn’t measure the temperature of the surface layer of the ocean.”
False, Lordo.
“HadSST3 is produced (a slightly more detailed description) by taking in-situ measurements of SST from ships and buoys.”
http://www.metoffice.gov.uk/hadobs/hadsst3/
Don’t be silly. Before ARGO, ships took both air temperature measurements with deck-mounted thermometers and sea temperature measurements with buckets or engine-intake thermometers. There were also fixed and floating air-temperature buoys. Today, the ARGO bathythermographs take the ocean temperatures far more reliably than the canvas buckets and engine-intake thermometers could, and the sea-surface air temperature are taken by deck-mounted thermometers on ships and by surface buoys.
False Monkey.
“HadSST3 is produced (a slightly more detailed description) by taking in-situ measurements of SST from ships and buoys…”
http://www.metoffice.gov.uk/hadobs/hadsst3/
Asked and answered.
URL?
Monkie: Yes, you lied about sea surface temperatures.
Odd, since your lies are so easily checked by people who do know the data.
In the absence of specific detail, the allegation that I lied is mere petulant yah-boo. And yah-boo is the grunt of the yahoo.
Monkie: You are refusing to provide data to back up your ARGO claims.
Why?
This is the seventh time you have childishly asked for data when, as you well know, I have told you six previous times just to get the ARGO marine atlas and do the calculations for yourself. You sneer at – or, more usually ignore and demand again – any information that I give you from the data: so I am telling you to go and get the data for yourself, download it, do the least-squares trend calculation (ARGO doesn’t provide that, because they don’t want people to know just how slowly the ocean is warming, and they certainly don’t want them to know it’s warming from below). So just get on with it. It is blindingly obvious to the tens of thousands who have now seen this thread that you have been offered the data but you are too cowardly to pick them up, because you know perfectly well they show what I say they show.
Asking for data isn’t “childish” — it is the hallmark of the scientific method.
You have provided no data. Which makes your claims easily dismissable.
Where is your data? I’m not going to guess. It’s a monkey’s obligation to provide data to support his claims.
Start providing, monkey.
Asked and answered many times. The data are in the publicly-available ARGO marine atlas.
“especially when they get to have society pay for the damage done. ”
They never saw a fossil fuel market failure they didn’t support.
Corporate Socialism of Externalities.
More bollox.
Climate change driven damage to the reefs isn’t a theory, it is observed fact.
You are just wriggling around trying to fool the gullible.
Must try harder.
Take, for instance, the largest known reef on Earth, the Great Barrier Reef off the northern part of the East Coast of Australia. The Great Barrier Reef Authority, though it has been bleating and whining about global warming, also publishes the mean sea temperature surrounding the reef. Last time I looked, which was admittedly some years ago, there had been no change in the ocean temperature for 30 years.
Furthermore, the bleaching of corals, which was observed in the strong but naturally-occurring el Nino of 1998 (we know it was natural because it is part of the synoptic variabijlity of the ocean temperatures), also occurred in the Great el Ninos of the past 300 years, of which there were two. Bleaching is a natural defense mechanism against a sudden increase in ambient temperature. Delicate though the corals look, they are far hardier than most other species, having survived for 550 million years (the calcites) and 175 million years (the aragonites) respectively. That means they all survived temperatures which, for most of that period, were around 10 degrees warmer than the present.
And come whining back with the usual climate-Communist claptrap about how they can’t survive sudden changes. They survived the Paleocene-Eocene Thermal Maximum. which was far worse than anything we could throw at them even if we burned off all fossil fuels today. And they can survive very rapid changes both in temperature and in pH caused by river runoff during major storms. For the oceans are not acidifying: they are pronouncedly alkaline, and must remain so, at a pH of about 8.0, because they are overwhelmingly self-buffering. Rainwater, however, is pronouncedly acid, at a pH of only 5.4 (7.0 being neutral). Billions of gallons of rainwater can flow off the land and straight into the sea, temporarily altering the corals’ ambient pH by several tenths of a point. They manage just fine, even though these changes are very sudden.
A recent paper on corals off South America shows they are capable of robustly coping with changes to pH and temperature that are many times larger than anything we can possibly bring about. The danger to corals is from pollution and from excessive tourism, not from CO2 or global warming.
“A recent paper …”
“climate-Communist claptrap”
First search return….
Impacts of rising sea temperatures on the Reef
The temperature gradient along the Great Barrier Reef has shifted markedly over the last century. When averaged across the last 30 years, sea surface temperature in the Great Barrier Reef has increased by about 0.4oC, compared to records averaged across 30 years in the late 1800s.
The two warmest five-year average sea surface temperatures have been recorded in the last decade. Analysis of coral cores in centuries-old corals suggests that current temperatures are warmer now than over the last three centuries. The summer of 2010 saw the highest recorded sea surface temperatures in Australia
http://www.gbrmpa.gov.au/managing-the-reef/threats-to-the-reef/climate-change/how-climate-change-can-affect-the-reef/rising-sea-temperatures.
“Last time I looked, which was admittedly some years ago, there had been no change in the ocean temperature for 30 years.”
Funny, then, that the Barrier Reef Authority’s records showed no warming. But if all we’re talking about is an increase of less than half a degree compared with 150 years ago, it is very difficult to make a case that that will cause harm to corals that have survived temperatures 10 degrees higher than that for millions of years, now, isn’t it? Do try harder to think a little rather than parroting the Party Line.
Sounds like we are supposed to believe your remembering of data from ears past. Perhaps, instead on relying on it, and expecting use to also, you could go look it up and report.
“Funny, then, that the Barrier Reef Authority’s records showed no warming.”
And given the amount of documentation on a global event, perhaps we could see your rationale for picking GBR as your sole example.
Asked and answered.
BS readily falls out the mouth of monckton. https://www.youtube.com/watch?v=PTY3FnsFZ7Q&list=PL82yk73N8eoX-Xobr_TfHsWPfAIyI7VAP&index=18
Your article is Horse sheet. Satellites say it hasn’t warmed in
almost 20 years. Why are you a satellite data denier. Why are you an
Arctic Sea Ice Denier. Why are you a denier that Anatractica has been
gaining ice?…
Have you read Hansen, et. al 1981 yet? No. Why not?
BECAUSE YOU ARE A LAZY RACIST BEETCH of a DEMOKKKrat…
Off topic, out of date, repeated, and wrong.
Beats an ice age.
Icarus62 should renegotiate their contract; according to the lord, I get 155k+ 35k expense account…..
“You take money from a climate-Communist advocacy group to disrupt these threads with your hate-speech. You were paid $122,000 last year alone to do this. “
Except in the opinion of scientists.
In any case, you guys are obsessed with Communism and connect it to climate simply because you understand that if AGW is real, capitalism cannot do anything about it (especially if you consider that it was the system responsible for creating it in the first place). You understand that only a system where no individual or small group of individuals has the “freedom” (a word for “power” in your language) to make decisions that effect the external world and the future to a large extent could do it. You associate this kind of conscious planning and putting common interests ahead of individual with “communism” and so you rail against it.
But beyond this, you have no idea what communism actually is, you can only picture it in your tiny mind as a combination of the worst problems of – capitalism. (Hence the ridiculously dumb “communist paymasters” stuff.) Iow, you’re projecting.
Don’t be childish. The lower troposphere is where we live. It has not warmed for approaching 19 years, contrary to the predictions of the IPCC and the models. There has also been no global warming at all in the upper or surface strata of the oceans (ARGO marine atlas, 2004-2015); no global warming of the mid-troposphere; and no global warming of the upper troposphere.
The only global warming that has appeared, in the past year or two, is in the altered versions of the three longest-standing terrestrial tamperature datasets, each of which agreed with RSS and UAH that there had been no warming since the turn of the millennium, but each of which, in increasingly stark and perplexing contrast to the RSS and UAH datasets, now shows warming that was not previously identified in the record.
As for the increase in ocean heat content, one is baffled at being accused of deception when a graph remarkably similar to that which the paid climate-Communist troll Icarus 62 flashes before us from behind its cowardly curtain of anonymity is clearly displayed in the head posting, where it is explained that the 260 ZJ of accumulated heat content since 1970 was deduced indirectly from the temperature measurements. Those measurements, during the 11 years for which we have halfway well resolved data from the ARGO bathythermographs, show the upper strata of the ocean warming not at all, and the upper 1.25-mile slab warming at a rate equivalent to a dizzying 1 degree per 430 years.
Said wo a any evidence or a citation…
Which 7th graders know to do…
https://www2.uwstout.edu/content/profdev/rubrics/middlelschresearchrubric.html
“..contrary to the predictions of the IPCC and the models. “
Don’t be childish. The predictions of the IPCC and the models are described in detail in the head posting, with references. Try getting someone to read them to you.
You should renegotiate your contract; according to the lord, I get 155k+ 35k expense account…..
“You take money from a climate-Communist advocacy group to disrupt these threads with your hate-speech. You were paid $122,000 last year alone to do this. ”
monckton also named an employer, so maybe you should press him for more details.
HEY,with ‘my’ 35k, I should host a lavish dinner party……
‘monckton’ is a bona fide loon.
I let him do the talking…monckton, “You take money from a climate-Communist advocacy group to disrupt these threads with your hate-speech. You were paid $122,000 last year alone to do this. ”
https://disqus.com/home/discussion/climatedepot/no_global_warming_at_all_for_18_years_9_months_a_new_record_8211_the_pause_lengthens_again_just_in_t/#comment-2349919377
“Environmentalist Socialism killed 50 million with the hideously msiconceived ban on DDT”
https://disqus.com/home/discussion/climatedepot/no_global_warming_at_all_for_18_years_9_months_a_new_record_8211_the_pause_lengthens_again_just_in_t/#comment-2351630909
“You are paid $155,000 a year, plus expenses.” “Holy Books of IPeCaC ”
https://disqus.com/home/discussion/climatedepot/no_global_warming_at_all_for_18_years_9_months_a_new_record_8211_the_pause_lengthens_again_just_in_t/#comment-2351100136
“Yes, yes, we know your climate-Communist paymasters have asked you to babble ignorantly about Exxon Mobil, but that case is going to be deeply damaging to the hard Left, for Exxon will simply reverse its present knock-kneed chief executive’s kowtowing to the Party Line and come out fighting, on the climate science, and on whether it is “certain”.”
https://disqus.com/home/discussion/climatedepot/no_global_warming_at_all_for_18_years_9_months_a_new_record_8211_the_pause_lengthens_again_just_in_t/#comment-2351842325
Carl Mears of RSS says you are a cherry picking denialist.
http://www.remss.com/blog/recent-slowing-rise-global-temperatures
The name calling from Carl is one year old.
This graph is up to date:
http://woodfortrees.org/plot/rss-land/from:1997/plot/rss-land/from:1997/trend
How interesting that you choose the “land only” RSS data. What’s wrong with the global dataset? That warming trend too difficult to swallow? http://woodfortrees.org/plot/rss/from:1997/plot/rss/from:1997/trend
RSS is global satellite data.
Look at your own link, Moron.
It says “RSS MSU LT Global Mean (land only).
I’d say that means land only, what do you think?
Still flat.
http://woodfortrees.org/plot/rss/from:1997/plot/rss/from:1997/trend
And Carl Mears of RSS resents cherry picking denialists like you who misrepresent his data.
18 years of no trend is not cherry picking. Real scientists would be fascinated by what we could learn about natural cycles. If only they were allowed to acknowledge the end of the warming cycle without losing their jobs.
But I guess Carl and you have to call people names. Instead of doing science. Because there is big money involved.
Climate is based on 30 year time frames. That is the WMO standard.
http://www.woodfortrees.org/graph/rss/from:1984/to:2014/trend/plot/rss/from:1984/to:2014
“Climate is based on 30 year time frames.”.
Then why did the so-called “climate scientists forecast the end of the world based on data from 1979 to 1998?
They do not.
Sure they did.
http://wattsupwiththat.com/2014/04/02/the-big-list-of-failed-climate-predictions/
That has nothing to do with your assertion.
watts again = lol why didn’t you use a superman comic book as a source? lmao
The guy you use as your source, Anthony Watts, runs a right wing denier blog, and is on the payroll of the Heartland Institute. So is Monckton. In fact, that’s the very same Heartland Institute that the Tobacco companies used to cast doubt on the science so they could prolong their profits and kill people with their cancer causing tobacco.
http://www.ucdmc.ucdavis.edu/welcome/features/20071114_cardio-tobacco/
Your article is Horse sheet. Satellites say it hasn’t warmed in
almost 20 years. Why are you a satellite data denier. Why are you an
Arctic Sea Ice Denier. Why are you a denier that Anatractica has been
gaining ice?…
Have you read Hansen, et. al 1981 yet? No. Why not?
BECAUSE YOU ARE A LAZY RACIST BEETCH of a DEMOKKKrat
Uh huh, little Anthony didn’t even graduate college, yet they call him an “expert” at Heartland. 🙂 That’s where they also deny that tobacco caused cancer, so that the tobacco companies could extend profits and kill more people.
https://www.heartland.org/anthony-watts
AND HE STILL KNOWS 6000 times more than you do.
Your article is Horse sheet. Satellites say it hasn’t warmed in
almost 20 years. Why are you a satellite data denier. Why are you an
Arctic Sea Ice Denier. Why are you a denier that Anatractica has been
gaining ice?…
Have you read Hansen, et. al 1981 yet? No. Why not?
BECAUSE YOU ARE A LAZY RACIST BEETCH of a DEMOKKKrat
Here is a look at how smart Anthony is: https://www.youtube.com/watch?v=P_0-gX7aUKk#t=11
Your article is Horse sheet. Satellites say it hasn’t warmed in
almost 20 years. Why are you a satellite data denier. Why are you an
Arctic Sea Ice Denier. Why are you a denier that Anatractica has been
gaining ice?…
Have you read Hansen, et. al 1981 yet? No. Why not?????
BECAUSE YOU ARE A LAZY RACIST BEETCH of a DEMOKKKrat
Anthony caught lying again.
https://www.youtube.com/watch?v=P_0-gX7aUKk#t=11
Your article is Horse sheet!!!. Satellites say it hasn’t warmed in
almost 20 years. Why are you a satellite data denier. Why are you an
Arctic Sea Ice Denier. Why are you a denier that Anatractica has been
gaining ice?…
Have you read Hansen, et. al 1981 yet? No. Why not?
BECAUSE YOU ARE A LAZY RACIST BEETCH of a DEMOKKKrat
Your article is Horse sheet. Satellites say it hasn’t warmed in
almost 20 years. Why are you a satellite data denier. Why are you an
Arctic Sea Ice Denier. Why are you a denier that Anatractica has been
gaining ice?…
Have you read Hansen, et. al 1981 yet? No. Why not?
BECAUSE YOU ARE A LAZY RACIST BEYOTTCH of a DEMOKKKrat.
Your article is Horse sheet. Satellites say it hasn’t warmed in
almost 20 years. Why are you a satellite data denier. Why are you an
Arctic Sea Ice Denier. Why are you a denier that Anatractica has been
gaining ice?…
Have you read Hansen, et. al 1981 yet? No. Why not?
BECAUSE YOU ARE A LAZY RACIST BEYOTTCH of a DEMOKKKrat.!
You could check out a few of the quotes. Or you could foam at the mouth and attack the messenger.
The trouble with the tobacco analogy is that it is big green and all those government paid scientists making the big bucks trying to defend a failed theory. The hiatus is real. The AGW cult is trying to keep the money flowing despite the evidence that natural variability dominates climate.
Uh huh, little Anthony didn’t even graduate college, yet they call him an “expert” at Heartland. 🙂 That’s the same Heartland that denied (denies) the science about tobacco causing cancer in order to delay action and allow more people to die. The worst types of people on earth.
https://www.heartland.org/anthony-watts
Anthony in action:
https://www.youtube.com/watch?v=P_0-gX7aUKk#t=11
You could check out a few of the quotes. Or you could foam at the mouth and attack the messenger.
Blogs highlight the work of experts.
Like those from NASA who point out Antarctic Land Ice is growing.
Should be 60… s ince it’s obvious the cooling and warming periods last about 30 years each.
The one I posted was, yes. The one you picked was land only. The global dataset shows warming since 1997. As do all the other datasets. As do the observations of increased ice loss from Antarctica, the melting Greenland ice sheet, the decreasing summer ice extent in the Arctic, the retreating glaciers, the warming oceans etc.
RSS is global. Not land only. Your link says “global” as does mine.
What a surprise that your name is Billy Bob.
LOL
What a surprise name calling is all the AGW cult has these days.
Oh great, Billy Bob is following me around. Another stalker.
Calling me a stalker to deflect.
If that is the best the paid Trotskyist totalitarian trolls can do, it’s pretty feeble. sMears has not, as far as I know, mentioned me by name, though his own political stamp may be deduced from his use of the word “denialist” to describe those who disagree with him scientifically. sMears is not a statistician and did not perform any of the appropriate statistical tests to determine the extent to which the spike in global warming in 1998 was responsible for the 18 years 9 months without any global warming at all that the RSS data show.
I had of course performed two of the relevant tests: first, by verifying that the trend for most of the period after 1998 is a zero trend (it is), and secondly, by verifying that removing the 1998 and 2010 spikes from the record leaves the trend more or less unchanged at zero, indicating that the effect of the 1998 spike on the trend is more or less exactly opposed by the effect of the 2010 trend. sMears did not think to do these tests, and would not have known how to do them. It was easier for him merely to use the word “denialist”, with its deliberate and malicious overtones of comparison with Holocaust denial, knowing that the paid climate-Communist trolls could be relied upon to pick up his hate speech and parrot it in the screeching fashion of their kind.
As to “cherry-picking”, the head posting makes it quite plain that the start date for the graph is the earliest date from which, till the present, a zero trend obtains. The date is thus calculated, not cherry-picked. It should be blindingly obvious to any rational mind that a zero trend for the best part of two decades is well beyond what any of the models would have predicted, which is why the IPCC itself has admitted that 111 out of 114 models had over-predicted recent warming trends.
Who, then, is the “denialist”? I merely report what the data actually show. The climate-Communist trolls have nothing to offer but bluster and hate-speech in response. Not an intellectually robust contribution to the debate, one feels.
You are deluded. Take a dose of your magic elixir.
I thought you’d be unable to reply coherently to serious scientific argument. Yah-boo is, as ever, the best you can muster. Another excellent advertisement for climate Communism. Another reason why the climate Communists are losing – nay, have lost – the global warming debate. They have lost because they do not debate. They do not debate because they cannot debate. They cannot debate because their “facts” are not true. The world is not warming at anything like the predicted rate, and that fact – for it is a fact – will become ever clearer as the divergence between exaggerated prediction and unexciting reality continues, inexorably, to widen.
Even Exxon knows your BS is just BS.
Otiose repetition is the unfailing hallmark of the small mind.
Exxon is not the only one that knows about your BS.
Monckton claimed that he has developed a cure for Graves’ Disease, AIDS, Multiple Schlerosis, the flu, and the common cold. This is no joke–he actually filed applications to patent a “therapeutic treatment” in 2008, 2009, 2010, 2011, 2012, and 2013. Bluegrue speculates that Monckton is likely filing his applications and then letting them lapse after a year without paying the fees necessary to have the Patents Office take the process forward. That way, he can claim he has filed for a patent, but never has to have the Patent Office determine whether his “therapeutic treatment” is patentable (or pay any fees). Is it homeopathy? Massive doses of vitamin C? The world waits with bated breath.
The topic of the head posting is the climate, and the lack of global warming over the past couple of decades. Most civilized people would confine themselves to discussing that topic on these threads, and would in any event wish us well with our research into infectious diseases, for the sake of the patients who may benefit if we are right (we shall do no harm to anyone but our own bank balances if we are wrong).
Well monckton, even Exxon knows your BS on climate change is BS, so I’m moving on to more of your BS, but here is some more of your BS on climate change.
John Abraham pointed out a large number of examples where Monckton cited scientific literature that actually refuted his points, or the authors of the papers said that Monckton had misinterpreted their results. This caused His Lordship to FLIP OUT.
http://www.stthomas.edu/engineering/jpabraham/
Abraham’s laughable attempts to take apart one of my presentations revealed only his own bottomless ignorance and prejudice. He was unable to answer several hundred scientific questions about his attack on me, including several questions related to how he had misrepresented my opinions when inviting third-party scientists to make adverse comments. I had originally decided to mount a libel action, but I am now of the opinion that Abraham’s actions constituted the criminal offense of fraud. The matter is to be referred to the police, as part of a far wider international investigation into a connected group of climate fraudsters.
And there is the wriggle that you think will get you off the hook.
You claim libel and fraud but rather than seek redress in the courts you claim it “is to be referred to the police”.
So it hasn’t been referred to the police and we both know that it never will be because it isn’t libelous or fraudulent which would become blindingly obvious in the court case you will go to any lengths to avoid.
You’re a charlatan.
Worse, you’re a cowardly charlatan.
Put up or shut up.
Once again, an ill-thought-through, irrational, petulant and staggeringly uninformed rant, rather than a measured, reasoned, fact-based argument. Must try harder. Detention hall after school, please.
The police in several countries – specifically Switzerland, the United States, the United Kingdom and Australia – have been invited to look at various aspects of the climate fraud. The law in all these countries requires that the police be contacted in the first instance. They have been contacted. They are aware that serious fraud is alleged. In one instance they have already declared that a deception was manifestly present, on the evidence provided.
In the United States, which is not a free country, a private citizen may not institute a private prosecution. Only the public authorities may do that. So I cannot prosecute Abraham for fraud, but I can, once the evidence of how his fraudulent activities link to the central frauds in the climate debate, refer the case to the U.S. authorities as part of their continuing investigation, with a request that a prosecution should be instituted by the relevant public authorities.
“In the United States, which is not a free country, a private citizen may not institute a private prosecution.”
LOL
So you can’t bring a civil suit in the US?
Hahahahaha!
You get more desperate with every post.
So an Australian in Switzerland not only claims to know about global warming, when he self-evidently knows nothing but the climate-Communist Party Line, but also claims to know about the judicial system in the United States. If he will check before bloviating, he will discover that in the United States, following a long-standing decision of the Supreme Court, it is not possible for a private citizen to prosecute privately. Prosecution can only be authorized by the AG or the DA.
If anaussieinswitzerland is unaware of the distinction between a civil suit and a criminal prosecution, this is not the place to educate him (always assuming that paid climate-Communists are educable) in the distinction between private and public law.
In any event, inj his anxiety to spew hate-speech he has galumphed untidily (and with spectacular inaccuracy) off topic.
The topic is the absence of any global warming at all for 18 years 9 months.
You should hear them go after Ben Carson. It’s 3 times worse. It’s like they are demon-possessed.
Has he heard back from West Point yet?
He never applied…. Now we know you are a DemoKKKrat Racist and a climate-communist even though you posed as otherwise.
“He never applied.”
Then why did he claim he had?
What about this makes you think I am racist?
What makes you think you can tell my political views from a simple question?
When and where did he claim that he applied? I have seen no such proof. You’re insane.
“Republican presidential candidate Ben Carson on Friday conceded that he never applied nor was granted admission to West Point and attempted to recast his previous claims of a full scholarship to the military academy — despite numerous public and written statements to the contrary over the last few decades.”
Read more: http://www.politico.com/story/2015/11/ben-carson-west-point-215598#ixzz3r50gICfc
Where is the contradiction?
His claim was he was offered a scholarship. That does not contradict the fact that he never applied.
You apparently can’t read English so your science really can’t be that good because it apparently is your native tongue and you can’t even comprehend English.
Can’t believe everything you read in the media. Politico ran a false story. http://thefederalist.com/2015/11/06/politico-admits-fabricating-a-hit-piece-on-ben-carson/
You’re a racist because you are falsely accusing a black man of lying.
If he lied it has nothing to do with the colour of his skin. I rather think you need to examine your own motives before following this line of argument.
The motive is pure revenge. You Commies called us racists every time we criticize the Dear Leader.
He didn’t. Politico ran a false story.
http://www.breitbart.com/big-journalism/2015/11/09/wsj-cnn-politico-debunked-anti-carson-bio-attacks-crumble-under-scrutiny/
http://thefederalist.com/2015/11/06/politico-admits-fabricating-a-hit-piece-on-ben-carson/
Here’s the audit: National Socialism killed some 20 million (at least) in the second world war; Communist Socialism killed 100 million in the 20th century alone; Environmentalist Socialism killed 50 million with the hideously msiconceived ban on DDT; and it now bids fair to kill tens of millions more by denying them access to affordable, fossil-fueled electricity. Tens of millions here, tens of millions there, and pretty soon you’re talking serious death and destruction., The noun common to all these murderous creeds is “Socialism”, which is the , totalitarians’ code-word for totalitarianism. They don’t care how many they kill; they don’t care what the truth is, and they shriek their vicious fury against any who dare to oppose them. All these, in the literature of demonology, are hallmarks of the Devil. Oh, there is one more. You will never hear them laugh.
“Environmentalist Socialism killed 50 million with the hideously msiconceived ban on DDT”
“The noun common to all these murderous creeds is “Socialism”, which is the , totalitarians’ code-word for totalitarianism. “
Do you realise that you are totally insane?
“.. paid Trotskyist totalitarian trolls ..”
Not much point in reading past that.
Can pretry much stop reating there….
“..paid Trotskyist totalitarian trolls ..”
Each time Monckton issues a new version of his “The Pause lengthens again”, he dresses his graph up with technical minutiae such as “Trend -0.00 C° (-0.00 C°/century)” and “r² = 0.000”, but the one piece of information he never supplies is the average temperature during the entire pause (the graph’s Y-average). The reason he doesn’t do this is because that average keeps increasing from version to version, as the start and end dates of the pause inch forward. This is very easy to verify using the downloadable RSS data. For example, using the recently revised RSS data set, when the “pause” was 17 yrs 10 mos (from October 1996 to July 2014), its average temperature anomaly was 0.2385; when it was 18 yrs 5 mos (from December 1996 to April 2015), the Y-average was 0.2406. Now that Monckton claims it is 18 yrs 9 mos (from January 1997 to September 2015), this average has risen to 0.2443. In other words, the average temperature of Monckton’s pause, which is supposed to show no warming, is itself warming. How ridiculous is that?
Not another dim, paid climate-Communist troll. Try getting Nanny to read you the head posting, where the fact that the left-hand as well as the right hand ends of the graph are moving rightward is discussed forthrightly. Here you present what is an identical argument as though it had not been mentioned in the head posting.
So let me explain the significance of the Pause. IPCC, in 1990, said that by now global temperature should be rising at a rate equivalent to 3 Celsius per century, which is 0.3 Celsius per decade. But in the past two decades the increase has been very close to zero. Now, official climate science tells that the bulk of the warming in response to a forcing occurs within the first couple of decades of the forcing itself. So, at a time when strong anthropogenic forcings are occurring, theory would not lead us to expect a pause in global temperature. One would, of course, expect such a pause to occur from time to time in nature; but one would not expect it under a strong anthropogenic forcing.
Two conclusions follow. Either the forcing from our activities is being precisely matched by countervailing natural forcings, temporarily preventing the underlying warming rate from coming through, or the natural forcings are nothing like as strong as official science currently suggests, or both. Definitive answers either way are not really possible in the current state of climate knowledge – which demonstrates yet again the absurdity of the notion that “the science is settled”.
But let me give some pointers. In the IPCC’s remarkably naive understanding, the climate-sensitivity equation has only three independent or input variables: the radiative forcing; the Planck parameter; and the temperature-feedback sum. The CO2 radiative forcing is currently overestimated by 40% because Voigt or Lorentzian line-shape equations are used in the models. These equations were not designed for climate science, so – for convenience (it greatly simplifies the math) they assume that excitation-deexcitation collisions occur instantaneously. However, there is in fact a few picoseconds’ delay, and – at the far wings of the absorption bands, where the great majority of all CO2 forcing arises – that delay cuts the CO2 forcing heftily, for the forcing, and hence climate sensitivity on all timescales, with or without feedbacks, is overstated by 40%.
Secondly, the Planck parameter assumes that there is a single characteristic-emission altitude at which the fundamental equation of radiative transfer applies, when in fact there are several such altitudes, one for CO2, one for water vapor, one for the surface, one for the cloud-tops, one for methane, etc. Now, what this means in practice is that one of the central assumptions in the models is simply wrong: namely, the assumption that a forcing of n Watts per square meter from, say, a change in solar activity will have the same warming effect as a forcing of n Watts per square meter from CO2. It won’t, because the two forcings occur at very different altitudes, and in consequence the feedbacks to each type of forcing differ. Most of the feedbacks that apply to solar forcings do not apply to CO2 forcings. This consideration, on its own, reduces climate sensitivity to just 0.4 K per CO2 doubling.
Thirdly, the temperature-feedback sum has been drastically reduced in the CMIP5 models compared with the earlier generation, CMIP3. That mainstream-science alteration, on its own, reduces climate sensitivity from 3.3 to 2.1 K per CO2 doubling.
Taking these and numerous other defects in the models into account, it is perfectly possible that our influence on climate this century will be statistically indistinguishable from zero, and it cannot in any circumstances – on the basis of mainstream science – exceed 0.5 Celsius.
So don’t quibble. Try to stand back from the climate-Communist party line you are paid to spout and look at the big picture, which is that warming – to the extent that it is happening at all – is happening at a rate a very, very long way below what had been predicted. And that discrepancy, which you strive so hard to sweep under the carpet, is what has inspired true scientists to investigate why the discrepancy has occurred: hence the above.
Monckton, all the verbal diarrhea in the world can’t counter the fact that your “pause” itself is getting warmer each time you create this fantasy.
Asked and answered, repeatedly. The head posting addresses that question directly and fully. Read it.
Monckton wrote: “During the entire 11-year record, the ocean’s surface layers are shown as not warming at all….”
An outright lie. HadSST3 shows +0.15 C of warming in the last 15 years — and it isn’t even a time interval representative of climate.
Data:
http://www.metoffice.gov.uk/hadobs/hadsst3/data/HadSST.3.1.1.0/diagnostics/HadSST.3.1.1.0_monthly_globe_ts.txt
“Don’t be childish, Davikins”, says Nanny, as she ruffes his gorgeous, golden curls fondly. “You see, Lord Monckton was talking about the most detailed ocean measurements we have, from the ARGO buoys. No, not boys like you, Davy-wavy-woo, but buoys. There are more than 3500 of them, and – unlike the sea surface temperature datasets, which have been endlessly tampered with to make it look as though the sea is warming – they show no warming of the surface layers.
“So you mustn’t call that nice Lord Monckton a liar in that angry way, Davikins. I mean, look at you, your face is almost as Red as your politics. That nice Lord Monckton was quite right about the ARGO buoys. So you’d better say sorry to him before you go to bed, or if you die in the night you’ll have a big sin on your soul, and you wouldn’t like that, now, would you?”
The data shows you wrong, Monckton.Yet again. (Notice how you completely ignored the data here.)
But we should give him partial credit for creativity… as in creative writing…it is National Novel Writing Month http://nanowrimo.org
Now, now, there, there, little Appell of my eye,” says Nanny, “You must learn not to lie, Davikins. You see, that nice Lord Monckton had cited the evidence of the ARGO ba-thy-ther-mo-graph buoys. The data show that the upper strata of the ocean are not warming. The lower strata – down about a mile to a mile and a quarter, are warming. On average, the top slab of ocean is warming at a rate equivalent to 1 degree every 430 years. The data come from ARGO. So don’t lie by saying that nice Lord Monckton had “completely ignored the data”). He had cited it for you, Davy-wavy-woo, not once, not twice, but three times. Do you see how very silly and babyish you look when you lie? Better not to do that, because it’s not just silly, it’s naughty.”
Monckton doesn’t understand the difference between heat and temperature.
I find this is true of a great many deniers.
I have a couple of our Lord’s blatant lies documented – I wonder if it is doing that on purpose to mislead.
Best,
D
Don’t be dim. Read the head posting, where it is all made clear. The ocean is not, repeat not, warming at the surface, according to the ARGO buoys (well, it may be at the moment, on average, with a strong el Nino running), but for the 11 full years of the ARGO data the surface was not warming at all. Now, there is nothing in the comment to which you are replying that in any way mixes heat with tempeature: for that posting talks exclusively about temperature. If you want to know how to convert from the temperature that the ARGO buoys measure to the heat content that the NOAA graphs tend to prefer (because the numbers look bigger), read any elementary textbook of physical quantities.
And, if in future your hate-filled heart wants to accuse someone of not understanding what you do not yourself understand, then be specific.Display what little knowledge you may have. But you won’t. Because you can’t. Because you know you’re wrong. You’re lying, again.
Monkie wrote: “The ocean is not, repeat not, warming at the surface.”
False. Sea surface temperatures have risen +0.15 C in the last 11 years:
http://www.metoffice.gov.uk/hadobs/hadsst3/data/HadSST.3.1.1.0/diagnostics/HadSST.3.1.1.0_monthly_globe_ts.txt
HadSST does not measure ocean temperatures but the air at the ocean surface. ARGO measures ocean temperatures and shows no surface warming. RSS and UAH measure air temperatures above the ocean surface, and they show no warming. So where is the warming coming from that is causing the air between two non-warming surfaces to warm? Answer me that. Try thinking, rather than simply repeating yourself futilely.
Lordis Monkey wrote: “HadSST does not measure ocean temperatures but the air at the ocean surface.”
False. “HadSST3 is produced (a slightly more detailed description) by taking in-situ measurements of SST from ships and buoys….”
http://www.metoffice.gov.uk/hadobs/hadsst3/
Asked and answered seven or eight times previously in this thread. HadCRUT4 is a combined land and sea surface air temperature dataset. The air temperatures over the ocean are of course measured by ships and buoys. There is nothing in the quoted sentence to suggest that HadSST3 is taking sea temperatures, for the good and sufficient reason that it would be extremely bad physics practice to mix land air and ocean water temperatures and expect to get any meaningful result at all. Try thinking rather than petulantly reciting the same plaintive falsehoods a dozen times over.
I’m Ill. I have time at present to sit here 24 hours a day if necessary, answering your stupidities. You make yourself look smaller and smaller by your hate speech, your lack of any physical knowledge, your inability to distinguish between heat, heat content, heat capacity and temperature, and now, to cap it all, your inability to tell the difference between air and water.
What does “in situ” mean?
Asked and answered. The HadSST time-series is the seaward part of the HadCRUT4 landward and seaward air temperature series. Naturally, the most obvious way to measure sea surface air temperature is by ships and buoys. Check with the Hadley Centre.
HadSST3 does “in situ” measurements. Stop lying.
Chris, as a someone trying to sort out the AGW issue, I find the discussion very interesting.
I went to David’s HadSST link and found this: “Drifting buoys consist of a plastic ball, approximately 30 cm in diameter, attached to a drogue. The drogue ensures that the buoy remains correctly oriented and that it drifts with the currents in the mixed layer. The SST sensor is embedded in the underside of the buoy and measures at a depth of approximately 25 cm in calm seas.”
So it seems that David is correct in saying that HadSST measures ocean temperature.
Lurd Monkey wrote: ”
RSS and UAH measure air temperatures above the ocean surface, and they show no warming.”
False. RSS and UAH measure microwaves.
They use a model to convert them to temperatures. A model.
Don’t be childish. RSS and UAH measure air temperatures by the use of microwave sounding units, as I have instructed you several times before, just as thermometers measure air temperatures by the expansion of mercury in a tube. The level of indirection is precisely same in each instance: but the satellites have an additional self-calibration system in the shape of platinum resistance thermometers, which measure temperature in yet another way, by the minuscule alterations in the electrical resistance of a fine platinum wire undergoing very small changes in ambient temperature. Grow up and think a little. And by all means keep going with these pathetic, repeated fatuities: for ClimateDepot gets tens of thousands in additional ad revenue if it can demonstrate a high comment-count. You – or rather your climate-Communist paymasters – are helping to pay to spread climate skepticism to an ever large audience. And you are providing me with a chapter for my new book – and possibly a short book in its own right, demonstrating the level of intellectual dishonesty, childish pettiness and abject, invincible scientific ignorance of the typical paid climate-Communist troll. It will be an instant best-seller in the humour section of your local bookshop. You can go and autograph copies, if you like, but I’ll get the royalties.
Liar. RSS and UAH **Calculate** temperatures based on measurements of microwave intensities.
The satellites don’t contain thermometers, dummy.
They have sensors that measure microwave intensities. They use a model to convert them to temperatures.
Climate Algorithm Theoretical Basis Document (C-ATBD)
RSS Version 3.3 MSU/AMSU-A
Mean Layer Atmospheric Temperature
http://images.remss.com/papers/msu/MSU_AMSU_C-ATBD.pdf
I can see now how you have garnered the reputation of a liar and clown w.r.t. climate change.
“And you are providing me with a chapter for my new book – and possibly a short book in its own right.”
Clown. Just like you threatened to sue — how many people now? The Internet has lost count.
Pathetic.
“RSS and UAH measure air temperatures by the use of microwave sounding units”
Prove it.
“It will be an instant best-seller in the humour section of your local bookshop. You can go and autograph copies, if you like, but I’ll get the royalties.”
You sound exactly like a child.
Where is your link to the ARGO 0-10 m data? And graph?
The hapless Appell shifts his ground. He had at first made the statement that the satellites do not measure temperatures. I had pointed out that they measure temperatures in two ways: they self-calibrate using platinum-resistance thermometers to measure the known temperature of the cosmic background radiation, and they measure temperatures using microwave sounding units. The level of indirection in both these methods is the same as that of measuring temperatures by the thermal expansion and contraction of mercury in a glass tube. One is not directly measuring the temperature there either: one is directly measuring the expansion of the mercury and applying a well-tried model to the conversion of that observation into temperature change. Haud secus with the microwave sounding units.
Asked and answered. Mercury thermometers use a model to convert the thermal expansion of mercury to temperature change.
False. UAH and RSS use models to convert microwave data to lower troposphere temperatures.
UAH has been absolutely full of errors and corrections in the last 20 years.
The Great Monkey wrote: “HadSST does not measure ocean temperatures but the air at the ocean surface.”
You would think someone who falsely claimed they were a member of the House of Lords would know how to read. But no.
“HadSST3 is produced (a slightly more detailed description) by taking in-situ measurements of SST from ships and buoys….”
http://www.metoffice.gov.uk/hadobs/hadsst3/
Asked and answered.
HadSST3 says they use In Situ data. What does that mean?
Chris, as a someone trying to sort out the AGW issue, I find the discussion very interesting.
I went to David’s HadSST link and found this: “Drifting buoys consist of a plastic ball, approximately 30 cm in diameter, attached to a drogue. The drogue ensures that the buoy remains correctly oriented and that it drifts with the currents in the mixed layer. The SST sensor is embedded in the underside of the buoy and measures at a depth of approximately 25 cm in calm seas.”
So it seems that David is correct in saying that HadSST measures ocean temperature.
What a lot of nonsense!
Monckton fails to address why, if there has been no global warming, all global surface temperature data-sets show statistically significant warming since 1997. http://www.ysbl.york.ac.uk/~cowtan/applets/trend/trend.html
All the temperature data sets show warming since 1997. Despite what Monckton says above, UAH satellite data show a warming trend of 0.104c per decade since 1997. This is not statistically significant only because all satellite data have massive margins of error. I can only assume that Monckton is using the outrageously adjusted UAHv.7 data which are not officially recognised as the ginormous adjustments have not been peer reviewed.
Not only do all the surface and satellite data show that the globe has warmed since 1997, other metrics have also been observed. For instance, the increased rate of ice loss Antarctica, the melting Greenland ice-sheet, the warming oceans, the retreat of almost all glaciers etc.etc.
This last ditch attempt of disinformation is looking increasingly pathetic. 10/10 for effort, 0/10 for content.
Because they have been manipulated significantly over the last 35 years.
Read Hansen, et al. 1981… Compare that chart with today’s
Not according to Judith Curry.
http://judithcurry.com/2015/02/09/berkeley-earth-raw-versus-adjusted-temperature-data/
That they have been adjusted is undeniable. Go to NASA’s website and look up Hansen’s 1981 paper.
Warming from 1880 to 1980 has at least doubled SINCE 1981
Adjusted and manipulated are not the same thing.
Of course they’ve been adjusted.
The adjustments have tended to reduce the apparent warming trend rather than increase it.
So why has warming from 1880 to 1980 doubled since 1981?
Do you need a link to the 1981 paper? Or alternately just go to steven goddard’s website. He documents it all there using NASA own work
LOL
Steven Goddard?
Hahaha
He doesn’t exist, it’s a made up name by some bloke called Tony Heller who wanted to make it sound like he some relationship to NASA.
And yes, a link to the 1981 paper would be good, thanks.
The only data set with massive adjustments is the uah v6.0 one which Monckton uses. The adjustments were made to eliminate the 0.104c per decade warming recorded by uah v5.6 since 1997.. This new dataset is not officially recognised as it has not been peer reviewed.
Did you look at Hansen, et. Al 1981? No. Than how do you know?
The corrections for known errors to the raw data have had little affect to the raw surface temperature records. http://1.bp.blogspot.com/-lwQfxPaXFd0/VNoo9h7vUhI/AAAAAAAAAhA/iW8rexGjbgU/s1600/land%2Braw%2Badj.png
The climate models projections are pretty much spot on. http://www.climate-lab-book.ac.uk/wp-content/uploads/fig-nearterm_all_UPDATE_2015b.png
You didnt look at hansen et. Al 1981 did you? 1880 to 1980 warm8ng has doubled sonce 1981. How is that possible if what you say is true.
Strange the last ipcc didnt agree.
The raw real data. Or the raw data where they infill 40 percent of the readings. LOL
You only have to do a simple graph of satellite data to highlight the rank dishonesty of ‘monckton’ and his co-conspirators. The warming trend for the last 16 years, the last 20 years and the entire UAH satellite record are virtually identical. There is no ‘pause’ in global warming, as ‘monckton’ himself acknowledges further down this comments thread. Cherry-picking non-robust short-term trends from one cherry-picked dataset, which itself (by monckton’s own admission) represents only a tiny proportion of the heat content of the climate system, is a transparent attempt at fraud, and an admission that his anti-science position is indefensible.
He posted the entire UAH chart in the article with the slope line.
Why dont you just refer to that you mor0n.
As one of monckton’s co-conspirators in the global warming denial scam, you’re expected to blather away in defence of his deceit, but it’s futile. It’s glaringly obvious that the claim of “no global warming for x years!” is just an attempt to fool the public, nothing more. The reality (as admitted by monckton himself in this comment thread) is that global warming continues unabated.
So you are just a denier then. Denier of satellite data. Denier that greenhouse gasses are supposed to warm the ttroposphere. Its your problem. Not mine.
The 16-year trend shows unabated warming. The 20-year trend shows unabated warming. The trend for the full dataset shows unabated warming. Monckton cherry-picks the period which is least representative of the overall warming trend in a laughably transparent attempt to deceive his readers, and you support him. Why?
No it doesnt. Surely not RSS. And 1998 was by far the bottest.
Quit lying. And even if it does the warming is much less than it should be.
Why the discrepancy.
Monckton caught lying again.
http://dialoguesonglobalwarming.blogspot.com/2015/05/wuwt-and-monckton-caught-lying.html
Your article is Horse sheet. Satellites say it hasn’t warmed in
almost 20 years.. Why are you a satellite data denier. Why are you an
Arctic Sea Ice Denier. Why are you a denier that Anatractica has been
gaining ice?…
Have you read Hansen, et. al 1981 yet? No. Why not?
BECAUSE YOU ARE A LAZY RACIST BEETCH of a DEMOKKKrat
planet: Why are you ignoring the large ocean warming taking place? Instead you are fixated on one relatively small part of the climate system, the lower troposphere, which is subject to significant natural variation.
Good link!
Peter Johnson ( https://disqus.com/by/disqus_NKO0O32p9z/) made a great comment there. He doesnt post heavily, but quite well thought through.
“An excellent expose! What Monckton and other deniers are, is comparable to being midway hustlers at county fairs—they frequently give an impressive sounding rattle trap spiel filled with falsehoods and errors—some of which must be quite embarrassing. And when Monckton responds to criticism by simply altering the words he previously used, his brazen hustling becomes so painfully obvious.”
And cunudiun (https://disqus.com/by/cunudiun/ ) made a great contribution with the graph!
True Robert. I think of the deniers about like the TV preacher/hucksters, And as you well know that hiatus thing has been debunked to death. You probably noticed too that Chris did a good job moving Cunudium’s post to it’s own blog and Peter Johnson commented again.
http://dialoguesonglobalwarming.blogspot.com/2015/05/the-great-warming-pause-lie-revealed.html
Both RSS and UAH show multi-decade warming trends of around 0.12 deg C per decade.
http://blog.hotwhopper.com/2014/08/whats-happened-to-global-warming-in.html
Lewandowsky et al 2015 The “Pause” in Global Warming: Turning a Routine Fluctuation into a Problem for Science http://journals.ametsoc.org/doi/pdf/10.1175/BAMS-D-14-00106.1
Does NASA have satellite temperature data?
“the rate of global warming has continued, and there has been no slow down.”
http://earthobservatory.nasa.gov/blogs/earthmatters/2015/06/05/parsing-the-details-of-the-warming-hiatus
One other thing, when talking about some kind of pause, how do you account for this: By now, it’s almost a statistical certainty: in January 2016, we will say that 2015 was the warmest year on record; for the moment, we can clearly say that this September was the hottest on record.
http://www.zmescience.com/ecology/climate/earth-just-had-the-warmest-september-on-record-by-a-long-shot/
While we spend time here, it is important to note that the climdep, wuwt, jo no, et al propaganda is not really working.
That’s good to know. Here is a funny link from the Onion. http://www.theonion.com/article/climate-change-deniers-present-graphic-description-51129
Poll: Americans Starting to Worry About Climate Change Now That It Affects Their Lawns
BY ANDY BOROWITZ
^^ Hilarious! 🙂
Climate Change Reframed for GOP: “Oceans Invading U.S.”
WASHINGTON (The Nil Admirari) – Today, climate change scientists reframed their argument to appeal to Republicans by releasing “Oceans Invading U.S,” a new documentary film warning Americans about a slow, insidious invasion of American soil by tyrannical oceans that surround the United States. TNA viewed the 10-minute film, which asserted, “true patriots must defend America by starving the communist-fascist oceans of an anti-American, possibly Muslim, substance called carbon dioxide.”
“‘Oceans Invading U.S.’ does not mention climate change even once. It turns a lot of complicated scientific things into a patriotic appeal to protect the United States and its soil from very scary oceans, and tells Republicans they aren’t real men like Russian President Vladimir Putin if they refuse to do what the film suggests,” explained TNA Senior Researcher Dick Schneider.
https://en.wikipedia.org/wiki/Climate_change#/media/File:ShipTracks_MODIS_2005may11.jpg
The Atlantic Ocean – drunk on carbon dioxide – taking cover under clouds as it prepares for another attack on the mainland of the Northeastern United States.
Schneider added, “And what the documentary suggests is to massively curb carbon dioxide emissions as quickly as possible, because if the Republicans don’t do that they are in favor of rendering aid to the very oceans that are our enemies. The oceans are described with various dog whistles like ‘liberals,’ ‘feminists,’ ‘takers,’ ‘gays,’ and, of course, ‘Muslims.'”
“The film also largely ignores the rest of the world and focuses exclusively on what is in the best interests of the United States, namely destroying the imminent threat of both the Atlantic Ocean and Pacific Ocean,” stated Schneider.
Most Congressional Republicans had watched “Oceans Invading U.S.” by press time, and a majority wanted to launch immediate airstrikes on the oceans while the mad-right House Freedom Caucus asked if there was a plug to pull that would drain the oceans “to somewhere, possibly China.”
http://www.theniladmirari.com/2015/10/climate-change-reframed-for-gop-as-oceans-invading-united-states.html
Since we’re on a comedy run. From the lord himself
“Anyway, as i have said, your stupidity is making lots of money for Marc Morano: the comment-count has just crossed one of the advertising trigger-points for thousands of dollars in extra revenue. I won’t tell you where the next break-point is, but it’s not far a way, and if this thread makes it, Marc makes not thousands but tens of thousands. “https://disqus.com/home/discussion/climatedepot/no_global_warming_at_all_for_18_years_9_months_a_new_record_8211_the_pause_lengthens_again_just_in_t/#comment-2351057440
Barely a thousand coments. Hosted on another site,”and if this thread makes it, Marc makes not thousands but tens of thousands. ”
While it isn’t parody, our now only having a year to go (as opposed to the Canadians taking 11 weeks ) should generate more of this:
PPP Uses the Power of Pyramids to Figure Out Which Republican Candidate Has the Weirdest Supporters
http://www.motherjones.com/kevin-drum/2015/11/ppp-uses-power-pyramids-figure-out-which-republican-candidate-has-weirdest-suppor
We should look for Ben Carson to get a bump in the polls for ignorance. 🙂
Majority of Americans believe in Astrology. Does it make it true? Global warming is government hoax to screw ordinary people in the name of “equality” and “clean living” while taxing them to oblivion and paying bureaucrats their inflated salaries and pensions
Might want to try reading the thread…..
I did and your point?
What’s the name of the law written to describe atmospheric thermodynamics? What is the factor for spectral resonance in that law, that’s used when solving for temperature?
Is the atmusfear a big ol’ heetur up thair in the sky, stupid? LooooLoL you gubmunt school hick the same people feeding you that ignorant lie
is the ones who teach you about how pot is like heroin in your gubmunt school.
Ignorant hick.
Sure you saw the other part of Peter’s post. 🙂
“I enjoyed the short videos explaining some of the outrageous deceptions used by Monckton, as well as some devices used by his fellow deniers. Nothing is quite as absurd as a denier who only works as a local weatherman but does not even have a BS in meteorology? Or like Moncton, whom after being caught in his own lie about being an adviser to Margaret Thatcher, then tries to backpedal by claiming that he was only joking? Ha Ha, Lord! Why should the future survival and health of mankind be of any real significance? Just go on offering your verbal teddy bears as prizes for trying to beat a game that you know full well, is actually being rigged—by yourself and your fellow con-men—er deniers, er—scientists?”
I just put him in my Follow list!
Discus does not work now when trying to read your comment history.
That’s odd. I wonder why?
Me too… It works okay on all the others. I get a yellow block message at the bottom of the screen (Discus is not responding). Sometimes they have a temporary glitch or maybe you are spamming links?
Both are working for me.
Maybe the climdep server is getting hammered with a 1k (over how many days?) comment thread.
The thread that monckton claims:
“Anyway, as i have said, your stupidity is making lots of money for Marc Morano: the comment-count has just crossed one of the advertising trigger-points for thousands of dollars in extra revenue. I won’t tell you where the next break-point is, but it’s not far a way, and if this thread makes it, Marc makes not thousands but tens of thousands. “https://disqus.com/home/discussion/climatedepot/no_global_warming_at_all_for_18_years_9_months_a_new_record_8211_the_pause_lengthens_again_just_in_t/#comment-2351057440
Barely a thousand coments. Hosted on another site,
“and if this thread makes it, Marc makes not thousands but tens of thousands. “
II can open jmac’s comment history and just did again… He has a comment on The Hill and there are 183 comments but I could not post an upper or scroll down to the following comments.. Got the same message, (Discus is not responding.) Everyone else I follow it works alright.
Thanks for pointing that out.
I had wondered why Lord Haw Haw was so responsive to insults, that would probably explain it.
I’ll wind down my contribution, though he is like an itch that you just can’t stop scratching.
I think his revenue stream is as fictitious as his ‘gonna sue’, ‘ miracle cures, and his ‘pause’ science.
I’m having disqus problems too. A post I made to you and E the other day on another site still shows as ‘pending.’ I don’t know if you ever got it, so I’ll try to re-post here:
I don’t go out for a walk without the pepper spray, and I won’t hesitate to use it if necessary.
There have been some break-ins in the community lately, and I remain alert.
I would be up sh*t creek without a paddle if I didn’t have a car here. Thanks to the two of you for your friendship. C.
Some sites will put a comment on pending for writing the word sh*t.
We think of you often C and wish we were closer to where you live. E says Hi and to take good care… If you can buy a can of hornet spray. It’s better than pepper spray to stop anyone or any animal andit has longer range and is accurate.
I thought that was the most likely reason.
What If I type *shit* here? Will I get deleted, or be pending ;-? This is a test..
You had mentioned to me about the efficacy of hornet spray once before. Maybe I can order some online.
Say Hi to E from me too.
It depends u[on the site,, Grist usually peds it, so do some others. .
There is no ‘discrepancy’ as all datasets show the same rate of warming, to within two or three hundredths of a degree per decade, and perfectly in line with predictions.
http://a.disquscdn.com/uploads/mediaembed/images/1539/5339/original.jpg
Your article is Horse sheet. Satellites say it hasn’t warmed in
almost 20 years. Why are you a satellite data denier. Why are you an
Arctic Sea Ice Denier. Why are you a denier that Anatractica has been
gaining ice?…
Have you read Hansen, et. al 1981 yet? No. Why not?
BECAUSE YOU ARE A LAZY RACIST BEETCH of a DEMOKKKrat
why did you start in 1984?
CHERRY PICK.
I don’t believe you’re really as clueless as you’re making yourself out to be here. As the WMO say:
“Climate ‘normals’ are reference points used by climatologists to compare current climatological trends to that of the past or what is considered ‘normal’. A Normal is defined as the arithmetic average of a climate element (e.g. temperature) over a 30-year period. A 30 year period is used, as it is long enough to filter out any interannual variation or anomalies, but also short enough to be able to show longer climatic trends.”
That’s why I plotted 30-year trends, as I’m sure you’re well aware.
You didn’t use enough CapITaLs… Or phunny spelin’…..
And then we look at the BIG picture…..
Ouch. Talk about shooting yourself in the foot. I’ve been highlighting the utter dishonesty of monckton and his co-conspirators in this thread, and then you come along and do exactly the same kind of thing, by showing a graph of local temperature, with no data since the end of the 19th Century, and calling that “the BIG picture”.
If I didn’t know better, I’d think you were actually trying to discredit yourself.
So a long-term temperature reading taken from one point in the Northern Hemisphere showing fluctuations of several degrees over long periods of time is somehow invalid, yet your graph of a miniscule .04C overall global warming over 30 years is somehow proof we’re all going to die?
Cherry picking short time periods and claiming global catastrophe is nothing new.
https://stevengoddard.wordpress.com/1970s-ice-age-scare/
“…yet your graph of a miniscule .04C overall global warming over 30 years is somehow proof we’re all going to die?”
It’s 0.4°C, not 0.04°C. You’re an order of magnitude out.
If you take the trouble to read the thread, you’ll see that my graph of 30-year trends addresses a very specific point about the current rate of global warming, nothing else.
Look at the long-term trend of global (not local) temperature:
https://a.disquscdn.com/uploads/mediaembed/images/2779/3173/original.jpg
It clearly shows that in just 50 years we have already warmed the planet more than enough to reverse the ~0.7°C of natural global cooling since the Holocene Thermal Maximum of several thousand years ago. And the crucial point is, it’s not going to stop. Not for decades and probably centuries to come, just because of the straightforward laws of physics.
That graph is obviously wrong — it was not 1 C globally warmer during the Medievel Climate Anomaly than today.
Hay dumb ass can you tell me how warm it was in Green Land when the Vikings settled and farmed there? And research shows that the Roman warming period was even warmer than that! Must of been all the CO2 emissions from those damned Chariots Right? Funny thing though there are no stories of cities being sunk from all that melting ice right? You people in your omission of historical facts even prove the Boobs that you are!
Well that was comical. It could just as well have come from a bot, stringing together half a dozen anti-science memes at random, from the selection of more than a hundred that the perpetrators of the global warming denial scam have come up with in their attempts to deceive the public. If you’re going to be a good scammer, you have to make an effort to be more convincing! 🙂
All your stupid computer models can not argue against physical evidence! In fact they prove your computer models frigging worthless! You have NOTHING to stand on! Its time for you and your kind to move on and concoct a new Globalist Power grab to enslave humanity! So hows them Apples pal?
Great when a post starts with “dumb ass” ……. you can pretty much predict what will follow.
And he isn’t deceiving anyone YOU LYING SCUMBAG. He has the entire trend UAH in his article with the positive slope. He is actually totally transparent in this article.
You guys are such morons. You have dipshits here claiming that it lines up with the models perfectly… when it doesn’t. And Monckton gives, what maybe one of the biggest reasons for that in his article. Why? Methane concentrations haven’t risen.
Most of the warming from AGW in the models is not from CO2, it’s from the follow on forcings and none of those are occurring yet.
WE know the facts and the arguments from both sides. MUCH BETTER than you. Because we have researched them on our own. YOU HAVE NOT… So all you have is stupid worthless appeals to authority…. which thankfully, the voting public really doesn’t buy.
SO GO TO HELL You lying piece of sheet. The more stupid comments you make the more you discredit the entire FAUX movement.
This is how you and monckton lie.
https://www.youtube.com/watch?v=TRCyctTvuCo&list=PL82yk73N8eoX-Xobr_TfHsWPfAIyI7VAP&index=21
Your article is Horse sheet. Satellites say it hasn’t warmed in
almost 20 years. Why are you a satellite data denier. Why are you an
Arctic Sea Ice Denier. Why are you a denier that Anatractica has been
gaining ice?…
Have you read Hansen, et. al 1981 yet? No. Why not?
BECAUSE YOU ARE A LAZY RACIST BEETCH of a DEMOKKKrat..
Why are you an ocean heat denier? Over 90% of the trapped heat goes there.
planet wrote: “Most of the warming from AGW in the models is not from CO2, it’s from the follow on forcings and none of those are occurring yet.”
This is wrong. CO2’s radiative forcing is what it is. It doesn’t go away.
He is not using the officially recognised UAH data because that shows a warming trend of 0.104c per decade since 1997. The dataset he uses has been heavily adjusted for no known reason other than to remove this trend entirely. These gigantic adjustments have not been peer reviewed, unlike the tiny corrections to surface data which have had zero impact on temperature trends over the past 18 years anyway.
Monckton does not mention that all the global surface temperature data (which Carl Mears of RSS says are more reliable than satellite data) show statistically significant warming. He does not mention that during the last 18 years the extent of summer arctic ice has receded, that the Greenland ice-sheet has been melting, that almost all glaciers have shrunk and that the loss of ice in Antarctica has accelerated.
His whole essay is a rather sad last ditch attempt at disinformation.
Adjustments, lies and e-mails desperately seeking to hide the truth are the Warmists stock in trade.
Are you in favor of the adjustments done to the satellite data?
Their use of climate models to cover over missing patches of the globe?
Are you aware the UAH group won’t share their code with anyone?
http://rabett.blogspot.com/2015/12/uah-tlt-series-not-trustworthy.html
Nice to see a calm and clearly reasoned reply!
Methane concentrations were flat from about 2000-2006. They have resumed their increase since.
You need to do better research.
What are you talking about? The fact remains that methane concentrations are MUCH LOWER than projected. That would account for some of the “missing heat” or most of it.
You warmists are all a bunch of FUC*WADS.
And again… all the information is laid out there right there in the article.
It has nothing to do with any “missing heat.”
Projections are *projections*, only. They aren’t reality. Learn to distinguish the difference.
Ohhh So … science doesn’t involves making hypothesis and testing hypothesis? Again moron. The point aren’t his predictions… The point is the “adjusted data”. I know that’s too much to get through your thick skull.
Data are “adjusted” to correct for biases in the historical data.
How would you prefer to correct for those biases?
Then why do almost all the changes go in the same direction… Why is there a .98 r2 value for the changes and CO2 concentration when you plot them?
The changes don’t all go in the same direction. In fact, adjustments REDUCE the long-term warming trend.
(See Karl et al, fig 2)
Link please
See Karl et al, Science 2015, Figure 2, which I’ve pasted up here:
http://davidappell.blogspot.com/2015/10/does-senator-smith-know-noaas.html
Impressive… so with one “correction” you’ve adjusted 60 years of temperatures up what is it… Your graph sucks… .35C? What were the original error bars… These climastrologists play with their temperature sets like they’re personal toys.
I’m not sure you accurately even label what this graph is on your website. Sea surface… total earth surface temperatures… You’re a fraud… just like Karl.
Why doesn’t the surface record agree with the satellite record?
Why should the surface record agree with the satellite record? They are measuring different things….
LOL… Yes… The surface record is measuring a few areas and then interpolating 40% of the rest… The satellites see the whole earth except for the poles.
40%? No, sorry.
Satellite data must be corrected for orbital drift, diurnal heating, instrument calibrations, and more. It’s actually quite a complex model needed to convert microwave intensities into temperatures.
Yet you get good coverage and you have many points available to calibrate it. In the surface temp record… you simply infill… often times ignoring data you don’t like….
A satellite group’s algorithm:
“Climate Algorithm Theoretical Basis Document (C-ATBD)”
RSS Version 3.3 MSU/AMSU-A
Mean Layer Atmospheric Temperature
http://images.remss.com/papers/msu/MSU_AMSU_C-ATBD.pdf
Was there a point to be made somewhere?
Also, AGW predicts that the Lower troposphere should warm first and drive the warming at the surface… Another FAILURE.
It depends on whether you trust the tropospheric temperature models. Many are coming to the conclusion they do not (and this wouldn’t be the first time those models have made big errors).
I KNOW the surface temp records are constantly changed… Go read Hansen, et. al. 1981 and look at the charts then.
No, it does not. The surface is part of the lower troposphere. And you’ve offered no proof.
no proof of what?
Dumb. You can’t apply a projection to a reality that never happened.
Why is this so hard to understand?
It’s called the scientific method. What is a projection but a hypothesis.?
Climastrology model is…
1. Make hypothesis.
2. Test hypothesis.
3. When hypothesis fails.. change the data.
Any way you entirely missed the point. and I’m not going to explain it to you but this last one time. Lower than expected methane concentrations COULD be a large reason that the temperature rise hasn’t occurred.
Again, you can’t apply a projection if its assumptions didn’t happen.
This shouldn’t be hard to understand.
Duh… That was my point.
The 16-yr trend does show warming, but the 18-yr trend doesn’t. This is why deniers play games with the 18-yr trend — it includes that big 1997-98 El Nino. It’s all they have.
You sound like another ”Pot is Like Heroin Church believer, too. Pot is like Heroin, and the atmosphere is a BIG OL Giant HEETUr up THAIR!
F****g hicks. No wonder you dope addled gubmunt schoolers lag so far behind everyone else.
Here’s a hint stupid the atmosphere’s a giant frigid fluid bath, shading, scrubbing, and phase-change refrigerating the planet. The laws of thermodynamics f.o.r.m.a.l.l.y. f.o.r.b.i.d. your r.e.l.i.g.i.o.n. being possible, stupid.
That’s why your sister Michael Mann was so panicked about people getting his hockey stick program, and it’s why his own friends admit it makes hockey sticks, and it’s why the entire world knows it hasn’t warmed for practically two decades.
It’s climate scientists who said it’s not warmed all that time.
http://tinyurl.com/ocfh25t
“The laws of thermodynamics f.o.r.m.a.l.l.y. f.o.r.b.i.d. your r.e.l.i.g.i.o.n. being possible, stupid.”
No such thing. Dumb.
You link is over 2 years old — worthless. Mann’s code has been available for 10 years. But try getting the code from the UAH group who does satellite modeling of atmospheric temperatures. They won’t share it.
http://rabett.blogspot.com/2015/12/uah-tlt-series-not-trustworthy.html
Stop your crying about two year old links, the fact is, THEY SAID it. Trying to claim it’s OLD truth isn’t a defense, it’s you,
crying,
because your fake physics religion doesn’t work.
The laws of thermodynamics certainly do not rule out warming. Warming has occurred many times in the past.
Stick to accounting.
The laws of thermodynamics most certainly rule out the atmosphere warming the planet. The atmosphere is a frigid fluid bath washing a rotating sensor strewn sphere illuminated by a light.
Presence of the atmosphere contributes three modes of cooling:
diffraction losses due to energy deflected to space
conduction losses due to the gas envelope’s cold gas scrubbing the surface of heat.
phase change refrigeration losses due to green house species phase change refrigerant water
Suspending more of the gases creating two of the modes of cooling of the sphere of the earth
will not result in more energy arriving at the surface, it will result in less arriving.
Primary losses due to the atmosphere are green house gases blocking sunlight infrared in.
About 40% sunlight is infrared, green house gases block half that: 20%.
Suspension of sufficient green house gases to block 25% would result in more cooling.
Your religion about the atmosphere being a giant heater is simply false which is why none of you can predict what thermometers will depict when a light shines on them.
“The laws of thermodynamics most certainly rule out the atmosphere warming the planet.”
The atmosphere DOESN’T warm the planet.
It blocks the planet from cooling, which leads to a net temperature increase in the lower atmosphere and a cooling in the upper atmosphere.
“Your religion about the atmosphere being a giant heater is simply false which is why none of you can predict what thermometers will depict when a light shines on them.”
The atmosphere isn’t a “giant heater.”
This is typical of deniers — they misunderstand the science, and they disparage the real science based on their misunderstanding.
What a joke.
You’re the one with the story about magic gas made the sky a heater, stupid.
Don’t try to change the subject to your warmist friends’ discussions about how you can’t tell just how MUCH a heater the Magic Gas made the sky become.
The law of thermodynamics written to describe atmospheric energy FORMALLY FORBID reference to frequency of light interacted with in SOLVING for TEMPERATURE
by assigning every single gas,
from nitrogen
to carbon dioxide
to oxygen
to methane
to argon
to radon
IDENTICAL ENERGY.
This SOLE inclusion in ATMOSPHERIC THERMODYNAMICS
MAKES POSSIBLE the LAW which BONDS the OBSERVED PHYSICS and CALCULATIONS of
ALL the GAS laws
and is the LAW of THERMODYNAMICS men had worked to write for HUNDREDS of years.
You believe magical gases in the atmosphere make it into a giant heater.
It’s why you can’t accurately predict what happens when a light shines on a thermometer.
It’s why every time you start discussing your religion in front of working thermodynamicists,
they start mocking your stories about the heaturistical hotterisms and how the core of the giant heater is the gases that CREATE TWO of the THREE MODES of COOLING
created by existence of an atmosphere.
‘You believe magical gases in the atmosphere make it into a giant heater.”
Stupid: how many times do you need to be corrected???
The atmosphere is not a heater. The atmosphere blocks outgoing heat, which decreases cooling.
There is a sphere suspended rotating in vacuum without atmosphere illuminated by a light.
Energy in is at 100%. Modes of energy LOSS are one: radiant. Modes of energy GAIN are one: radiant.
Immediately upon suspension of an atmosphere around the sphere of the globe there is created
by virtue of the EXISTENCE of that ATMOSPHERE a UNIQUELY DEFINED, DESCRIBED, THERMODYNAMIC MODE of ENERGY MODIFICATION, a LOSS: a COOLING named DIFFRACTION LOSS.
As soon as 1% GREEN HOUSE GASES are SUSPENDED the uniquely named mode of COOLING is created in reduction of energy at the surface of 1%.
As soon as enough GREEN HOUSE GASES are SUSPENDED, the uniquely named mode of COOLING is created in reduction of energy at the surface of 5% creating more COOLING.
As soon as enough GREEN HOUSE GASES are SUSPENDED, the uniquely named
mode of COOLING is created in reduction of energy at the surface of 10 %
creating more COOLING.
As soon as enough GREEN HOUSE GASES are SUSPENDED, the uniquely named
mode of COOLING is created in reduction of energy at the surface of 15%
creating more COOLING.
As soon as enough GREEN HOUSE GASES are SUSPENDED, the uniquely named
mode of COOLING is created in reduction of energy at the surface of 19 %
creating more COOLING.
As soon as enough GREEN HOUSE GASES are SUSPENDED, the uniquely named
mode of COOLING is created in reduction of energy at the surface of 20 %
creating more COOLING SUCH THAT CONDITIONS are
AS THEY ARE TODAY. With 20 % diffraction COOLING.
IF THERE ARE MORE GREEN HOUSE GASES SUSPENDED such that 21% energy is LOST and diffraction COOLING is 21% that is the CREATION of more COOLING.
Until you explain how your church made you magically not have to FACE this fact.
“You’re the one with the story about magic gas made the sky a heater, stupid.”
An insulator isn’t a heater. But it keeps an object warmer, by reducing heat loss.
I am sorry you cannot understand this basic bit of physics.
DA, I believe that you haven’t ever gone beyond “basic physics” – and you apparently think the world is rigidly governed by “basic physics”… but, complicated physics have other effects, that counter your assertions.
High-school physics, for example, shows that friction between two wooden planks is reduced by putting a bit of sand between the two planks. Simple Physics, a reduction in the contact area. Yet, drag-racers mount huge “slicks” -tyres that increase the contact area. Inexplicable by ‘simple physics’.
An elegant story was published – rather than rewrite it all in my own words, here it is:
”To illustrate what this complexity means for the current “simple physics” paradigm, consider a similar “simple physics” problem in heat transfer. Suppose we take a block of aluminum six feet long and put one end of it into a bucket of hot water. We attach a thermometer to the other end, keep the water hot, and watch what happens. Fairly soon, the temperature at the other end of the block starts to rise. It’s a one-dimensional problem, ruled by simple physics.”
”To verify our results, we try it again, but this time with a block of iron. Once again the temperature soon rises at the other end, just a bit more slowly than the aluminum. We try it with a block of glass, and a block of wood, and a block of copper. In each case, after time, the temperature at the other end of the block rises. This is clearly simple physics in each case. As a final test, I look around for something else that is six feet long to use in the investigation. Finding nothing, I have an inspiration. I sit down, put my feet in the hot water, put the thermometer in my mouth and wait for the temperature of my head to start rising. After all, heat transmission is simple physics, isn’t it? So I just sit with my feet in the hot water and wait for the temperature of my head to rise.”
”And wait.”
”And wait …”
”The moral of the story is that in dealing with complex systems such as the climate or the human body, the simplistic application of one-dimensional analyses or the adoption of a simple paradigm based on simple physics often gives results that have no resemblance to real world outcomes. It is this inability of the current paradigm to lead us to any deeper understanding of climate that underlines the need for a new paradigm. The current paradigm is incapable of solving many of the puzzles posed by the variations in global climate.”
Eschenbach, Willis 2010. “The thunderstorm thermostat hypothesis: How clouds and thunderstorms control the Earth’s temperature.” Energy & Environment
http://citeseerx.ist.psu.edu/viewdoc/download?doi=10.1.1.306.5492&rep=rep1&type=pdf#page=43
I’m quite sure — with three degrees in the field — that I know orders more physics than you do.
Why do you sleep under a blanket at night?
Your blanket isn’t a heater, right?
CO2 isn’t a “heater.” Did you figure that out yet?
Yeah before you were born. Neither is water, neither are any of the atmospheric refrigerants called atmospheric gas molecules.
The atmosphere is not a heater, hillbilly. When the globe is rotating in vacuum lit by a light the energy to it for that distance is 100 %.
Immediately upon presence of an atmospheric envelope CO2 and the OTHER GREEN HOUSE GASES KICK 20% ENERGY to SPACE CREATING the FIRST UNIQUELY NAMED DEFINED MODE of ENERGY loss or COOLING by the virtue of the atmosphere’s existence: DIFFRACTION LOSS.
When enough GHGs are in the air 1% energy is LOST to DIFFRACTION COOLING that is the CREATION of a 1% ENERGY LOSS or a COOLING.
When enough GHGs are in the air 5% energy is lost to diffraction COOLING that is more COOLING.
When enough GHG COOLANTS are ADDED to the AIR there is 20% energy LOSS in diffraction COOLING that is FURTHER AMPLIFICATION of the COOLING and when more is added such that
21% should be lost to DIFFRACTION COOLING the Green House Gas COOLANTS will have CREATED MORE GREEN HOUSE GAS COOLING. Not MAGICAL HEATER IN THE SKY iSMS like YOUr ignorant self believed.
planet8788: What about the large warming in the ocean — in fact, an acceleration of warming.
Monckton Pause Update – it’s got to go
Monckton has held the start of the pause as February 1997. But it’s about to go.
“Key quote:
From next month on, the Pause will probably shorten dramatically and may disappear altogether for a time.
Sorry, your Lordship. If it is real and not a mathematical artifact of the data that you are selecting, then it won’t disappear because it has happened. The man is, however, a scientific nonentity.”
http://ingeniouspursuits.blogspot.com/2015/11/monckton-pause-update-its-got-to-go.html
http://ingeniouspursuits.blogspot.com/2015/11/monckton-pause-update-its-got-to-go.html
His follow on line to that suggests that the grunts just ignore any rise as a temporary blip, presumably even while they cling in desperation to 1998.
The pause may weaken or even reverse due to El Nino, a natural cycle. This will be temporary as are all climate “trends”.
If all climate trends are “temporary,” doesn’t the same thing apply to the pause?
See:
http://www.skepticalscience.com/graphics.php?g=47
I disagree. If the data are correct, then the last 15 years has seen little warming in the lower troposphere (0.03 C), whereas it was much higher 15 years ago (0.25 C).
WRONG AGAIN –
Comical… just comical.
https://a.disquscdn.com/uploads/mediaembed/images/2095/6070/original.jpg
Not even the correct graph for sat data!!! see below… and of course the graph starts in the late 70’s which is picked on purpose as it was one of the coldest years on recent record – typical BS..
“… starts in the late 70’s which is picked on purpose”
Hilarious!
Global temperature has now clearly exceeded that of the Holocene Thermal Maximum, meaning that we’re already into a warmer climate than modern human civilisation has ever experienced. In just half a century of AGW we have reversed several thousand years of natural global cooling, and there is a lot more warming to come, just from greenhouse gas emissions to date, let alone future emissions. Moreover, we are only just beginning to see the climate consequences of that warming.
The last thing we need now is the kind of dishonesty and outright denial of science exemplified by monckton and his fellow conspirators in the global warming denial scam.
Wow… That’s even steeper than a hockey stick… Congratulations… That’s an awesome fabrication.
What did you use… Photoshop or Microsoft Paint? Or Etch-a-Sketch.
It’s just what you get when you plot the last 10,000 years of temperature data. If you don’t like reality, that’s not my problem.
Lol. Too funny. Just 50 years ago all the scientists said otherwise.
Any idiot that thinks he has some credible scientific study that he found on a right wing deniers blog, that can’t get funding by Exxon to complete the study and have it published in a credible scientific journal, is stupid!
Your article is Horse sheet. Satellites say it hasn’t warmed in
almost 20 years. Why are you a satellite data denier. Why are you an
Arctic Sea Ice Denier. Why are you a denier that Anatractica has been
gaining ice?…
Have you read Hansen, et. al 1981 yet? No. Why not?….
BECAUSE YOU ARE A LAZY RACIST BEETCH of a DEMOKKKrat
Anyway, it looks like CO2 pulled us out of an ice age… We should be thankful.
If all we were achieving was to maintain a Holocene climate (the kind of climate that supported all of modern human civilisation) then that indeed would be a good thing. As you can see though, we’re already rocketing past the highest temperatures of the last 120,000 years, and heading for climate much hotter than civilisation has ever had to cope with before. That is a huge risk. We will of course adapt to some extent, but overall the damage is predicted to be much greater than the benefits.
Not even close to the hottest temperatures.
You’re clearly wrong, as shown above.
I can create my own graph to. You want to see it?
Monckton can too. 🙂
Your article is Horse sheet. Satellites say it hasn’t warmed in
almost 20 years. Why are you a satellite data denier. Why are you an
Arctic Sea Ice Denier. Why are you a denier that Anatractica has been
gaining ice?…
Have you read Hansen, et. al 1981 yet? No. Why not?
BECAUSE YOU ARE A LAZY RACIST BEETCH of a DEMOKKKrat….
Dumb and dumber. https://www.youtube.com/watch?v=fbW-aHvjOgM&list=PL82yk73N8eoX-Xobr_TfHsWPfAIyI7VAP&index=17
Your article is Horse sheet. Satellites say it hasn’t warmed in
almost 20 years. Why are you a satellite data denier. Why are you an
Arctic Sea Ice Denier. Why are you a denier that Anatractica has been
gaining ice?…
Have you read Hansen, et. al 1981 yet? No. Why not?
BECAUSE YOU ARE A LAZY RACIST BEETCH of a DEMOKKKrat…..
https://disqus.com/home/discussion/climatedepot/no_global_warming_at_all_for_18_years_9_months_a_new_record_8211_the_pause_lengthens_again_just_in_t/#comment-2351081300
“monckton Robert
5 minutes ago
No. I’m paid $2,155,000 a year, plus expenses, by a group of governments tired of the hard-Left propaganda of the climate Communists. I’m worth much more, of course, but one must do one’s duty to the truth, however little one is paid.”
monckton: “…linking to external climate-Communist websites one of which is run by a crook and the other by a lunatic. ”
https://disqus.com/home/discussion/climatedepot/no_global_warming_at_all_for_18_years_9_months_a_new_record_8211_the_pause_lengthens_again_just_in_t/#comment-2351077265
monckton :”I was too generous. Make that “paid climate-Communist lackwit”. ”
https://disqus.com/home/discussion/climatedepot/no_global_warming_at_all_for_18_years_9_months_a_new_record_8211_the_pause_lengthens_again_just_in_t/#comment-2351091061
monckton, “…Holy Books of IPeCaC ..”http://testclimate.wpengine.com/2015/11/04/no-global-warming-at-all-for-18-years-9-months-a-new-record-the-pause-lengthens-again-just-in-time-for-un-summit-in-paris/
Doesn’t it seem just a bit off that the only places one can read about this is here, and the reposting at wuwt,?
Actual science sites? No
Reputable magazines? No
Reputable newspapers? No
Not really. The media is corrupt. The universities are nothing but cesspools. The satellite data is what the satellite data is… Are you a satellite data denier?
Do you deny how much the surface temperature record has been and continually is manipulated?
Do you think the satellite data might have been manipulated in the same way as the surface data?
Nope… They’ve been manipulating the surface temperature record longer than the satellite data has been around. And it’s always manipulated in the same direction. In fact, it’s an awesome indication of confirmation bias when the manipulations correspond with CO2 concentration (and time). There is zero reason that should be the case.
Here’s what that hero of the deniers, Judith Curry, has to say about adjustments…….
“Berkeley Earth: raw versus adjusted temperature data
by Robert Rohde, Zeke Hausfather, Steve Mosher
Christopher Booker’s recent piece along with a few others have once again raised the issue of adjustments to various temperature series, including those made by Berkeley Earth. And now Booker has double-downed accusing people of fraud and Anthony Watts previously insinuated that adjustments are somehow criminal .
Berkeley Earth developed a methodology for automating the adjustment process in part to answer the suspicions people had about the fairness of human aided adjustments. The particulars of the process will be covered in a separate post. For now we want to understand the magnitude of these adjustments and what they do to the relevant climate metric: the global time series. As we will see the “biggest fraud” of all time and this “criminal action” amounts to nothing.”
http://judithcurry.com/2015/02/09/berkeley-earth-raw-versus-adjusted-temperature-data/
Automating the adjustments doesn’t make them anymore accurate or fairer.
In fact, it’s kind of stupid.
WOW.
With geniuses like you around why do we bother having all those scientists, researchers and experts around?
When is your paper showing how dumb they all are going to be published?
I am a scientist. MORON. I’m an engineer. We apply science. We see how it’s applied.
lol
https://www.youtube.com/watch?v=C3giRaGNTMA&list=PL82yk73N8eoX-Xobr_TfHsWPfAIyI7VAP&index=20
Your article is Horse sheet. Satellites say it hasn’t warmed in
almost 20 years. Why are you a satellite data denier. Why are you an
Arctic Sea Ice Denier. Why are you a denier that Anatractica has been
gaining ice?…
Have you read Hansen, et. al 1981 yet? No. Why not?
BECAUSE YOU ARE A LAZY RACIST BEETCH of a DEMOKKKrat……
Quite obviously you aren’t.
Oh, this boy ^^ sounds just like monckton. https://www.youtube.com/watch?v=C3giRaGNTMA&list=PL82yk73N8eoX-Xobr_TfHsWPfAIyI7VAP&index=20
Your article is Horse sheet. Satellites say it hasn’t warmed in
almost 20 years. Why are you a satellite data denier. Why are you an
Arctic Sea Ice Denier. Why are you a denier that Anatractica has been
gaining ice?…
Have you read Hansen, et. al 1981 yet? No. Why not?
BECAUSE YOU ARE A LAZY RACIST BEETCH of a DEMOKKKrat…….
The table below summarizes the adjustments that have been applied to the UAH TLT dataset.[7] [8] The ‘trend correction’ refers to the change in global mean decadal temperature trend in degrees celsius/decade as a result of the correction.UAH versionMain adjustmentTrend correctionYearASimple bias correction1992BLinear diurnal drift correction-0.031994CRemoval of residual
annual cycle related to
hot target variation0.031997DOrbital decay0.101998DRemoval of dependence
of time variations of
hot target temperature-0.0719985.0Non-linear diurnal correction0.00820035.1Tightened criteria for data acceptance-0.00420045.2Correction of diurnal drift adjustment0.03520055.3Annual cycle correction020095.4New annual cycle02010
What? Do you have a link so it’s readable?
Do you have the same information for the surface record?
NO WHAT?
Whoops – formatting error.
See the original here…
https://en.wikipedia.org/wiki/UAH_satellite_temperature_dataset#Corrections_made
“The UAH TLT dataset was a source of controversy in the 1990s as, at that time, it showed little increase in global mean temperature, at odds with surface measurements. Since then a number of errors in the way the atmospheric temperatures were derived from the raw radiance data have been discovered and corrections made by Christy et al. at UAH.
The largest of these errors was demonstrated in a 1998 paper by Frank Wentz and Matthias Schabel of RSS. In that paper they showed that the data needed to be corrected for orbital decay of the MSU satellites. As the satellites’ orbits gradually decayed towards the earth the area from which they received radiances was reduced, introducing a false cooling trend.”
I already knew this. What is your point?
Satellite records are adjusted for exactly the same reasons as instruments – to make the results more scientifically robust not less.
To claim that one set is adjusted “right” and one “wrong” is either plain stupidity or a cynical attempt to mislead and misrepresent the facts in order to support your predetermined point of view.
Do you know how much they have been adjusted? Do you know the size of the adjustments? Do you know?
That mockton is a flim-flam man. https://www.youtube.com/watch?v=C3giRaGNTMA&list=PL82yk73N8eoX-Xobr_TfHsWPfAIyI7VAP&index=20
Your article is Horse sheet. Satellites say it hasn’t warmed in
almost 20 years. Why are you a satellite data denier. Why are you an
Arctic Sea Ice Denier. Why are you a denier that Anatractica has been
gaining ice?…
Have you read Hansen, et. al 1981 yet? No. Why not?
BECAUSE YOU ARE A LAZY RACIST BEETCH of a DEMOKKKrat……
Also, the satellite data guy (Dr. Mears) professes to be a warmist.
Ahhh, conspiracy….. and anti-intellectualism….
“…universities are nothing but cesspools.”
Even Google says you are just a bunch of liars, hurting our children and our grandchildren and making the world a much worse place.
Google’s chairman, Eric Schmidt…
“The facts of climate change are not in question anymore. Everyone understands climate change is occurring, and the people who oppose it are really hurting our children and our grandchildren and making the world a much worse place. And so we should not be aligned with such people — they’re just, they’re just literally lying.”
http://www.theguardian.com/environment/2014/sep/23/google-to-cut-ties-with-rightwing-lobby-group-over-climate-change-lies
“Even Google”, as though they are neutral and fair arbiters of truth. They are left wing.
Consider what the Limbaugh/Morano conspiracy crowd is saying about climate: not only that the world’s scientists and scientific institutions are systematically wrong, but that they are purposefully perpetrating a deception. Virtually all the world’s governments, scientific academies, and media are either in on it or duped by it. The only ones who have pierced the veil and seen the truth are American far right wing conservatives, the ones who found death panels in the healthcare bill.
One could make a long list….”American far right wing conservatives, the ones who….”
http://ocean.dmi.dk/arctic/plots/icecover/icecover_current.png
Arctic ice skyrocketing above 2005 extent levels….
Here comes the next ice age…. it’s going to be a long winter.
http://arctic.atmos.uiuc.edu/cryosphere/IMAGES/seaice.recent.arctic.png
Look at all that disappearing sea ice…
http://ocean.dmi.dk/arctic/meant80n.uk.php
Apparently a lot of that ice formed with temps above normal…
And now it’s getting cold again.
Even Exxon knows your BS is BS!
Even Exxon knew about man made Climate Change decades ago, then just like big tobacco did, in order to prolong their profits started spending money to finance the blogs, opinion pieces, political campaigns, and think tanks to promote anti-science and cause doubt in folks minds and delay action.
http://insideclimatenews.org/content/Exxon-The-Road-Not-Taken
This short entertaining video clearly shows that Monckton and his cronies are some of the most despicable people on the planet. They have no values, are most likely sociopaths with no regard to the lives of others. Nothing motivates them other than greed.
https://www.youtube.com/watch?v=fbW-aHvjOgM&index=17&list=PL82yk73N8eoX-Xobr_TfHsWPfAIyI7VAP
Interesting factoid:
Go to https://disqus.com/by/monckton/ for the list of small monckton’s postings; do a ‘find in page’ search.
Count the times “paid”, “communist”,”childish”, “climate-Communist”, “trolls”, “climate Communists”, “Trotskyist totalitarian troll”, “Holy Books of IPeCaC ”
Compare that sort of language with what the people who are in discusion with monckton are saying.
Also, compare what and how often monckton links to resources to those respondents.
He sounds some like Michelle Bachman and/or Sarah Palin. The far right wing teanuts love that sort of thing.
Those right wing values voters sure are messed up. Apparently far right wingers and their think tanks like the Heartland Institute think it is ok for a company or anyone to knowingly sell a product that they know can do harm (even cause death) to you and your friends. And use profits made from said product, to sponsor disinformation about the peer reviewed science warnings about the dangers of the product. They call that capitalism, especially when they get to have society pay for the damage done. The deniers are just immoral people with no values, that are willing do people harm, even let them die, as long as there is profit to be made. These people are the most vile among us, with no motivation other than greed and profit. And the right wing value voters are some messed up people.
Very well said,
This is well worth repeating:”They call that capitalism, especially when they get to have society pay for the damage done. “
No, that’s socialism with trillions in debts and unfunded liabilities that get to leave the future generations to pay for decades of deficit spending.
Another statement made by Chris Mc: “”Even Google”, as though they are neutral and fair arbiters of truth. They are left wing.” https://disqus.com/home/discussion/climatedepot/no_global_warming_at_all_for_18_years_9_months_a_new_record_8211_the_pause_lengthens_again_just_in_t/#comment-2369567444
So, conspiracy theory, and unfounded, unsupported claims. Thank you for showing us how empty the denial is position is.
Calling Heartland a “think tank” is an insult to real scientific research institutions. Heartland is a public relations and lobbying firm. It hires lawyers and “marketing creatives,” not scientists.
lol, my bad, and I agree with you. That is what it calls itself. It’s mission statement says, “Give us your tobacco companies, your fossil fuel companies, your drug companies, etc…, we will make sure no regulations are passed to ensure the well being of the public so that you may continue to rape and pillage the consumers. “
Unfortunately, not a parody…..
“Also, the IPCC created a False Low Pre-industrial CO2 in the Atmosphere.”
https://disqus.com/home/discussion/thedailycaller/princeton_students_demand_erasure_of_woodrow_wilson_the_daily_caller_16/#comment-2369226274
“To date, no convincing evidence for AGW (anthropogenic global warming) has been discovered. And recent global climate behavior is not consistent with AGW model predictions.” ~ Richard Courtney, a UN IPCC expert reviewer.” ( unsourced)
https://disqus.com/home/discussion/thedailycaller/princeton_students_demand_erasure_of_woodrow_wilson_the_daily_caller_16/#comment-2370556918
“IPCC reports of ocean “acidification” is based on a short trend that was modeled …”
https://disqus.com/home/discussion/thedailycaller/princeton_students_demand_erasure_of_woodrow_wilson_the_daily_caller_16/#comment-2369267864
monckton, “No. I’m paid $2,155,000 a year, plus expenses, by a group of governments tired of the hard-Left propaganda of the climate Communists. I’m worth much more, of course, but one must do one’s duty to the truth, however little one is paid.”
https://disqus.com/home/discussion/climatedepot/no_global_warming_at_all_for_18_years_9_months_a_new_record_8211_the_pause_lengthens_again_just_in_t/#comment-2351081300
monckton, “You take money from a climate-Communist advocacy group to disrupt these threads with your hate-speech. You were paid $122,000 last year alone to do this. ”
https://disqus.com/home/discussion/climatedepot/no_global_warming_at_all_for_18_years_9_months_a_new_record_8211_the_pause_lengthens_again_just_in_t/#comment-2349919377
“Environmentalist Socialism killed 50 million with the hideously msiconceived ban on DDT”
https://disqus.com/home/discussion/climatedepot/no_global_warming_at_all_for_18_years_9_months_a_new_record_8211_the_pause_lengthens_again_just_in_t/#comment-2351630909
“You are paid $155,000 a year, plus expenses.” “Holy Books of IPeCaC ”
https://disqus.com/home/discussion/climatedepot/no_global_warming_at_all_for_18_years_9_months_a_new_record_8211_the_pause_lengthens_again_just_in_t/#comment-2351100136
“Yes, yes, we know your climate-Communist paymasters have asked you to babble ignorantly about Exxon Mobil, but that case is going to be deeply damaging to the hard Left, for Exxon will simply reverse its present knock-kneed chief executive’s kowtowing to the Party Line and come out fighting, on the climate science, and on whether it is “certain”.”
https://disqus.com/home/discussion/climatedepot/no_global_warming_at_all_for_18_years_9_months_a_new_record_8211_the_pause_lengthens_again_just_in_t/#comment-2351842325
Further down the threaad Monckton accuses me of being a climate fascist.
LOL
He worked for Thatcher but I’m the fascist.
Hahaha!
Heh, accusing Thatcher of being a fascist…rich. That gives a great indicator of where you sit on the spectrum.
Satellite data denier.
How many have died of malaria in Africa…
Thanks for reposting all those brilliant quote… He always makes more sense than you.
Funny how now that denialist has become a working term ( https://eos.org/opinions/climate-closure ) for the anything but my tailpipe sycophants, they try using it where it doesn’t fit.
“Satellite data denier. “
Even Exxon knows planet’s BS is BS. Even Exxon knows that planet denies
the large ocean warming taking place and tries to BS his way into fixating on one small part of the climate system, the lower troposphere, which is subject to significant natural variation.
Even Exxon calls BS on planet and knows that the oceans are where most of the trapped heat goes.
monckton, “Only 0.5 degrees’ global warming is expected by 2100, using mainstream considerations. That’s not a cause worth any climate-Communist money. So they must have other, ulterior motives. And so – if your claim that are not paid is any less mendacious than anything else you claim – must you.”
https://disqus.com/home/discussion/climatedepot/no_global_warming_at_all_for_18_years_9_months_a_new_record_8211_the_pause_lengthens_again_just_in_t/#comment-2350818365
He sounds pretty smart you sound like Climate Communist troll who can’t post any facts and denies satellite data.
Taught well at daddy’s knee
“Climate Communist troll “
Right wing authoritarianism
Right wing authoritarianism represents the extent to which individuasl feel that authorities should be followed. Specifically, right wing authoritarianism comprises three key related attitudes: Individuals submit to authorities, they endorse aggression towards anyone who violates regulations, and they follow the established traditions of society (e.g., Altemeyer, 1998). These three attitudes are called authoritarian submission, authoritarian aggression, and conventionalism respectively. These attitudes represent key determinants of prejudice (Altemeyer, 1998). http://www.psych-it.com.au/Psychlopedia/article.asp?id=388
With less than 1k of comments that are hosted on another site, …
“your stupidity is making lots of money for Marc Morano: the comment-count has just crossed one of the advertising trigger-points for thousands of dollars in extra revenue. ”
https://disqus.com/home/discussion/climatedepot/no_global_warming_at_all_for_18_years_9_months_a_new_record_8211_the_pause_lengthens_again_just_in_t/#comment-2351057440
Another site that oft crows about hits: wuwt.
From the IPCC 5th Assessment Report, Summary For Policy Makers:
“The globally averaged combined land and ocean surface temperature data as calculated by a linear trend show a warming of 0.85 [0.65 to 1.06] °C over the period 1880 to 2012, when multiple independently produced datasets exist”
Let us do the math. 1880-2012 = 132 years. Divide 0.85C by 132 years. 0.006C/year. 0.64C per 100 years…..since the end of the Little Ice Age.
“The increase of global mean surface temperature by the end of the 21st century (2081–2100) relative to 1986–2005 is likely to be 0.3°C to 1.7°C under RCP2.6, 1.1°C to 2.6°C under RCP4.5, 1.4°C to 3.1°C under RCP6.0 and 2.6°C to 4.8°C under RCP8.5″….yet the actual recorded warming trend, by the IPCC’s own admission, is only 0.64C per century.
So why are they selling ever more progressively warmer scenarios in their models when the actual data they are citing disproves them?
“Due to this natural variability, trends based on short records are very sensitive to the beginning and end dates and do not in general reflect long-term climate trends.”
Yet all their models are based on a long-term projected change from the period 1986-2005. 20 years of short records.
https://www.ipcc.ch/pdf/assessment-report/ar5/syr/AR5_SYR_FINAL_SPM.pdf
So if the target of the Paris 2015 talks is to keep global warming to only 2C by 2100…..and it will only warm 0.64C by then based on the real world data…….
Does anyone get the feeling that somone is LYING to them?
Nobody is lying (except the deniers), Warming is not linear.
So the IPCC predictions are not matching the studies they themselves cite yet they continue to sell ever-worse predictions….and that’s not lying?
Here is a graphic showing the accuracy of climate models.
They are almost without exception within the bounds of the tolerances stated at the time of release.
http://www.climate-lab-book.ac.uk/wp-content/uploads/fig-nearterm_all_UPDATE_2015b.png
Didn’t the IPCC itself say something about not being able to predict long term trends using short term records? Look where they start that graph. Considering the amount of previous historical data available, why start in 1986? To hide the recorded cooling during the 1940s-1970s that had scientists warning of a coming ice age, perhaps?
Let’s look at the real long term record, shall we?
https://uploads.disquscdn.com/images/87eccb55d469396662c5952fef9c2451f1adab0c4ed4ad1443c4653adad3db9d.jpg
Newsflash.
Greenland isn’t global.
“Over the past couple of years perusing the internet on climate issues I have repeatedly come upon various misrepresentations of the GISP2 ice core record here and here and here and here and here and here and here and here and here. (I could literally list at least a 100 more locations where I find this exact same argument on the internet. You can google: “hockey stick gisp2″ and see.) Each misrepresentation misses the very basic point that an ice core – any ice core or any other proxy – is a local record of temperature. Using a single ice core record as a proxy for global temperature is a little like reading the thermometer on your back porch and claiming you know the global average temperature.”
http://www.skepticalscience.com/crux-of-a-core1.html
Apart from that I wonder about the accuracy of your graph. Where did it come from?
What has happened to temperatures in Greenland over the 65 years since 1950 (the project’s last sample year) or since 1993 when the project shut down?
ALL proxies for temperature are local.
There are two things that proxies for temperature, contain. Obviously, some parameter for temperature, and … some means of extracting the date of the record of temperature.
That is where the deceit comes into play…
“Scientists” employ seemingly valid techniques to manipulate the data. This involved a deliberate choice – premeditated, discussed, and chosen for the desired effects: The multi-proxy averaging paleotemperature time-series chart, specifically chosen because it ”agrees well … with temperatures obtained with a general circulation model.” (1) This is the cart, leading the horse; a computer model’s output is reinforced by choosing the data to support it.
A proxy for temperature is some natural, physical attribute, like the ratio of species of diatoms, or pollen grains, isolated from layers of mud at the bottom of a lake, via a core sample. While the makeup of those items that determine the temperature might be without question (and beyond my point, here) – the imprecise dating of the sample, introduces a skew of the (time, temperature) data point. Subsequent averaging of (time, temperature) data points (with dating errors) causes the obliteration of short-term temperature excursions, even though the peaks of the excursions might have been accurately recorded with individual proxies. This causes a low-frequency-pass (high-frequency-attenuation) “smearing” of the temperature reconstruction. This outcome was desired, and discussed, as shown by the “climate gate” emails (2). This is done, and is presented to the public as “science” – when it is deliberately chosen to mislead, in fact, lie, (3) about natural temperature variations, seen in the recent (Holocene) past, that were more extreme than now, and certainly not caused by fossil fuel emissions.
They know what they are doing… [as stated -in writing- in Jan 2005] Jonathan Overpeck’s exact words are: (http://di2.nu/foia/1105670738.txt)
“I get the sense that I’m not the only one who would like to deal a mortal blow to the misuse of supposed warm period terms and myths in the literature.”
Loehle 2000: ”… the existence of dating error in the series means that peaks and troughs are damped compared to annual data and are likely even damped compared to the true history…” (4)
Ljungqvist 2010: “The dating uncertainty of proxy records very likely results in “flattining out” [of] the values from the same climate event, over several hundred years, and thus, in fact, acts as a low-pass filter that makes us unable to capture the true magnitude of the cold and warm periods in the reconstruction (Loehle 2004). What we then actually get is an average of the temperature over one or two centuries.” (5)
Mangini, Jul 2005: “As expected, the multi-proxy stack has smaller amplitude, of about 0.9 °C, than our curve from [Spannagel Cave in the Alps], between the minimum in the LIA, and the MWP events. The smaller amplitude is obvious, since Moberg’s reconstruction, resulting from a stack of several different archives, with independent age control, looses amplitude as a consequence of the uncertainty in the ages of the single curves. (6)
▇▇▇▇▇ References ▇▇▇▇▇▇
(1) ”agrees well with temperatures reconstructed from borehole measurements (12) and with temperatures obtained with a general circulation model”
Moberg, Anders, et al. 2005 “Highly variable Northern Hemisphere temperatures reconstructed from low-and high-resolution proxy data.” Nature
http://www.researchgate.net/profile/Stein_Lauritzen/publication/8028681_Highly_variable_Northern_Hemisphere_temperatures_reconstructed_from_low-_and_high-resolution_proxy_data/links/09e415100fff22df8a000000.pdf
(2)
”From: Phil Jones
To: “Michael E. Mann”
Subject: Re: For your eyes only
Date: Thu Feb 3 13:11:46 2005
Mike,
“It would be good to produce future series with and without the long instrumental series and maybe the documentary ones as well. The long measurements can then be used to validate the low-freq aspects at least back to 1750, maybe earlier with the documentary. There are some key warm decades (1730s, some in the 16th century) which the Moberg reconstruction completely misses and gives the impression that all years are cold between 1500 and 1750.” …
Cheers
Phil
http://www.assassinationscience.com/climategate/1/FOIA/mail/1107454306.txt
(3) Phil Jones said, “They have no idea what multiproxy averaging does” 2003
http://www.assassinationscience.com/climategate/1/FOIA/mail/1047474776.txt
(4) Loehle, Craig. “A 2000-year global temperature reconstruction based on non-treering proxies.” Energy & Environment 18.7 (2007): 1049-1058.
http://multi-science.metapress.com/content/dxk28g4662481342/
(5) Ljungqvist, Fredrik Charpentier 2010 “A new reconstruction of temperature variability in the extra‐tropical Northern Hemisphere during the last two millennia.” Geografiska Annaler: Series A, Physical Geography
http://climates.com/cc/ljungquist-temp-reconstruction-2000-years.pdf
(6) Mangini, Jul 2005: “As expected, the multi-proxy stack has smaller amplitude, of about 0.9 °C, than our curve from [Spannagel Cave in the Alps], between the minimum in the LIA, and the MWP events. The smaller amplitude is obvious, since Moberg’s reconstruction, resulting from a stack of several different archives, with independent age control, looses amplitude as a consequence of the uncertainty in the ages of the single curves. In contrast, the temperature record from SPA 12, with an extremely good age control, and with a better than decadal resolution of 18O, gives insight into temperature variations that were not recorded in other archives.”
… “This difference is in good agreement with those derived from sediment cores from the Bermuda Rise but is larger than the reconstruction of temperature for the Northern Hemisphere from low frequency stacks and significantly larger than that in the IPCC report.”
“Together, these non-faunal archives indicate that the MWP was a climatically distinct period in the Northern Hemisphere. This conclusion is in strong contradiction to the temperature reconstruction by the IPCC, which only sees the last 100 yr as a period of increased temperature during the last 2000 yr.”
“During the MWP we observe periods lasting between 20–50 yr with temperatures higher than the average over the last 2000 yr.”
“Fig. 3. Comparison of the temperature derived from SPA 12 (black curve) with the average stack for the N.H. by Moberg et al. (red curve). As expected SPA 12 shows a larger amplitude (about 2.7 °C) than the stack for the N.H (0.9 °C).”
Mangini, A., C. Spötlb, and P. Verdes. “Reconstruction of temperature in the Central Alps during the past 2000 yr from a δ18O stalagmite record.” Earth and Planetary Science Letters 235 (2005): 741-751.
http://epsc.wustl.edu/courses/epsc484/mangini05.pdf (full PDF)
**************************
Use of the Moberg reconstruction by Mann was deliberate; errors in temporal resolution (time differences between multiple proxies for temperature) smeared out short-term temperature peaks. Climategate emails reveal the discussion. It was a premeditated decision to “low-pass” smooth out warm periods in temperature records, because the CO2 theory couldn’t explain them.
”From: Phil Jones
To: “Michael E. Mann”
Subject: Re: For your eyes only
Date: Thu Feb 3 13:11:46 2005
Mike,
“It would be good to produce future series with and without the long instrumental series and maybe the documentary ones as well. The long measurements can then be used to validate the low-freq aspects at least back to 1750, maybe earlier with the documentary. There are some key warm decades (1730s, some in the 16th century) which the Moberg reconstruction completely misses and gives the impression that all years are cold between 1500 and 1750.” …
Cheers
Phil
http://www.assassinationscience.com/climategate/1/FOIA/mail/1107454306.txt
Phil Jones said, “They have no idea what multiproxy averaging does”
http://www.assassinationscience.com/climategate/1/FOIA/mail/1047474776.txt
Multi-proxy averaging smears peaks in temperature, because of poor control over the age of the proxy. Thus, you get the lower temperature you’re after.
They know what they are doing… [as stated -in writing-] Jonathan Overpeck’s exact words are: (http://di2.nu/foia/1105670738.txt)
“I get the sense that I’m not the only one who would like to deal a mortal blow to the misuse of supposed warm period terms and myths in the literature.”
David Demming’s statement to the senate: http://www.epw.senate.gov/hearing_statements.cfm?id=266543
Mangini, Jul 2005: “As expected, the multi-proxy stack has smaller amplitude, of about 0.9 °C, than our curve from [Spannagel Cave in the Alps], between the minimum in the LIA, and the MWP events. The smaller amplitude is obvious, since Moberg’s reconstruction, resulting from a stack of several different archives, with independent age control, looses amplitude as a consequence of the uncertainty in the ages of the single curves. In contrast, the temperature record from SPA 12, with an extremely good age control, and with a better than decadal resolution of 18O, gives insight into temperature variations that were not recorded in other archives.”
… “This difference is in good agreement with those derived from sediment cores from the Bermuda Rise but is larger than the reconstruction of temperature for the Northern Hemisphere from low frequency stacks and significantly larger than that in the IPCC report.”
“Together, these non-faunal archives indicate that the MWP was a climatically distinct period in the Northern Hemisphere. This conclusion is in strong contradiction to the temperature reconstruction by the IPCC, which only sees the last 100 yr as a period of increased temperature during the last 2000 yr.”
“During the MWP we observe periods lasting between 20–50 yr with temperatures higher than the average over the last 2000 yr.”
“Fig. 3. Comparison of the temperature derived from SPA 12 (black curve) with the average stack for the N.H. by Moberg et al. (red curve). As expected SPA 12 shows a larger amplitude (about 2.7 °C) than the stack for the N.H (0.9 °C).”
Mangini, A., C. Spötlb, and P. Verdes. “Reconstruction of temperature in the Central Alps during the past 2000 yr from a δ18O stalagmite record.” Earth and Planetary Science Letters 235 (2005): 741-751.
http://epsc.wustl.edu/courses/epsc484/mangini05.pdf (full PDF)
Loehle 2000: ”… the existence of dating error in the series means that peaks and troughs are damped compared to annual data and are likely even damped compared to the true history…”
Loehle, Craig. “A 2000-year global temperature reconstruction based on non-treering proxies.” Energy & Environment 18.7 (2007): 1049-1058.
http://multi-science.metapress.com/content/dxk28g4662481342/
Ljungqvist 2010: “The dating uncertainty of proxy records very likely results in “flattining out” [of] the values from the same climate event, over several hundred years, and thus, in fact, acts as a low-pass filter that makes us unable to capture the true magnitude of the cold and warm periods in the reconstruction (Loehle 2004). What we then actually get is an average of the temperature over one or two centuries.”
Ljungqvist, Fredrik Charpentier 2010 “A new reconstruction of temperature variability in the extra‐tropical Northern Hemisphere during the last two millennia.” Geografiska Annaler: Series A, Physical Geography
http://climates.com/cc/ljungquist-temp-reconstruction-2000-years.pdf
*********** The scene of the crime: Moberg
”agrees well with temperatures reconstructed from borehole measurements (12) and with temperatures obtained with a general circulation model”
Moberg, Anders, et al. 2005 “Highly variable Northern Hemisphere temperatures reconstructed from low-and high-resolution proxy data.” Nature
http://www.researchgate.net/profile/Stein_Lauritzen/publication/8028681_Highly_variable_Northern_Hemisphere_temperatures_reconstructed_from_low-_and_high-resolution_proxy_data/links/09e415100fff22df8a000000.pdf
At 06:25 28/09/2009, Tom Wigley wrote:
Phil,
Here are some speculations on correcting SSTs to partly
explain the 1940s warming blip.
If you look at the attached plot you will see that the
land also shows the 1940s blip (as I’m sure you know).
So, if we could reduce the ocean blip by, say, 0.15 degC,
then this would be significant for the global mean — but
we’d still have to explain the land blip.
I’ve chosen 0.15 here deliberately. This still leaves an
ocean blip, and i think one needs to have some form of
ocean blip to explain the land blip (via either some common
forcing, or ocean forcing land, or vice versa, or all of
these). When you look at other blips, the land blips are
1.5 to 2 times (roughly) the ocean blips — higher sensitivity
plus thermal inertia effects. My 0.15 adjustment leaves things
consistent with this, so you can see where I am coming from.
Removing ENSO does not affect this.
It would be good to remove at least part of the 1940s blip,
but we are still left with “why the blip”.
Let me go further. If you look at NH vs SH and the aerosol
effect (qualitatively or with MAGICC) then with a reduced
ocean blip we get continuous warming in the SH, and a cooling
in the NH — just as one would expect with mainly NH aerosols.
The other interesting thing is (as Foukal et al. note — from
MAGICC) that the 1910-40 warming cannot be solar. The Sun can
get at most 10% of this with Wang et al solar, less with Foukal
solar. So this may well be NADW, as Sarah and I noted in 1987
(and also Schlesinger later). A reduced SST blip in the 1940s
makes the 1910-40 warming larger than the SH (which it
currently is not) — but not really enough.
So … why was the SH so cold around 1910? Another SST problem?
(SH/NH data also attached.)
This stuff is in a report I am writing for EPRI, so I’d
appreciate any comments you (and Ben) might have.
Tom.
http://www.assassinationscience.com/climategate/1/FOIA/mail/1254147614.txt
Exactly…
TL:DR
Sorry, I wasn’t prepared for your short attention span.
ALL proxies for temperature are local. The problem with proxies is the inaccuracy of the date of the record of temperature. That is where the deceit comes into play…
“Scientists” employ seemingly valid techniques to manipulate the data. … the imprecise dating of the sample, introduces a skew of the (time, temperature) data point. Subsequent averaging of (time, temperature) data points (with dating errors) causes the obliteration of short-term temperature excursions, even though the peaks of the excursions might have been accurately recorded with individual proxies. This causes a low-frequency-pass (high-frequency-attenuation) “smearing” of the temperature reconstruction.
Quite right.
All proxies are local.
That is what makes AndyJ’s post irrelevant.
Thank you for agreeing with me.
All the “evidence” … that the temperature record shown in AndyJ’s post is invalid, globally, are smearing, multi-proxy averages, i.e. obfuscations of the truth.
Hold on a second.
Are you actually trying to argue that GISP2 is a local temperature proxy that can be extrapolated to the entire planet and that combining the data with any other local proxy from other locations is degrading it?
Really?
https://disqus.com/home/discussion/climatedepot/no_global_warming_at_all_for_18_years_9_months_a_new_record_8211_the_pause_lengthens_again_just_in_t/#comment-2353358646
LOL.
You are.
Hahahahaha!
ALL thermometric temperatures are local.
Thermometers, RTDs, all measure local temperature, to a finer position than most proxies. Most, used in “climate” studies, are referenced to AIR temperature at 2m height. No different than measurement by some proxy, except that the time period is – sometimes -orders of magnitude more precise, and the temperature is usually referenced to some calibration standard.
A Coral sample, or a individual tree, or a stalagmite, can be used as a proxy for temperature. The physical size of a tree, or a coral, or a stalagmite, is much larger than a thermometer or an RTD. Thus, thermometric temperatures are even more local than proxies.
So these predication were made in 2006… 9 years into it you’re already failing. Well withing the bounds…. Well withing the bounds a 1C wide band….
Hilarious you ear… You are at the bottom still just where you have been since 2000
You’re pround of your Climastrologists for 90 percent of them being off and this looks like it’s using the latest adjusted data from Karl that has no scientific validity at all. Hilarious.
Now show the charts with RSS/UAH values. Even your fudged surface data is BARELY within the bounds.
A few inconvienent truths about CO2:
At 150ppm, plant life dies.
Optimum CO2 for plants is 1500ppm.
Humans can safely breathe CO2 levels as high as 5000ppm.
Planet has had CO2 levels ten times higher than today with NO “runaway greenhouse” effect.
In the late past, massive global glaciations have occurred at 1500ppm-2000ppm.
When the Antartic ice cap formed 33 million years ago, planetary CO2 was about 900ppm.
During the Quaternary Ice Age (2.6mya – present) CO2 levels have been at record lows.
Greatest temperature and sea level rise of the Holocene interglacial occurred between 17500 and 11000 years ago, when man was still in the caves and had absolutely no industry.
The past temperature record (not cherrypicked data after the Little Ice Age) shows NO causal effect of CO2 on world temperatures.
“If you would know who controls you see who you may not criticise.”…Tacitus
Good grief… why don’t you just read a textbook instead of spouting misleading garbage? Why do you think the world went from a tropical climate to the depths of an ice age in the last 50 million years? Solar output was gradually increasing (a small warming influence), but atmospheric CO2 was declining (a large cooling influence). It’s trivially obvious that atmospheric CO2 concentration is the main driver of global temperature change, through the modulation of the Earth’s greenhouse effect. This is schoolboy science and you have the entire internet at your disposal – you can read about it on a thousand different websites. How have you managed not to discover this for yourself yet?
Schoolboy science… Historically, CO2 lags temperature changes, it doesn’t drive it.
The only boy here is youl
Good grief. Learn some science! CO2 is responsible for 80% of the Earth’s greenhouse effect – it’s trivially obvious that changing the atmospheric concentration of CO2 changes the magnitude of the greenhouse effect and thus changes global temperature. This is just basic physics, known for 150 years. It can’t not happen, and all the palaeoclimate evidence shows that an increase in atmospheric CO2 causes global warming – always has, always will.
Easier to follow monckton’s lead..
https://disqus.com/home/discussion/climatedepot/no_global_warming_at_all_for_18_years_9_months_a_new_record_8211_the_pause_lengthens_again_just_in_t/#comment-2353482287
Then why does it lag? Even now, one reason all the models are screwed up is because the ocean is absorbing more CO2 than expected.. why? Because it isn’t hot and it can. It is simple chemistry… solubility of CO2 in water.
It doesn’t always lag – take the PETM and today’s AGW as two good examples of CO2 rise preceding temperature rise. Cenozoic cooling is a good example of CO2 decline preceding temperature decline.
Where temperature does rise first, CO2 acts as a feedback. Did you really not know this already? It’s very basic stuff.
LOL! Even the IPCC doesn’t claim CO2 is 80% of the greenhouse effect. You are the one that actually needs to learn the science. Why even NASA states, “Carbon dioxide causes about 20 percent of Earth’s greenhouse effect;
water vapor accounts for about 50 percent; and clouds account for 25
percent. The rest is caused by small particles (aerosols) and minor greenhouse gases like methane.”
It’s a fact that CO2 is responsible for 80% of the forcing which sustains the Earth’s greenhouse effect. The evidence is here:
http://www.sciencemag.org/content/330/6002/356
http://www.sciencemag.org/content/330/6002/356.figures-only
http://www.giss.nasa.gov/research/briefs/lacis_01/fig1.gif
W.Frog’s quoted material comes from Effects of Changing the Carbon Cycle
http://m.earthobservatory.nasa.gov/Features/CarbonCycle/page5.php
And, as normal, is a short bit taken out of context.
That’s right. People often don’t understand that the majority of the present day greenhouse effect is feedback, and that without CO2 it would collapse. Also when you understand that the greenhouse effect is essentially CO2 plus feedbacks, the notion of a low value for climate sensitivity becomes an obvious nonsense.
So, do you think W.Frog (and mmost other denialists) deliberately cherrypick to present their case, or are they being acolytic by repeating the unsupported talking points fed them?
I think it’s a conscious deceit. Global warming deniers know perfectly well that their claims are unscientific and erroneous, so it’s all just posturing.
Makes sense; the consistency of the cherrypicking from reliable sources indicates that they are picked for impact (look,see, nasa said…).
Hmmm, yea, really deceitful. Sure. Sure. And yet there is no empirical evidence supporting the hypothesis. Unless of course you can cite one or more scientific papers that provide empirical evidence that CO2 emissions have been the main cause of global warming.
Thomas R. Karl, Kevin E. Trenberth
http://www.sciencemag.org/content/302/5651/1719.short
And yet this is all based on computer modeling projections. Trenberth’s paper you cited is a viewpoint piece. He uses no empirical evidence.
Show me one or more peer reviewed science papers that empirically shows that that anthropogenic CO2 was the primary cause of the most recent climate warming in the late 20th century.
You’ve possibly seen these:
https://ourchangingclimate.wordpress.com/2014/02/17/is-climate-science-falsifiable
http://variable-variability.blogspot.nl/2014/01/interesting-what-interesting-judith.html
https://ourchangingclimate.wordpress.com/2010/01/06/a-quick-n-dirty-guide-to-falsifying-agw/
V. Venema’s comment early in the thread……
“If someone at an oil company only had the slightest doubt such a challenge might be possible, he had already funded this research. If every visitor to WUWT would pay one cent, they could hire a good scientist. That they rather fund PR firms and write daily erroneous posts shows that even they know the AGW is solid.”
https://ourchangingclimate.wordpress.com/2014/02/17/is-climate-science-falsifiable/#comment-20547
Icarcus has grossly taken it out of context by claiming 80% without using the key word NON-CONDENSING.
But your illiteracy prevents you from understanding that.
Perhaps less personal attacks and more actual quoting of something substantive would support your case.
“Water vapor and clouds are the major contributors to Earth’s greenhouse effect, but a new atmosphere-ocean climate modeling study shows that the planet’s temperature ultimately depends on the atmospheric level of carbon dioxide.
The study, conducted by Andrew Lacis and colleagues at NASA’s Goddard Institute for Space Studies (GISS) in New York, examined the nature of Earth’s greenhouse effect and clarified the role that greenhouse gases and clouds play in absorbing outgoing infrared radiation. Notably, the team identified non-condensing greenhouse gases — such as carbon dioxide, methane, nitrous oxide, ozone, and chlorofluorocarbons — as providing the core support for the terrestrial greenhouse effect.
Without non-condensing greenhouse gases, water vapor and clouds would be unable to provide the feedback mechanisms that amplify the greenhouse effect. The study’s results will be published Friday, Oct. 15 in Science.
A companion study led by GISS co-author Gavin Schmidt that has been accepted for publication in the Journal of Geophysical Research shows that carbon dioxide accounts for about 20 percent of the greenhouse effect, water vapor and clouds together account for 75 percent, and minor gases and aerosols make up the remaining five percent. However, it is the 25 percent non-condensing greenhouse gas component, which includes carbon dioxide, that is the key factor in sustaining Earth’s greenhouse effect. By this accounting, carbon dioxide is responsible for 80 percent of the radiative forcing that sustains the Earth’s greenhouse effect.
The climate forcing experiment described in Science was simple in design and concept — all of the non-condensing greenhouse gases and aerosols were zeroed out, and the global climate model was run forward in time to see what would happen to the greenhouse effect. Without the sustaining support by the non-condensing greenhouse gases, Earth’s greenhouse effect collapsed as water vapor quickly precipitated from the atmosphere, plunging the model Earth into an icebound state — a clear demonstration that water vapor, although contributing 50 percent of the total greenhouse warming, acts as a feedback process, and as such, cannot by itself uphold the Earth’s greenhouse effect.
“Our climate modeling simulation should be viewed as an experiment in atmospheric physics, illustrating a cause and effect problem which allowed us to gain a better understanding of the working mechanics of Earth’s greenhouse effect, and enabled us to demonstrate the direct relationship that exists between rising atmospheric carbon dioxide and rising global temperature,” Lacis said.
The study ties in to the geologic record in which carbon dioxide levels have oscillated between approximately 180 parts per million during ice ages, and about 280 parts per million during warmer interglacial periods. To provide perspective to the nearly 1 C (1.8 F) increase in global temperature over the past century, it is estimated that the global mean temperature difference between the extremes of the ice age and interglacial periods is only about 5 C (9 F).
“When carbon dioxide increases, more water vapor returns to the atmosphere. This is what helped to melt the glaciers that once covered New York City,” said co-author David Rind, of NASA’s Goddard Institute for Space Studies. “Today we are in uncharted territory as carbon dioxide approaches 390 parts per million in what has been referred to as the ‘superinterglacial.'”
“The bottom line is that atmospheric carbon dioxide acts as a thermostat in regulating the temperature of Earth,” Lacis said. “The Intergovernmental Panel on Climate Change has fully documented the fact that industrial activity is responsible for the rapidly increasing levels of atmospheric carbon dioxide and other greenhouse gases. It is not surprising then that global warming can be linked directly to the observed increase in atmospheric carbon dioxide and to human industrial activity in general.”
http://www.nasa.gov/topics/earth/features/co2-temperature.html
And once again Robert is blind to the multiple citations I provided.
Perhaps you can explain your copy and paste to Icarcus, “Gavin Schmidt that has been accepted for publication in the Journal of
Geophysical Research shows that carbon dioxide accounts for about 20
percent of the greenhouse effect” and not 80%. Or are you going to mangle the science too, and eliminate water vapor completely out of the equations as a GHG.
The article walks through your error. If you don’t like their description, let them know about what you perceive as errors.
Btw, your quote selection is exactly what we’ve been pointing out . Thank you for yet another example.
LOL! “The article walks through your error.” No it doesn’t, because I made no error. I cited that article showing how Incarcus misinterpreted it, and erroneously drew the wrong conclusion by eliminating a key word to claim CO2 is 80% of the GH effect. Perhaps if you actually read it, you would see Incarcus error. Not only has Incarcus (and you) grossly misinterpret that one article, you fail to acknowledge further support I cited that claiming CO2 is 80% of the GH effect is ludicrous.
At least Incarcus was smart enough to keep his mouth shut when I showed him his error.
You are grossly misrepresenting what Lacis stated.
“From the foregoing, it is clear that CO2 is the key atmospheric gas that exerts principal control (80% of the non-condensing GHG forcing) over the strength of the terrestrial greenhouse effect.“
Repeat: NON-CONDENSING.
Do you understand what that means? Do you know what non-condensing gases are? Do you know what condemning gases are?
When you add water vapor and clouds back into the equation, Lacis and Schmidt show “Radiative modeling analyses of the terrestrial greenhouse structure described in a parallel study in the Journal of Geophysical Research (Schmidt et al., 2010) found that water vapor accounts for about 50% of the Earth’s greenhouse effect, with clouds contributing 25%, carbon dioxide 20%, and the minor greenhouse gases (GHGs) and aerosols accounting for the remaining 5%,…”
So according to them, and many others, CO2 is 20% of the greenhouse effect.
https://en.wikipedia.org/wiki/Greenhouse_gas
You need to be much more careful what you claim, eliminating the word “Non-Condensing” makes a HUGE difference. I hope you see that.
As your quote says:
“CO2 is the key atmospheric gas that exerts principal control… over the strength of the terrestrial greenhouse effect.”
Without the non-condensing greenhouse gases there would be very little greenhouse effect and the Earth would be frozen. Non-condensing greenhouse gases sustain the greenhouse effect, and the effects of water vapour and clouds are feedbacks. That’s why CO2 is responsible for 80% of the greenhouse effect, with the other non-condensing greenhouse gases comprising the remaining 20%.
Can you mangle it any more?
That’s not what Lacis says. That’s not what Schmidt says. You can’t claim 80% while eliminating the differentiating key word non-condensing. So stop making up your own “science”.
Empirical evidence that CO2 is not the driver of climate.
http://onlinelibrary.wiley.com/doi/10.1002/jgrd.50772/abstract
http://rsmas.miami.edu/personal/bmapes/teaching/MPO663_2011/Mapes_QJRMS_Waterpaper_scaleheights.pdf
http://multi-science.atypon.com/doi/10.1260/0958-305X.25.2.389
Empirical evidence shows that there has been very little, if not flat, positive water vapor feedback.
http://journals.ametsoc.org/doi/abs/10.1175/JCLI-D-11-00003.1
http://www.sciencemag.org/content/327/5970/1219.abstract
http://onlinelibrary.wiley.com/doi/10.1029/2010JD014192/full
NCEP data would imply that long-term water vapor feedback is negative – that it would reduce rather than amplify the response of the climate system to external forcing such as that from increasing atmospheric CO2.
http://link.springer.com/article/10.1007%2Fs00704-009-0117-x
The ‘non-condensing’ part is the whole point – as you pointed out, around 75% of the present day greenhouse effect is feedback, not forcings. The forcings come from the non-condensing greenhouse gases. Two inevitable conclusions arise from these facts:
CO2 is responsible for around 80% of the greenhouse effect;
Feedbacks amplify forcings by around a factor of 4 (minus the negative lapse rate feedback of ~1K which takes it to around a factor of 3).
So the notion of water vapour feedback being negative is patently false, on the evidence that you yourself have provided.
http://www.giss.nasa.gov/research/briefs/lacis_01/fig1.gif
Did you know that on the IR spectrum water vapor overlaps CO2’s main absorption bands?
Did you read any of the citations I gave you? I don’t think you did. Empirical evidence (not projected computer models) show the positive water vapor feedback is not happening.
And yet you still misquote what even the warmest scientist say! You seem to think that just because some scientists label water vapor a feedback since it’s controlled by temperature, doesn’t mean that is has 0% effect on climate. That is exactly what you are stating. You are stating that in order to claim CO2 is 80% of the greenhouse effect, water vapor has 0% effect because you are eliminating it entirely from the equation (and atmosphere). That is not how real-world climate works. NO SCIENTIST claims this!
You need to have one of your CAGW or AGW believers explain your error. You can only claim CO2 is 80% of the GH effect if you distinguish it with the key word “NON-CONDENSING”.
50 million years? This Ice Age only began 2.6 million years ago, right after the North and South American continents joined at the isthmus of Panama. So you’ve obviously not researched the Ice Age history or the continental drift and subsuquent ocean current changes that caused the glaciations of both the Artic and Antartic.
I see exactly where you are coming from. It’s sad, really. But there’s always some wearing the signs.
https://uploads.disquscdn.com/images/d104f4561218b6278ba9cbd7c08533f266b5e79e6529fa9c8f2e7b34f73019dc.png
Nice attempt at evasion, but I’ll ask the question again:
Why do you think the world went from a tropical climate to the depths of an ice age in the last 50 million years? Solar output was gradually increasing (a small warming influence), but atmospheric CO2 was declining (a large cooling influence).
Is the light beginning to dawn yet?
50 million years ago the world was ice-free. It was hot, it rained a lot, CO2 was around 900ppm and the land was dominated by lush jungle.
Then 33 million years ago, the gap between Antartica, Africa, South America, and Australia had widened enough to allow a cold current to pass across all of the Antartic coast line. Subsequently, the Antartic glaciated and sucked half the CO2 into the ice. It was still not an Ice Age. The Antartic Ice continues to slowly increase because the gap between those continents continues to grow and and the part of the Deep Ocean Conveyor that carries warm water back across the Indian Ocean is moving slowly north while the cold current passing to the east stays in the south.
3 million years ago, the Panama Current was closed when North and South America connected and the Artic proceeded to glaciate. 400ky later the Quaternary Ice Age began with the cyclical growth and regression of the Artic Ice Cap over Canada, Greenland and Northern Europe. This is controlled by the salinity levels of the Gulf Stream section of Deep Ocean Conveyor flowing into the ever widening gap of the Greenland Sea between Greenland and Europe and the gradual closing of the less-saline Bering Sea current between Alaska and Siberia.
It has bugger all to do with CO2. It’s all about plate tectonics, global heat distribution through major ocean currents and how continental drift changes those currents.
http://www.whoi.edu/oceanus/feature/how-the-isthmus-of-panama-put-ice-in-the-arctic
But you won’t believe any of this because it’s not Church of Climatology orthodoxy. It’s like explaining the continued worship of the Norse gods to a fundamentalist Christian.
Incorrect, and here’s how we know that it’s incorrect – take particular note of the quantitative details:
“The fact that CO2 is the dominant cause of long-term Cenozoic climate trends is obvious from consideration of Earth’s energy budget. Such large climate changes cannot result from redistribution of energy within the climate system, as might be caused by changes of atmosphere or ocean dynamics. Instead a substantial global climate forcing is required. The climate forcing must be due to a change of energy coming into the planet or changes within the atmosphere or on the surface that alter the planet’s energy budget.
Solar luminosity is increasing on long time scales, as our sun is at an early stage of solar evolution, “burning” hydrogen, forming helium by nuclear fusion, slowly getting brighter. The sun’s brightness increased steadily through the Cenozoic, by about 0.4 percent according to solar physics models (Sackmann et al., 1993). Because Earth absorbs about 240 W/m2 of solar energy, that brightness increase is a forcing of about 1 W/m2. This small linear increase of forcing, by itself, would have caused a modest global warming through the Cenozoic Era.
Continental locations also affect the planet’s energy balance, because ocean and continent albedos differ. However, most continents were near their present latitudes at the beginning of the Cenozoic (Blakey, 2008), so this surface climate forcing did not exceed about 1 W/m2.
In contrast, atmospheric CO2 during the Cenozoic changed from at least 1000 ppm in the early Cenozoic to as small as 170 ppm during recent ice ages. The resulting climate forcing, as can be computed accurately for this CO2 range using formulae in Table 1 of Hansen et al. (2000), exceeds 10 W/m2. It is clear that CO2 was the dominant climate forcing in the Cenozoic.”
Paleoclimate Implications for Human-Made Climate Change
James E. Hansen and Makiko Sato
Woodshole agrees with me.
What is it with you people and CO2? You can’t picture a single geological event occuring without trying to insert CO2 into it. It’s an obsession.
Didn’t you even read the text? I pointed out that you need to look at the numbers. The climate forcing for the decline in atmospheric CO2 over the last 50 million years is an order of magnitude larger than other forcings such as changes in absorbed solar radiation or ocean circulation. It’s just straightforward undeniable physics. Why do you have a problem with the facts?
I told you the facts. The Antartic glaciated because of continental drift and changing sea currents. The Artic glaciated due to continental drift and changing sea currents. The only thing that happened with the CO2 is that a large proportion got trapped in the ice and into the oceans as the glaciations cooled the planet.
Now that CO2 is being released again, thankfully because it was getting too damn low. The poor plants must have been damn near suffocation.
It’s not my fault you can’t think outside the Greenhouse Effect box. The climate doesn’t revolve around CO2.
You’ve been proven wrong. Just accept it. Read Hansen’s paper and educate yourself.
Hansen is a hack. He adds imaginary temperatures in his studies and all his models have been proven wrong.
Comical. Having been shown to be wrong, you resort to falsehoods, and laughable accusations of fraud. It’s the typical response of the anti-science crowd.
I’m totally for science. But my religion isn’t based on hating carbon dixoide. https://uploads.disquscdn.com/images/ad5ac995fb424ed6795eff417398381753949f78c62279757efbe2c7dd1af1f3.jpg
I just gave you the science, and you rejected it. You can clearly see that the climate forcing from CO2 is an order of magnitude larger than other natural influences over the last 50 million years. The science shows that CO2 is the dominant driver of global climate change, yet you reject this fact. It appears that your religion is based on hating carbon dioxide after all. You don’t want to accept the facts about its influence on the climate. Why not?
https://www.youtube.com/watch?v=57W3ZhOAkAE
Evasion noted.
You can’t get any stupider than this. Water vapor is responsible for almost ALL the grenhouse effect.
Icarus62 • 17 hours ago
Good grief. Learn some science! CO2 is responsible for 80% of the Earth’s greenhouse effect – it’s trivially obvious that changing the atmospheric concentration of CO2 changes the magnitude of the greenhouse effect and thus changes global temperature. This is just basic physics, known for 150 years. It can’t not happen, and all the palaeoclimate evidence shows that an increase in atmospheric CO2 causes global warming – always has, always will.
Don’t you mean, water?
All atmospheres are greenhouses. Because, Thermodynamic effects, which interact with and dominate radiation.
” physical nature of the so-called GH effect is a Pressure-induced Thermal Enhancement (PTE), which is independent of the atmospheric chemical composition”
” Learn some science! ”
IPCC climate science is mind control.
Truth is, increased greenhouse effect will Cool, a little.
Icarus even opposes what the IPCC, Gavin Schmidt and others claim, which is CO2 is 20% of the GH effect. He mangles science!
WF, care to review this exchange?
https://disqus.com/home/discussion/thedailycaller/princeton_students_demand_erasure_of_woodrow_wilson_the_daily_caller_16/#comment-2369153322
“The Loire freezes much easier than the Seine, here in Paris suburbs there are little pieces of ice since yesterday but nothing more than two years ago. Last time the Seine froze up completely was in 1956, versus 1997 for the Loire.”
Where is the sustained Parisian warming?
http://www.wolframalpha.com/input/?i=weather+Paris+France+1970+to+2015
A small group of paid climate-Communist trolls well known for their hate speech and disruptive tactics has infested this site, as they infest many others. Their chief technique is to make vile personal attacks on named individuals, though they themselves snivel from behind a coward’s cloak of anonymity.
Their paymasters from extremist advocacy groups have one purpose: to frighten off any who might otherwise question the Party Line. It is by this anti-democratic technique that they suppress almost all dissent and then claim consensus, just as the national-socialist and Communist-socialist thugs before them once did.
zlop, planet8788, VooDude are paid climate-Communist trolls well known for their hate speech and disruptive tactics has infested this site, as they infest many others. Their chief technique is to make vile personal attacks on named individuals, though they themselves snivel from behind a coward’s cloak of anonymity.
Their paymasters from extremist advocacy groups have one purpose: to frighten off any who might otherwise question the Party Line. It is by this anti-democratic technique that they suppress almost all dissent and then claim consensus, just as the national-socialist and Communist-socialist thugs before them once did.
the difference between the anonymous climate-Communist trolls who make personal attacks on named opponents from behind a craven cloak of anonymity and the anonymous commenters zlop, planet8788, VooDude is that the latter do not make personal attacks.
But I am not anonymous. And “climate-Communist trolls” scrapes the bottom of Graham’s hierarchy.
And stop whining.
Your missed using the ‘dont b childish’.. wittism….
Vile personal attacks… like calling you what you are… a satellite data denier…
Also a 1990 IPCC data denier.
Cite any hate speech from me, Jack. DISQUS has records. Comb through them. For the record, I’m not paid. …by anyone.
Read my comment in the context of monckton’s comment above.
BTW – your comments are private and hidden from public view. Why?
Several people began harassing me as I moved from one site to another. You can still dig out any comment or locate where I’ve been, using other search tools. I just don’t make it easy.
Prove it, or retract it, please. I don’t do ‘hate speech’ and never have. (a few barbed insults, maybe)…
Just edit your comment.
So they are saying that if we give them the money, they can change the weather?
https://uploads.disquscdn.com/images/ee8ec6bce91db5c8e7b9df038710275a1aef97c1c5f3af8d36f478be6ada9871.jpg
Yep.
Why is satellite data ignored by the alarmists? Where does the 97% figure (pretty specific) come from? Why does NASA proclaim that the oceans have not warmed? http://science.nasa.gov/science-news/science-at-nasa/2014/06oct_abyss/
Thanks for pointing that out… we will erase that page soon.
This is all so confusing. The satellite data say there has been no warming in over 18 years. Yet, NASA’s analysis says 2014 was the warmest year on record, with global temperatures 0.68C above the long-term average, the long-term global average temperature having been calculated from data collected between 1951 and 1980. NASA’s results mean that 14 of the 15 warmest years on record have occurred since the turn of the century. So, which is it? If the government’s data are wrong, why aren’t scientists stepping up to say so? And if the government is trying to change their data to fit a warming narrative, why are all the heads of countries at the Climate Change Summit buying into the lie? What is the point ultimately? Someone here said the whole climate scare is about socialism and the redistribution of wealth from the rich to the poor, and that is why the UN wants an annual $100 billion climate fund to be established and paid for by the rich countries so that the UN can tell the world how to live. If that were true, how does telling people how to live redistribute the wealth? By forcing people to use green energy, energy will become so expensive that it will hurt the poor. How is that redistributing the wealth to them? I don’t believe in man-made climate change, nor do I disbelieve it. There is too much conflicting information for me to come to any conclusions. None of this makes any sense.
https://uploads.disquscdn.com/images/0cb502bab6cc18b0adf7612d93a9fac53034f35651bb8c9ff4726f1232da526e.jpg https://uploads.disquscdn.com/images/ffda1312d9f7efd7fd933c0da0cef12b5152c123f3296ba46ae29488c909897e.jpg https://uploads.disquscdn.com/images/96ac649ef1f8d3be2e750b492e332e1706caee6bb380dc2affb3784f2abf884a.jpg
https://uploads.disquscdn.com/images/5c79017f2e88c2fdff9286c6c36b9031ddbf2225ca15885df5957756c6c716c8.jpg
Adjustments make records … highly improbable records.
https://uploads.disquscdn.com/images/e18ec56044496e182c1f553b47523c22e5b4d213675b6fdfc057fb1b96e845e7.jpg
So if the data were being altered, what is the point of it all? Why do it? And why aren’t “honest” scientists speaking up about falsified data?
Well, it isn’t ‘falsified’ (by their viewpoint). It is ‘better’ … new and improved (even tamperatures from decades ago are being modified now).
There are several excuses used. As far as I know, all the excuses have been tossed, and, a computer program just “homoginizes” the data.
One excuse, used earlier, was when a station got moved, or got new equipment. https://uploads.disquscdn.com/images/fb835d084189ec0454127db7751b0d52f3e223c7846436953d3ef84c394b144a.jpg
Another was the time of day that the instruments were recorded … trying to standardize the Time of the OBservation (TOB). Like one guy did it in the morning, another in the afternoon, so ‘they’ adjust data of one by … some amount … as if they could really tell what the real temperature was, in the morning, when it was recorded in the afternoon.
Then, there was an excuse for really piss-poor siting. Some thermometers are in a rural site. Some thermometers are mounted just feet away from a roadway or runway … https://uploads.disquscdn.com/images/1f93fc1f0d5d325cd5dd1d9671967472e9e040b3b79c773223c77d2321db8bd2.jpg
Some thermometers are mounted just feet away from a trash incinerator, or the exhaust from an air conditioner
https://uploads.disquscdn.com/images/6b89370a03d98cc1350403725dcdc4347b655ccee98bd6715fbc692ea4cfa9d4.jpg
https://uploads.disquscdn.com/images/80ef06ca9a7e00366002fa238a17ffe7542329c9f85b093551ccde8f6497d8f7.jpg
Evan Jones: ”The main culprit is homogenization. 22% of stations are well sited, while 78% are clearly non-compliant. Homogenization (by whatever method) is accomplished via pairwise adjustment, and the result is that the well sited station trends (sic) are adjusted sharply upward to match those of the poorly sited majority, not the other way around, while poorly sited stations show almost no adjustment.”
“It doesn’t matter exactly how homogenization is done: all those methods pairwise well sited with mostly poorly sited stations, and recursing it removes all trace of the well sited station difference. I confirmed this in several long discussions with Dr. Venema (“father” of climate data homogenization). If there is a systematic error in a dataset, homogenization will not, cannot accomplish its intended ends, and makes the problem worse rather than better: In this case, homogenization actually increases the trend (Tmean, Tmax, and especially Tmin) results to higher than the straight trend average of all stations.
The well sited – poorly sited digression is gradual, not a result of spurious step jumps … which further strengthens our results.”
https://disqus.com/home/discussion/theatlantic/a_scientific_look_at_bad_science/#comment-2213822882
”Temperature-trend estimates vary, according to site classification, with poor siting leading to an overestimate of minimum temperature trends, and an underestimate of maximum temperature trends, resulting, in particular, in a substantial difference in estimates of the diurnal temperature range trends.”
”Comparison of observed temperatures with [North American Regional Reanalysis temperatures] shows that the most poorly sited stations are warmer compared to [North American Regional Reanalysis] than are other stations, and a major portion of this bias is associated with the siting classification, rather than the geographical distribution of stations.”
“According to the best‐sited stations, the diurnal temperature range in the lower 48 states has no century‐scale trend.”
”… the stations comprising the USHCNv2 data set did not undergo the rigorous site selection process of their [United States Climate Reference Network] counterparts, and do not generally have redundant temperature sensors that permit intercomparison in the event of instrument changes.”
”… the full adjustment increases the linear trend by about 1°C/century in most classes, making it positive for all but CRN 5 [93.8% of the stations]. The magnitude of the linear trend in diurnal temperature range is over twice as large for [Climate Reference Network site ratings] 1 & 2 (0.13°C/decade) as for any of the other [Climate Reference Network site rating] classes.”
Fall, Souleymane, et al. 2011 “Analysis of the impacts of station exposure on the US Historical Climatology Network temperatures and temperature trends.” Journal of Geophysical Research: Atmospheres
http://landsurface-qa.itap.purdue.edu/publications-protected/J108.pdf
https://uploads.disquscdn.com/images/fa61eb5fc2cd5cd0ac0da6fca78aecb5490ba6b5011aa813566f9c875cb62338.jpg
Often, the past is cooled, and the present, warmed.
Do you think that the surfaced data are being “altered” but that the satellite data are not?
Here is Versions 6 of the adjustment, alteration, fudging, correcting or whatever of the UAH satellite data. I have a doubts about what Dr. Spencer says in his blogs, but he and Dr. Christy, along with scientists in other groups, have done a decent job of making a dog walk on its hind legs, by getting satellite sensors to measure temperatures of the atmosphere.
How far can you get reading this summary of the process the satellite data go through?
“Version 6.0 of the UAH Temperature Dataset Released: New LT Trend = +0.11 C/decade”
http://www.drroyspencer.com/2015/04/version-6-0-of-the-uah-temperature-dataset-released-new-lt-trend-0-11-cdecade/
I don’t think anything. That’s my whole point! I don’t know what to think. There is conflicting data everywhere you look.
“I don’t know what to think.”
Good for you. Some folks aren’t willing to admit what they don’t know. I have been in the physical sciences for almost 50 years and I don’t know most of what I would like to know.
It is difficult to find a good introduction to climate change on the Web. Here are two that might work for you.
Climate Change 101
http://ncse.com/climate/climate-change-101
The Center for Climate and Energy Solutions
http://www.c2es.org/science-impacts/basics
Dr Roy Spencer puts it very succinctly, when he says that the ‘thermometer’ temperature record is spotty, and that the satellite temperature record averages in, rather uniformly, the whole atmosphere, when calculating the global temperature.
”…if for no other reason than this: thermometers cannot measure global averages — only satellites can. The satellite instruments measure nearly every cubic kilometer – hell, every cubic inch — of the lower atmosphere on a daily basis. You can travel hundreds if not thousands of kilometers without finding a thermometer nearby.”
http://www.drroyspencer.com/2014/10/why-2014-wont-be-the-warmest-year-on-record/
What version or we on for the 1880 surface temperatures… How could we possibly still be adjusting it.
”Veteran award-winning journalist Günter Ederer reports… data computation expert Professor Dr. Friedrich Karl Ewert… ”
”Ewert’s findings seem to show NASA has intentionally and systematically rigged the official government record of global temperatures to show recent global warming where none would exist without the upwards ‘revisions.’”
NASA (GISS) made changes around 3 to 5 years ago. ”…the data measured since 1881 were altered so that they showed a significant warming, especially after 1950. …A comparison of the data from 2010 with the data of 2012 shows that NASA-GISS had altered its own datasets, so that, especially after WWII, a clear warming appears – although it never existed.”
http://www.principia-scientific.org/nasa-exposed-in-massive-new-climate-data-fraud.html?utm_campaign=nov-24-2015&utm_medium=email&utm_source=newsletter
”It reads like a conspiracy theory, …”
An analysis ”…was possible because the data provided by NASA-GISS had been archived before 2010 and could therefore be compared with those from after 2012.
…It turns out that ten different methods were used to produce global warming. They are all documented in the study with examples.
6 of the 10 examples were used most often.
➤ A reduction of the annual mean values in the initial phase.
➤ A reduction in individual higher values in the first heat stage.
➤ An increase in individual values in the second heat phase.
➤ A suppression of incipient circa 1995 second cooling phase.
➤ A shortening of the data series to the previous decades.
➤ For long time series, the data series were even reduced by the early centuries.
” Google Translate, from the original German: http://www.achgut.com/dadgdx/index.php/dadgd/article/sind_die_klimadaten_manipuliert#When:15:45:00Z
Lüdecke, Link, and Ewert 2011
”We evaluate to what extent the temperature rise in the past 100 years was a trend or a natural fluctuation… ”
”The data document a strong urban heat island effect (UHI) and a warming with increasing station elevation.”
”…the probabilities that the observed temperature series are natural have values roughly between 40% and 90%, depending on the stations characteristics and the periods considered. ’Natural’ means that we do not have, within a defined confidence interval, a definitely positive anthropogenic contribution…”
”…local records show a different picture, since cooling, not warming, is found for a high percentage of temperature stations worldwide.”
”…the homogenization and grid box procedures used to establish global records are inevitably arbitrary and, therefore, could cause quite different outcomes… As a consequence, the standard deviation, which is a decisive attribute in our analysis, becomes unrealistically small in global records.”
”…GISS gives no further details about the procedures to establish its global records except for an annotation about the elimination of outliers and homogeneity adjustments.”
”Global records should therefore be considered with care because they could depend on an inevitably arbitrary selection and different algorithms. Consequently and as already stressed earlier, we did not use global records in this study.”
”From 1998 on, the global temperatures begin again to drop. This also conforms to [71] and the data recorded by HADCRUT 3GL, RSS, GISS, and UAH, which at the least show temperature series as remaining flat.”
”Conclusion
In this paper, we have used 2249 unadjusted monthly temperature records of 100
and 50 years in length and evaluated the temperature changes for the periods
1906-2005, 1906-1955, and 1956-2005. Our analysis was based exclusively on local
records and applied DFA, Monte Carlo methods and synthetic records. The main
results and conclusions are the following.
a) The mean of all stations shows 0.58 °C global warming from 1906 to 2005. If
we consider only those stations with a population of under 1000 and below
800 meter above sea level this figure drops to 0.41 °C and would probably
decrease even further if we were to take into account the warm biases caused
by the worldwide reduction in rural stations during the 1990s, by changes
to the screens and their environments, and by the appearance of automatic
observing systems.
b) From 1906 to 2005, about a quarter of all records show falling temperatures.
This in itself is an indication that the observed temperature series are pre-
dominantly natural fluctuations. ’Natural’ means that we do not have within
a defined confidence interval a definitely positive anthropogenic contribution
and, therefore, only a marginal anthropogenic contribution can not be excluded. We evaluated – with a confidence interval of 95% – the probability
that the observed global warming from 1906 to 2005 was a natural fluctuation
as lying between 40% and 70%, depending on the station’s characteristics.
For the period of 1906 to 1955 the probabilities are arranged between 80%
and 90% and for 1956 to 2005 between 60% and 70%.
c) By separating stations into specific station groups, such as those with a
defined minimum population, a strong UHI and elevation warming can be
identified.
d) The vast majority of temperature stations are found on land and in the
northern hemisphere, and have Hurst exponent of α ≈ 0.63 in such locations. However, two thirds of the Earth are covered with water, and the
relatively few stations on islands or near oceans have higher Hurst exponent
of α ≈ 0.7. Therefore, a real exponent for the entire Earth could be somewhat higher than α ≈ 0.63. Records with higher exponents embody even
higher probabilities for natural fluctuations.
”
Lüdecke, Horst-Joachim, Rainer Link, and Friedrich-Karl Ewert 2011. “How natural is the recent centennial warming? An analysis of 2249 surface temperature records.” International Journal of Modern Physics
http://citeseerx.ist.psu.edu/viewdoc/download?doi=10.1.1.306.3811&rep=rep1&type=pdf
For the scientists, it’s grant money and they get to feel like they are saving the world. There are really very few people that control the databases.
It’s about Control.
Just stumbled across this:
https://uploads.disquscdn.com/images/4ef7994847eb236a5909fb86730197db9c85ef9e1b9f86192036594b9cd2ff79.jpg
Llast month, I ran a linear regression analysis on 2014 GISS data, and determined that the data supported a recent cooling trend since 2002.
The new 2015 data became available (not Dec-Dec, but the meteorological year).
2014 was 6.0°C, the new 2015 data was 4.5°C, so I thought that the data would support a longer cooling trend. Without looking at the data, I grabbed it and ran the calculation … no cooling trend is supported, only a warming trend, in spite of a 1.5°C cooling over the last year. What an insult to the weather observers that recorded the thermometer readings.
Another web site has quite a collection of data, regarding the Surface Tamperature dataset
http://realclimatescience.com/2015/12/noaa-global-temperature-fraud/
The never-ending line of GuBMuNT SiGHNTS stewdints talking about how, Pot is like Heroin, and a frigid fluid bath, shading and scrubbing and refrigerating sensors, is a big oL’ GiaNT HeeTuR up thair in thuh sky! YaW!
What a bunch of utter
Hicks.
There is a sphere rotated in vacuum, illuminated by a nearby glowing object. Surface embedded with sensors, energy in is maximum, energy out is minimum: modes of energy in are one; modes of energy out are one.
An insulating gas envelope is suspended around the sphere such that through diffractive or diffuse, reflective losses, 20% energy never reaches sensors which previously did.
This reduction of energy to sensors is described as:
(a) warming
(b)cooling
Energy sensors reflect this loss of energy through depicting
(a)less energy arriving than when, more energy was arriving,
(b)more energy arriving, than when more energy was arriving.
How many modes of cooling have been created by the atmosphere?
Name them.
How many modes of warming have been created by the atmosphere?
Name them.
When 20% energy in has been reduced through diffraction the temperature of the insulating envelope is still many degrees COOLER
than the temperature of the surface. Incidental turbulent contact between COLD gas molecules and WARM surface molecules
creates a SECOND MODE of COOLING called CONDUCTION.
When COLD GAS washes a WARM sensor this contact creates
(a)cooling
(b)warming
How many modes of cooling have been added by the atmosphere?
Name them.
How many modes of warming have been added by the atmosphere?
Name them.
Don’t be wrong because you’ve only got one more shot at even proving you know the difference between hot and cold gubmunt schooler.
One of the species of gas molecules lies chilled to the liquid state across 70% of the surface of the sphere.
It evaporates from the surface changing phase, taking energy with it to higher regimes. Upon loss of energy it condenses changing phase again – and returns to the surface more rapidly than if it didn’t solidify to ice.
This ACCELERATION of COOLING is called CONVECTION. It represents an ADDITIONAL MODE of COOLING created by the atmosphere.
This is the THIRD MODE of COOLING c.r.e.a.t.e.d. by the atmosphere.
Named they are Diffraction (shading) Conduction (scrubbing) and Convection (phase change refrigeration)
What is the number of modes of warming created
by the turbulent, frigid, insulating envelope? Name them.
Discuss your belief in a frigid, turbulent gas bath, warming the sensors it shades/scrubs/phase change refrigerates.
Do so in such way the entire thread doesn’t laugh at you to your face.
Name the law of thermodynamics written to describe the atmosphere.
What is the centerpiece of that law that makes it possible for it to bridge and bond, the physics and calculations of all the gas laws into one?
What is it’s name, and what does it represent?
C’mon, HiLLBiLLieS.
let’s HEAR it from the GuBMuNT SCHuLe HICKS
who have HUNDREDS of AUTHORS
who have HUNDREDS of PEER REVIEWED ARTICLES
who have MILLIONS of PAGES of CRITICAL REVIEW
about how Pot is Like Heroin and if you don’t think so, you go to jail.
Your CHURCH has told you about a FRIGID GAS ENVELOPE
that Magically, DUN TUR’nT into a BIG OL GIANT HeeTuR! Ya’W!
That’s the problem with you low information voters, you seek a government employee to think for you because one PUT YOU through
POT
is
like
HEROIN
school.
Little of the incoming radiation, from the Sun, is absorbed by the atmosphere. Much of the outgoing radiation, from the Earth is absorbed, by greenhouse gases. GHGs have little effect on the energy coming in, they absorb much of the energy going out, the surface of the Earth is warmer than if they were not there.
http://www.barrettbellamyclimate.com/userimages/Sun2.jpg
The green house gases of the atmosphere are almost totally responsible for all light being deflected to space in the infrared spectra. About 40% sunlight is infrared,
green house gases deflect about half that out to space never to see a sensor on earth or warm it.
The mode of cooling named diffraction whereby light is deflected to space block 20%.
When there is a sphere rotating in vacuum illuminated by a light there is one mode energy in: radiant.
There is one mode energy out: radiant.
Upon existence of the green house gases which block 20% sunlight in, the mode of cooling the sphere of the earth known as diffraction is created.
There could be no diffraction without the atmospheric envelope, the green house gases are responsible for the vast majority of the cooling due to energy being deflected to space.
The envelope remains colder than the surface so incidental turbulent contact creates the second mode of cooling, conduction.
One species of atmospheric species water lies chilled on the surface of the sphere of the earth in liquid or solid form covering 70% of the surface.
When that water changes phase evaporating from the surface as cooling
it rises in accordance with gravity to dump energy toward lower energy regimes above,
and returns to the surface faster than if it remained gas.
This is the third mode of cooling created by the existence of the atmosphere,
the second mode of cooling created directly and almost completely by the green house gases.
End of your ”Magic Gas Made A Heater” story.
The earth is a globe in roughly spherical form rotating in vacuum lit by a light. When an atmosphere is added a mode of energy REDUCTION to the surface: COOLING
is created immediately. This mode of COOLING is named DIFFRACTION mode loss.
When sufficient green house gases are added to the atmospheric envelope 1% energy to the surface is reduced in COOLING the DIFFRACTION COOLING MODE has reduced energy to the surface by 1%.
When sufficient green house gases are added to the atmospheric envelope 5% energy to the surface is reduced in COOLING the DIFFRACTION COOLING
MODE has reduced energy to the surface by 5%
When sufficient green house gases are added to the atmospheric envelope
10% energy to the surface is reduced in COOLING the DIFFRACTION COOLING
MODE has reduced energy to the surface by 10%
When sufficient green house gases are added to the atmospheric envelope
15% energy to the surface is reduced in COOLING the DIFFRACTION COOLING
MODE has reduced energy to the surface by 15%
When sufficient green house gases are added to the atmospheric envelope 20% energy to the surface is reduced in COOLING the DIFFRACTION COOLING
MODE has reduced energy to the surface by 20%. THIS is the CURRENT SITUATION.
When sufficient green house gases are added to the atmospheric envelope
21% energy to the surface is reduced in COOLING the DIFFRACTION COOLING
MODE has reduced energy to the surface by 21%.
END of your MAGIC heater in the sky, low information voter, BULLSHOOT.
Not even wrong.
Your FUZZY WUZZIE WISH you could SAY something betrays your complete grasp of the subject.
You don’t make MAGIC WARMING CAUSE THE GUBMUNT SED SO
because you added MORE of the GASES that stop 20% of ENERGY reaching the surface of the PLANET.
That’s why you’re TALKING like you have your MOUTH full of MARBLES.
It goes with the HEAD full of marbles it took to persuade you the GASES CREATING and DOMINATING 2 separate modes of COOLING
are the ”CORE”
of a MAGIC HEATER that makes the SKY HOT if YOU USE FIRE.
You’re a THERMO-BiLLy who never COULD count.
Poe’s law.
It’s you’re religion, hick, you characterize it however your stupid *&& sees fit.
So how many angels can dance on the head of a pin? This whole climate debate makes about as much sense. We do not understand nature and its forces, no one can agree on everything, and the climate continues to do what its done since the dawn of creation….whatever it damned well wants to.
I equate the AGW people with the “Ancient Aliens” and “Starchild” crowd. People for whom their convictions have become the equivalent of religious fervor, all other facts and explanations be damned…or silenced.
Nonsense. This is fossil-fuel-industry and superstition-generated propaganda. Ignorance is nature’s most effective long-term population control. A friend of mine who is infinitely better-educated than Mr. Monckton and spends several months of the year traveling around the world observing and speaking, has been invited three times to address the Naval War College on the probable consequences of our current “ignore the warming” policies. The navy is worried, because they have a pretty good idea of what’s coming at them. For starters, once the ocean is up another 2-3 feet in Florida, a cat-5 hurricane will bankrupt nearly every insurance company in the country and pitch us into a depression that will make 1929 look like a child’s birthday party.
Well that probably won’t affect too many of us by the time it happens 10 or 20 million years from now… How do you plan on fixing the far-more-influential-on-the-climate problem of CONTINENTAL SHIFT?
Same thing they said 20 years ago…
Won’t don’t you actually show where the data is wrong or incomplete… You don’t really know?
When all else fails, just tilt the chart 45 degrees to the left and tell the schoolkids it’s 700 degrees at the South Pole.
Ha, Ha, Ha, Ha, Ha! Go back to Koch and get more money or your next article.
Too much data for you to absorb? We can do a kindergarten version for you if you want.
I am not mad at these scumbag politicians lying to the American public. That is how they get elected. I am disappointed at the American private citizens that speed on highways to get to their sofas to watch reality television and eat greasy potato chips while they get fat and manipulated by the media. In essence this country is in trouble.
freee rp buck*urphy!
Science isn’t trying to prove anthropogenic climate change anymore, it has. Science has even determine why people don’t believe in climate change; It turns out that paradigm shifting is harder than lying to yourself about what the evidence means. Furthermore, the evidence is less important than the presenter; if you hate Obama you don’t believe anything he says, regardless of the factual nature of the statement.
http://www.exposethebastards.com/who_is_marc_morano
HOW’S THAT PAUSE GOIN? Hot enough for ya yet? lol – boy you sure put a lot of work into your horsesh*t! Are you well paid to help burn humanity down to the ground, at least?
maybe we should wait a few more years
http://papers.ssrn.com/sol3/papers.cfm?abstract_id=2839119