
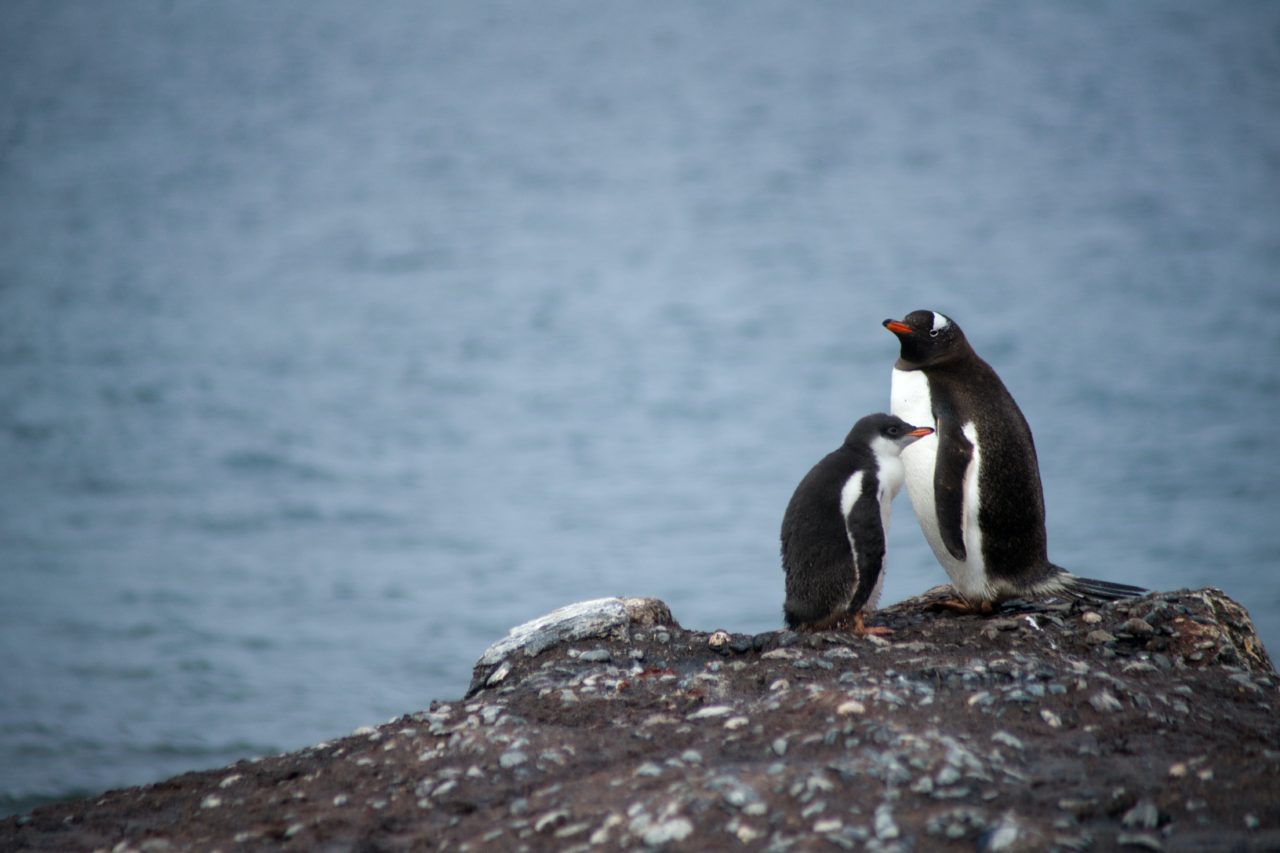
Antarctica might go green say scientists (only 2km of ice and 50C of warming to go)
This is an example of a custom excerpt, which will replace “blurb” functions. …
4 Graphs That Demonstrate Why The IPCC Climate Models Will NEVER Be Accurate
…ANTARCTIC ICE EXPANSION SHOWS CLIMATE MODELS ARE UNRELIABLE
Despite a 20 percent increase in atmospheric CO2, and model predictions to the contrary, sea ice in the Antarctic has expanded for decades. Such observations are in direct opposition to the model-based predictions of the IPCC. This should give pause for thought about climate alarmism in general.

While there have been thousands of legacy media stories about the very real decline in summer sea-ice extent in the Arctic Ocean, we can’t find one about the statistically significant increase in Antarctic sea ice that has been observed at the same time.
Also, comparisons between forecast temperature trends down there and what’s been observed are very few and far between. Here’s one published in 2015:
 and model-forecast (red) Antarctic sea-ice extent published by Shu et al. (2015) shows a large and growing discrepancy, but for unknown reasons, their illustration ends in 2005.")
Observed (blue) and model-forecast (red) Antarctic sea-ice extent published by Shu et al. (2015) shows a large and growing discrepancy, but for unknown reasons, their illustration ends in 2005.
For those who utilize and trust in the scientific method, forming policy (especially multi-trillion dollar policies!) on the basis of what could or might happen in the future seems imprudent.
Sound policy, in contrast, is best formulated when it is based upon repeated and verifiable observations that are consistent with the projections of climate models. As shown above, this does not appear to be the case with the vast ice field that surrounds Antarctica.
According to the most recent report by the Intergovernmental Panel on Climate Change (IPCC), CO2-induced global warming will result in a considerable reduction in sea ice extent in the Southern Hemisphere. Specifically, the report predicts a multi-model average decrease of between 16 and 67 percent in the summer and 8 to 30 percent in the winter by the end of the century (IPCC, 2013).
Given the fact that atmospheric CO2 concentrations have increased by 20 percent over the past four decades, evidence of sea ice decline should be evident in the observational data if such model predictions are correct. But are they?
Thanks to a recent paper in the Journal of Climate by Josefino Comiso and colleagues, we now know what’s driving the increase in sea-ice down there. It’s — wait for it — cooling temperatures over the ocean surrounding Antarctica.
This team of six researchers set out to produce an updated and enhanced dataset of sea ice extent and area for the Southern Hemisphere
Why the UN’s Climate Models Are Inherently Unreliable, and Should Be Abandoned
Those who have examined the Wallace, Christy, and d’Aleo (WCD) 2016 and 2017 reports discussed in recent months on this blog may be understandably confused as to how they relate to the numerous climate models used by the UN IPCC and the USEPA over many years in support of their climate alarmism.
Atmospheric Scientist Dr. Fred Singer on the ‘failure of UN IPCC to find credible evidence for anthropogenic global warming’
By S. Fred Singer
Exploring some of the intricacies of GW [Global Warming] science can lead to surprising results that have major consequences. In a recent invited talk at the Heartland Institute’s ICCC-12 [Twelfth International Conference on Climate Change], I investigated three important topics:
1. Inconsistencies in the surface temperature record.
2. Their explanation as artifacts arising from the misuse of data.
3. Thereby explaining the failure of IPCC to find credible evidence for anthropogenic global warming (AGW).
A misleading graph

Fig 1 20th century temps; top—global; bottom– US
Although these two trends look similar, they are really quite different: the initial warming is genuine, but the later warming is not. What a surprise! I wouldn’t exactly call it ‘fake,’ but it just does not exist; I try to demonstrate this difference as an artifact of the data-gathering process, by comparing with several independent data sets covering similar time intervals.
The later warming is contradicted by every available dataset, as follows:
**the surface record for the ‘lower 48’ [US] shows a much lower trend; [see fig 1, bottom]; presumably there is better control over the placement of weather-stations and their thermometers;
**the trend of global sea surface temp [SST] is much less; with 1995 temp values nearly equal to those of 1942 [according to Gouretski and Kennedy, as published in Geophysical Research Letters in 2012];
** likewise, the trend of night-time marine air-temperatures [NMAT], measured with thermometers on ship decks, according to data from J Kennedy, Hadley Centre, UK
** atmospheric temperature trends are uniformly much lower and close to zero (during 1979-1997), whether measured with balloon-borne radiosondes or with microwave sounding units [MSU] aboard weather satellites [see fig 8 in ref 2]
** compatible data on solar activity that show nothing unusual happening. Interestingly, the solar data had been assembled for a quite different purpose – namely, to disprove the connection between cosmic rays and climate change [see here fig 14 of ref 2], assuming that the late-century warming was real. In the absence of such warming, as I argue here, this attempted critique of the cosmic-ray–climate connection collapses.
** proxy data also show near-zero trends, whether from tree rings or …
Paper: ‘Earth On Course For 100-Year Mini-Ice Age’
http://www.dailystar.co.uk/news/latest-news/611671/ice-age-britain-freeze-climate-change-weather
Experts told Daily Star Online planet Earth is on course for a “Little Age Ice” within the next three years thanks to a cocktail of climate change and low solar activity.
Research shows a natural cooling cycle that occurs every 230 years began in 2014 and will send temperatures plummeting even further by 2019.
Scientists are also expecting a “huge reduction” in solar activity for 33 years between 2020 and 2053 that will cause thermometers to crash.
Both cycles suggest Earth is entering a global cooling cycle that could have devastating consequences for global economy, human life and society as we know it.
If predictions of the world-wide big freeze come true, the plot to 2004 film The Day After Tomorrow would not be far from reality during winter.
Climate Change Alarmists’ Prediction About Pacific Northwest Now Looks Embarrassingly Bad
…Study in Nature: 21 climate models find climate change ‘may increase net recreational physical activity in U.S.’ by 2099
Here’s abstract of Nature Human Behavior paper on global warming predictions of exercise rates in next 40-80 years.
Regular physical activity supports healthy human functioning1,
 …
…
13 Most Ridiculous Predictions Made on Earth Day, 1970
 Saturday is Earth Day — an annual event first launched on April 22, 1970. The inaugural festivities (organized in part by then hippie and now convicted murderer Ira Einhorn) predicted death, destruction and disease unless we did exactly as progressives commanded.
Sound familiar? Behold the coming apocalypse, as predicted on and around Earth Day, 1970:
- “Civilization will end within 15 or 30 years unless immediate action is taken against problems facing mankind.” — Harvard biologist George Wald
- “We are in an environmental crisis which threatens the survival of this nation, and of the world as a suitable place of human habitation.” — Washington University biologist Barry Commoner
- “Man must stop pollution and conserve his resources, not merely to enhance existence but to save the race from intolerable deterioration and possible extinction.” — New York Times editorial
- “Population will inevitably and completely outstrip whatever small increases in food supplies we make. The death rate will increase until at least 100-200 million people per year will be starving to death during the next ten years.” — Stanford University biologist Paul Ehrlich
- “Most of the people who are going to die in the greatest cataclysm in the history of man have already been born… [By 1975] some experts feel that food shortages will have escalated the present level of world hunger and starvation into famines of unbelievable proportions. Other experts, more optimistic, think the ultimate food-population collision will not occur until the decade of the 1980s.” — Paul Ehrlich
- “It is already too late to avoid mass starvation,” — Denis Hayes, Chief organizer for Earth Day
- “Demographers agree almost unanimously on the following grim timetable: by 1975 widespread famines will begin in India; these will spread by 1990 to include all of India, Pakistan, China and the Near East, Africa. By the year 2000, or conceivably sooner, South and Central America will exist under famine conditions…. By the year 2000, thirty years from now, the entire world, with the exception of Western Europe, North America, and Australia, will be in famine.” — North Texas State University professor Peter Gunter
- “In a decade, urban dwellers will have to wear gas masks to survive air pollution… by 1985 air pollution will have reduced the amount of sunlight reaching earth by one half.” — Life magazine
- “At the present rate of nitrogen buildup, it’s only a
New Paper: N. Hemisphere Temps Rose 4–5°C Within ‘A Few Decades’ 14,700 Years Ago – 40 Times Faster Than Today’s Rates
Temperatures, Sea Levels ‘Naturally’ Rise
30 – 40 Times Faster Than Today’s Rates
Modern Temperatures Only Rising 0.05°C/Decade
Since 1850, CO2 concentrations have risen from 285 ppm to 400 ppm. During these ~165 years, the IPCC has concluded that surface temperatures have warmed by 0.78°C. This is a warming rate of only 0.05°C per decade for 1850-2012 — which happens to be the same rate of warming over the 1998-2012 period.
IPCC AR5 (2013): “The globally averaged combined land and ocean surface temperature data as calculated by a linear trend, show a warming of 0.85°C over the period 1880 to 2012, when multiple independently produced datasets exist. The total increase between the average of the 1850–1900 period and the 2003–2012 period is 0.78 °C, based on the single longest dataset available 4 (see Figure SPM.1). … [T]he rate of warming over the past 15 years (1998–2012; 0.05 °C per decade), which begins with a strong El Niño, is smaller than the rate calculated since 1951 (1951–2012; 0.12 °C per decade).”
Modern Sea Levels Only Rising 0.17 Of A Meter/Century
IPCC AR5 (2013): “[T]he rate of global averaged sea level rise was 1.7 mm yr between 1901 and 2010“
Historical Hemispheric Temperatures Rose 2.0°C/Decade
According to a new paper, the Bølling Warming event 14,700 years ago raised the surface temperature for the entire Northern Hemisphere by 4 to 5°C within a few decades. This is a hemispheric warming rate of approximately 2.0°C per decade, which is 40 times faster than the 0.05 °C per decade global warming rate since 1850 (and 1998).
Historical Sea Levels Rose 5.3 Meters/Century
Central Greenland’s surface temperatures rose by as much as 12°C during this time frame (14,700 years ago to 14,500 years ago). Consequently, glaciers and ice sheets disintegrated rapidly and sea levels rose by about 18 meters (“12-22 m”) in 340 years. An 18 m rise in 340 years is the equivalent of 5.3 meters per century, which is more than 30 times faster than the rate of sea level change (0.17 m per century) between 1901 and 2010.