Antarctic Record Temperature Con – ‘Balmy temperatures’ claim is ‘clearly nonsense’
Via: https://notalotofpeopleknowthat.wordpress.com/2017/03/02/antarctic-record-temperature-con/
By Paul Homewood
The supposed record comes from Esperanza. As Jim Steele at WUWT points out, Esperanza is at the northern tip of the Antarctic peninsula, at a latitude of 63.4S, just about as far outside the Antarctic Circle as you could get.

And as WUWT also points out, the temperature was purely the product of a fohn wind.
The temperature of 63.5F was actually set in March 2015, but has only just been officially confirmed by the WMO. As the Capital Weather Gang at the Washington Post noted at the time, the previous record of 62.8F was also set at Esperanza as far back as 1961.
The implication now is that “balmy” temperatures of 63F are unheard of Antarctica, which is clearly nonsense.
And as we can see, monthly average temperatures in March 2015 were not in the least unusual. Indeed, the hottest March was in 1965.
https://data.giss.nasa.gov/cgi-bin/gistemp/show_station.cgi?id=301889630008&dt=1&ds=14
None of this information is mentioned by either Greenpeace, or media outlets such as MSN, who also carry the story.
But the really dishonest part is that photo of two poor penguins stranded at the top of a melting lump of snow.
As Joe has discovered, exactly the same photo appeared in December 2013, in an article by the International Science Times, which was about record cold temperatures in Antarctica. The picture is actually on Cape Denison, as the report makes clear:
When it’s late February and you’re complaining about the winter dragging endlessly on, take comfort in the fact that you’re not on the East Antarctic Plateau, where scientists have measured the coldest temperature on earth. At negative 135.8 degrees Fahrenheit, the August 10, 2010, temperature was “tens of degrees colder than anything ever seen in Alaska, Siberia or Greenland,” said Ted Scambos of the National Snow and Ice Data Center in Boulder, Colo., the group that made the discovery.
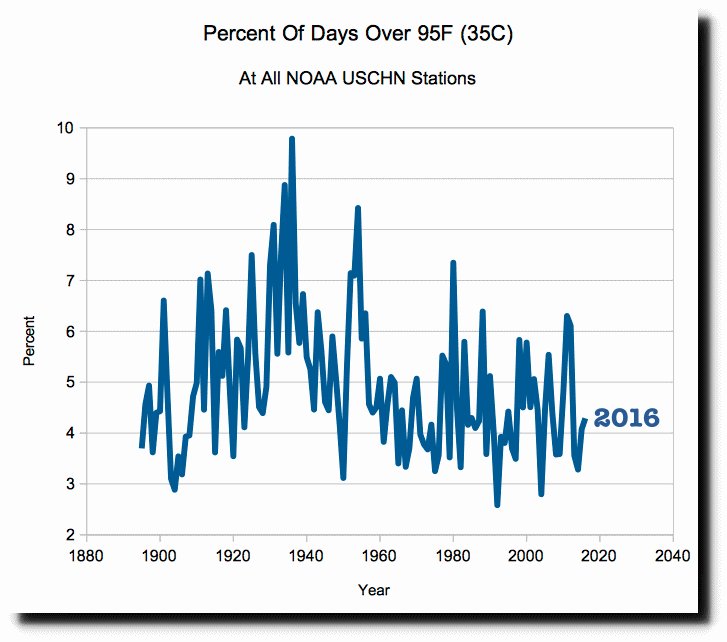
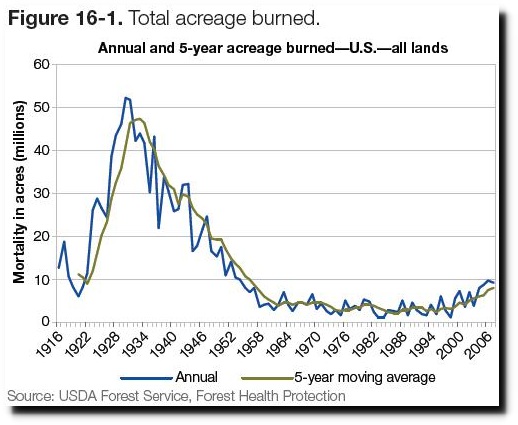
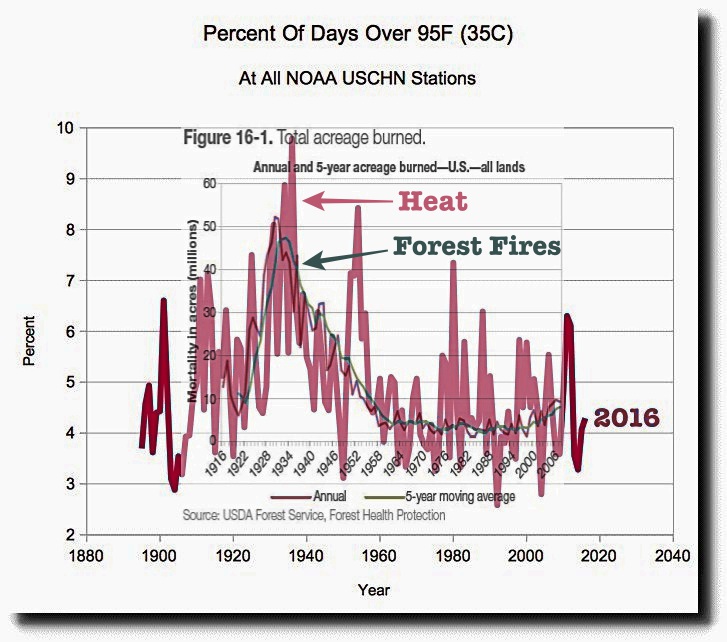
Analysis: The 1930’s Was Much Hotter And Drier In The US
The frequency of hot days in the US during the 1930’s was much higher than it is now.
Total burn acreage was also much higher.
Indicator 3.16: Area and percent of forest affected by abiotic agents
The correlation between hot weather and burn acreage is almost perfect.
Government climate experts tell us that the US is getting hotter and fires are increasing.
The Hottest Year on Record? More like a lot of hot air
By Paul Homewood
The Hottest Year on Record? A lot of hot air, more like
UK Telegraph’s Booker’s on form today:
Inevitably, as 2016 neared its end, the usual suspects, such as the BBC, were all piling in to remind us that it was “the hottest year on record”, with particular focus on the recent “super-heatwave” producing temperatures 20 degrees or more above average in the Arctic. But as usual it has been important to know just what all this fevered hype was leaving out.
The reason I so often quote the blog run by Paul Homewood, Notalotofpeopleknowthat, is that, uniquely on this side of the Atlantic and drawing on a huge range of scientific and historical data, he so expertly explains what we are not being told by the prevailing fog of propagandist groupthink emanating from governments and the media on all matters relating to climate and energy.

It’s baking… Credit: AP Photo/Ebrahim Noroozi/AP Photo/Ebrahim Noroozi
Who might have guessed, for instance, how the closing weeks of “the hottest year evah” have seen unusual cold and snowfall across a vast swathe of the northern hemisphere: snow in the Sahara desert, Saudi Arabia, Syria, the Peloponnese, Korea, China. Blizzards across the northern United States from Montana to New England. Even in Siberia, not a stranger to extreme cold, locals have been stunned by temperatures as low as minus 60 degrees. A graph based on official data shows that snow extent in the northern hemisphere last autumn was the second greatest on record since 1967, and that five of the snowiest have come since 2010.
As for that “Arctic heatwave”, in a post headed “Going to the Arctic? Don’t bother packing that bikini”, Homewood shows a chart giving detailed temperature readings on Christmas Day for that entire region. Although in a small sliver around the North Pole temperatures were much higher than usual, thanks to warm air blowing in from the south, for much of the Arctic temperatures of minus 30 and 40 degrees were as usual for this time of year.
Homewood shows that similar warm spikes have regularly occurred before, not just in recent years but way back through the 20th century. According to the satellite records shown on Crysophere Today, last summer’s annual ice-melt was in fact less than that in seven of the previous nine years.
Of course even the most light-headed warmists concede …
Meteorologist: ‘This Heat Wave Is Child’s Play Compared to 1930s’

(CNSNews.com) – Meteorologist Joe Bastardi says the current heat wave in most parts of the U.S. – which tied the 135-year-old record temperature in Washington, D.C. on Saturday – is “child’s play compared to the 1930s.”
The National Weather Service (NWS) issued an “excessive heat warning” for “a prolonged period of dangerously hot temperatures” for much of the East coast, which remains in effect until 8 pm on Tuesday.
According to the NWS, the temperature at Ronald Reagan International Airport hit 101 degrees on Saturday, tying the old record of 101 degrees set on Aug. 13, 1881.

But if global temperatures are getting warmer because of manmade activities, such as the burning of fossil fuels, why was it so hot 135 years ago? CNSNews.com asked Bastardi, who is currently the chief forecaster at Weather Bell Analytics and the former chief long-range forecaster at Accuweather.
“There is no question this weekend was hot, with temperatures challenging and breaking records across the northeast,” Bastardi replied. “But to offer some perspective, many of these records went back to the 1800s, which meant [that] even without urban buildup, it was just as hot then.”
Bastardi added that 101 degrees is nothing compared to the heat wave that struck the Washington region back in the 1930s.
Long before SUVs and the term “carbon footprint” were invented, Americans endured sweltering heat waves, such as the summer of 1930, he said.
“Washington area farmers were certainly not spared in 1930, as intense, prolonged hot spells gripped the region during late July and early August,” according to a 2010 article in the Washington Post. “The official temperature recorded on July 20 was 106°F, which holds the record as the highest temperature ever recorded in Washington.
“Unofficially, 110°F was recorded that same day on Pennsylvania Avenue and 108°F at the National Cathedral,” the article continued. The summer of 1930 also set the record at 11 for number of days where temperatures reached or exceeded 100°F.
“By the end of the summer of 1930, approximately 30 deaths in Washington were blamed on the heat and thousands more had died nationwide,” the Postarticle said. “In Washington, there has never been another summer with a heat wave that has equaled the summer of 1930.”
Watch: Democrats at convention more worried about ‘climate change’ then ISIS
…
Software Expert Exposes Potential NASA Climate Data Fraud …Trend ‘Completely Fake’ And ‘Manipulated!’
Software Expert Exposes Potential NASA Climate Data Fraud …Trend “Completely Fake” And “Manipulated!
Note: Due to limited WIFI over next couple of days, comment moderation will be sporadic. ====================== Software engineering whiz Tony Heller makes presentation on climate change and the data behind it. If you haven’t watched it already, then do take the time to do so. “Utter nonsense” Heller, who goes by the pseudo-name of Steve Goddard at his wildly popular realclimatecience site, calls the idea that it’s getting hotter is “utter nonsense” and shows how US temperatures were much hotter in the 1930s. According to Heller, the warming in the US is not real, and was created through statistical tricks after 1990. Later he highlights some of the many ridiculous claims climate experts and activist politicians made, and have since turned out to be a complete folly. At this point the presentation rivets your attention and for skeptics it becomes one you don’t want to stop watching. “Manipulated to increase alarm” Heller calls the US warming trend “completely fake” and being due to “station data loss and fabrication” and later shows that NASA “erased” the once unanimously agreed cooling from 1940 – 1970: Not only temperature data have been altered, but so has sea level data, Heller later shows. Overall he writes “climate data is being manipulated to increase alarm“.
— gReader Pro…
Don’t Believe The Washington Post Propaganda, DC Summers Are Not Getting Hotter
Don’t Believe The Washington Post Propaganda, DC Summers Are Not Getting Hotter
By Paul Homewood https://www.washingtonpost.com/news/capital-weather-gang/wp/2016/07/14/d-c-s-summer-heat-is-rapidly-becoming-more-oppressive-analysis-finds/?tid=a_inl More fraud from Climate Central. The Washington Post reports: By Jason Samenow July 14 The temperature Thursday in Washington soared to 98 degrees, the hottest so far this summer. The heat index, which factors in humidity, registered 104 degrees. Get used to it. An analysis released Wednesday by Climate Central, a nonprofit science communication group based in Princeton, N.J., says these kinds of brutally hot and humid days are becoming more common. Climate Central’s States at Risk project, featuring an interactive website, not only analyzed historical heat and humidity data to document observed trends but also, using climate models, projected how hot and humid days will evolve into the future. All data point toward steamier times ahead. Hot and humid days up substantially since 1970 (Climate Central) The District is now sweltering in 95-degree heat on 7.5 more days per year than it did in 1970, Climate Central says. In 1970, D.C. averaged seven or eight 95-degree (or hotter) days in a typical year. Now the number is closer to 15. In the scorching summer of 2012, we had a record-tying 28 such days. https://www.washingtonpost.com/news/capital-weather-gang/wp/2016/07/14/d-c-s-summer-heat-is-rapidly-becoming-more-oppressive-analysis-finds/?tid=a_inl The nearest long running station to Washington is Laurel, in Maryland, just 17 miles away. The USHCN whisker plot of daily maximum temperatures shows that daily temperatures are not increasing, and were actually highest in the 1930s. http://cdiac.ornl.gov/cgi-bin/broker?_PROGRAM=prog.climsite_daily.sas&_SERVICE=default&id=185111&_DEBUG=0#gplot_clim_years It is easy to see why Climate Central used 1970 as their starting point. As CDIAC show below, most daily summer temperature records in Maryland were set prior to 1960, while the cold 1970s is plainly evident. (Bear in mind, these daily records include ties, so the probability of a record should be the same in every decade, assuming an unchanged climate). http://cdiac.ornl.gov/cgi-bin/broker?_PROGRAM=prog.select_d9k.sas&_SERVICE=default&id=188000 This carefully constructed deception is all designed to convince us that summers will become increasingly hot in the future, as the article goes on to state: D.C.’s summer climate to resemble South Texas? Using projections of summer warming by 2100, Climate Central says D.C.’s climate will, by then, most resemble today’s typical summer environs in Pharr, Texas — a Mexico border town. That is, it projects D.C.’s average summer high temperature to rise from roughly 87 degrees to 97 degrees. (Climate Central) Of course, such projections are based on climate models which assume the emissions of greenhouse …
CBS Uses Heat Wave to Play Up ‘Bigger Problems’ From Climate Change
Wednesday’s CBS Evening News used the recent heat wave in the United States to hype climate change. Mireya Villarreal featured a meteorologist who contended that “this is such a massive problem — and even if we were to completely stop all carbon emissions right now, we would still have a very serious situation. We’ve passed the tipping point.” Villarreal underlined that “2016 is the hottest year ever recorded,” and that “this season, fires are more intense; drought conditions are growing; and the arctic sea ice is melting sooner.” [video below]
The correspondent first noted that “from Minnesota to California, record-high heat is expected to linger for days.” She continued by playing her first clip from Mark Jackson of the National Weather Service, who used a greenhouse comparison to explain the heat wave. After giving her “hottest year ever recorded” line, she also reported the hot weather in other parts of the Northern Hemisphere.…
June Hottest Month On Record? It’s Just One More Overheated Claim
June Hottest Month On Record? It’s Just One More Overheated Claim
http://www.freerepublic.com/focus/f-news/3448895/posts
A trusted — by some — federal agency says that this June was the hottest June on record in the Lower 48. Many will take this as further evidence that man’s greenhouse gas emissions are cooking the planet. Others will look at it and ask “what in the world are these people talking about?”
— gReader Pro…
Data reveals: Many, Many More People Die Of Cold Than Heat
Amidst all the talk of people dying in heatwaves, we need to remember that many, many more people die of the cold than the heat.
This is self evident in the UK, where the ONS routinely calculate excess winter deaths each year. They never count summer ones, as that is when death rates are lowest.
But what is maybe less well known is that the same applies even in hot countries, as this study published in the Lancet last year showed:
Cold weather is 20 times as deadly as hot weather, and it’s not the extreme low or high temperatures that cause the most deaths, according to a study published Wednesday.
The study — published in the British journal The Lancet — analyzed data on more than 74 million deaths in 13 countries between 1985 and 2012. Of those, 5.4 million deaths were related to cold, while 311,000 were related to heat.
Because the study included countries under different socio-economic backgrounds and with varying climates, it was representative of temperature-related deaths worldwide, the study said. The sharp distinction between heat- and cold-related deaths is because low temperatures cause more problems for the body’s cardiovascular and respiratory systems, it added.
“Public-health policies focus almost exclusively on minimizing the health consequences of heat waves,” Gasparrini said. “Our findings suggest that these measures need to be refocused and extended to take account of a whole range of effects associated with temperature.”
This report backs up a U.S. study last year from the National Center for Health Statistics, which found that cold kills more than twice as many Americans as heat.
http://www.usatoday.com/story/weather/2015/05/20/cold-weather-deaths/27657269/
Of course, we can’t get away without any mention of climate change, with the US Today article concluding:
…The most recent study doesn’t project what its findings could mean for the future, particularly with climate change warming much of the globe over the next century.
“Extrapolating the results of this study for this purpose would only provide speculations not based on evidence,” Gasparrini said. However, he has received a grant from the United Kingdom to study that and hopes “we will answer this question soon,” he said.


