
More IPCC Misdirection: Its Dodgy Sea Level-Rise Assessment — Scientist rebut UN claims: ‘Recent scientific findings argue that rate of sea level rise since 1993 is little different than the long-term (20th century) rate of sea level rise once natural variability and non-climatic influences are accounted for’
More IPCC Misdirection: Its Dodgy Sea Level-Rise Assessment
http://www.cato.org/blog/more-ipcc-misdirection-its-dodgy-sea-level-rise-assessment
Patrick J. Michaels and Paul C. “Chip” Knappenberger
Global Science Report is a weekly feature from the Center for the Study of Science, where we highlight one or two important new items in the scientific literature or the popular media. For broader and more technical perspectives, consult our monthly “Current Wisdom.”
The UN’s Intergovernmental Panel on Climate Change (IPCC) is set to release its Fifth Assessment Report (AR5) of the physical science of climate change at the conclusion on its editorial meeting in Stockholm scheduled from September 23-26th.
A version of its Summary for Policymakers (SPM)—perhaps the most influential portion of the report as it is the widest read—has been “leaked” to generate media interest in the upcoming release. It certainly has, but perhaps not in the manner intended. The leaked SPM has revealed a document so flawed and removed from current science that it has been described as not only being “obsolete on the day that it is released, but that it will be dead wrong as well” (okay, we wrote that).
Examples already abound as to the problems evident in the leaked SPM. Here we add another—this one having to do with the recent rate of sea level rise.
In the Summary for Policymakers section of its Fourth Assessment Report (published in 2007) the IPCC had this to say about the rate of sea level rise:
Global average sea level rose at an average rate of 1.8 [1.3 to 2.3] mm per year over 1961-2003. The rate was faster over 1993 to 2003: about 3.1 [2.4 to 3.8] mm per year. Whether the faster rate for 1993 to 2003 reflects decadal variability or an increase in the longer-term trend is unclear.
Since then, we have highlighted numerous findings in the scientific literature that present strong evidence that the increase in the rate of sea level rise since 1993 is largely not an increase in the longer-term trend (or at least not from human-caused climate change which is the IPCC’s implication) and that the short-term rate of sea level rise has been slowing, and returning back towards the long-term average.
But the IPCC’s heart remains hardened.
The leaked version of the AR5 SPM includes this description of sea level rise:
It is very likely that the mean rate of global averaged sea level rise was 1.7 [1.5 to 1.9] mm …
New paper finds sea levels rising at less than 4 inches per century, with no acceleration: Study ‘finds global mean sea levels rose at only 1 mm/year, equivalent to less than 4 inches per century, over the 203 year period from 1807-2010’ — ‘The authors also find no evidence of acceleration of sea level rise, which indicates that there is no evidence of a human influence upon sea levels’
New paper finds sea levels rising at less than 4 inches per century, with no acceleration
http://hockeyschtick.blogspot.com/2013/09/new-paper-finds-sea-levels-rising-at.html
A new paper finds global mean sea levels rose at only 1 mm/year, equivalent to less than 4 inches per century, over the 203 year period from 1807-2010. The finding is remarkably similar to the sea level rise of 1.1-1.3 mm/yr found by the NOAA 2005-2012 Sea Level Budget, the only sea level budget which reconciles both satellite [altimeters & GRACE] & ARGO float data. The authors also find no evidence of acceleration of sea level rise, which indicates that there is no evidence of a human influence upon sea levels. In addition, the authors find that sea level rise is a localized rather than global phenomenon, with 61% of tide gauge records demonstrating no change in sea levels, 4% showing a decrease, and a minority of 35% showing a rise. This implies relative sea level change is primarily related to subsidence or post-glacial rebound [land height changes] rather than melting ice or steric sea level changes [thermal expansion from warming].
Excerpts:
If SLR is accelerating, sea levels should be nonstationary in first differences, but stationary in second differences. In none of the tide gauges and segments do the Dickey-Fuller and KPSS statistics support the accelerationist hypothesis. [i.e. there was no acceleration]
The substantive contribution of the paper is concerned with recent SLR in different parts of the world. Consensus estimates of recent GMSL rise are about 2mm/year. Our estimate is 1 mm/year. We suggest that the difference between the two estimates is induced by the widespread use of data reconstructions which inform the consensus estimates. There are two types of reconstruction. The first refers to reconstructed data for tide gauges in PSMSL prior to their year of installation. The second refers to locations where there are no tide gauges at all. Since the tide gauges currently in PSMSL are a quasi-random sample, our estimate of current GMSL rise is unbiased. If this is true, reconstruction bias is approximately 1mm/year.
Sea level rise is regional rather than global and is concentrated in the southern Baltic, the Ring of Fire, and the Atlantic coast of the US. By contrast the north-west Pacific coast and north-east coast of India are characterized by sea level fall. In the minority of locations where sea levels are rising the mean increase is about 4 mm/year and in some …
Antarctic sea ice expands to all-time record — baffling scientists
…Polar Bear Expert: ‘The annual minimum reached in late summer has little impact on polar bear health and survival. What matters most to polar bears is the presence of ample ice in spring and early summer (March-June), which is their critical feeding period’
What polar bear habitat could look like in another 5-6 weeks
http://polarbearscience.com/2013/09/22/what-polar-bear-habitat-could-look-like-in-another-5-6-weeks/
According to the National Snow and Ice Data Center (NSIDC, Sept. 20 report), the annual sea ice minimum extent was reached on Sept. 13, 2013.
At 5.10 million square kilometers, this year’s low was a whopping 1.69 million square kilometers above the minimum extent for 2012 (which was the lowest since 1979) and well within two standard deviations of the 19979-2010 average. (Two standard deviations: “Measurements that fall far outside of the two standard deviation range or consistently fall outside that range suggest that something unusual is occurring that can’t be explained by normal processes”).
The minimum extent for 2013 is virtually indistinguishable from the minimum for 2009, which was 5.13 million square kilometers. The ice was distributed a bit differently in 2009 – more in the east and less in the west — than it was this year (see Fig. 1 below).
Figure 1. I used JAXA to plot the date the 2013 minimum was reached (September 13, 5.10 million square kilometers, white) with an overlay (purple) for the same date back in 2009 (September 13, 2009, 5.13 million square kilometers), when that year’s minimum was reached. Areas of overlap are pink.
You’ll know from previous discussions here that the annual minimum reached in late summer has little impact on polar bear health and survival (see excellent summary of the evidence for that here). What matters most to polar bears is the presence of ample ice in spring and early summer (March-June), which is their critical feeding period.
But after the fast that many polar bears endure over the height of the summer, they are eager to get back onto the ice and resume hunting. When in the fall does that become possible?
I wondered what the similarity in extent for 2013 and 2009 might tell us about polar bear habitat development over the next month or so.
In other words, what might polar bears this year expect in the way of sea ice development by say, the end of October? When might they be able to start hunting?
So I used the JAXA (Japan Aerospace Exploration Agency) “Sea ice monitor” feature, which I used to generate Fig. 1 (which maps sea ice concentration for any date you choose back to 2002, see here), to plot the date the 2013 minimum was reached (September 13) with an …
Access: The ‘leaked’ IPCC AR5 draft Summary for Policymakers
Access: The “leaked” IPCC AR5 draft Summary for Policymakers
http://wattsupwiththat.com/2013/09/23/access-the-leaked-ipcc-ar5-draft-summary-for-policymakers/
For weeks, this document has been put in the hands of most every journalist that writes about climate issues, and many articles have been written about its contents. Given that much of the work done in it was publicly funded at universities, and because the discussion in the media has placed the issue in the […]…
Contrary to reports, global warming studies don’t show 97% of scientists fear global warming: ‘The 97% figure represented just 75 individuals’ – – Another study’s ‘results add up to little more than ‘carbon dioxide is a greenhouse gas’ and ‘mankind affects the climate.’
Contrary to reports, global warming studies don’t show 97% of scientists fear global warming
http://hockeyschtick.blogspot.com/2013/09/contrary-to-reports-global-warming.html
Meaningless consensus on climate change
Andrew Montford, Special to Financial Post | 19/09/13 8:51 AM ETMore from Special to Financial Post
NASA file/APa wealth of new empirical and semi-empirical evidence is now suggesting that any warming is likely to be far, far less than has been predicted by the vast electronic hypotheses that are the climate models.
Contrary to reports, global warming studies don’t show 97% of scientists fear global warming
Apart from a handful of eccentrics, everyone believes in the reality of manmade climate change. That’s the message of a recent paper in the journal Environmental Research Letters, the latest in a series of similar efforts that have been used as a stick with which to beat policymakers. But scratch at the surface of any of these publications and you find that there is considerably less to them than meets the eye.
The earliest paper in this series, by Peter Doran and Maggie Kendall Zimmerman of the University of Illinois, reported the results of an opinion poll of climate scientists that Zimmerman had prepared for her MSc thesis. The headline conclusion – that 97% of climatologists thought that mankind was having a significant impact on the climate – was widely reported at the time.
However, although the survey was sent to over 10,000 scientists, there were actually only 79 responses from climatologists, so the 97% figure represented just 75 individuals. [The Hockey Schtick broke this news here] And what was not reported in the paper or in any of the ensuing publicity was that many participants were appalled by the survey and recorded their feelings at the time, calling it simplistic and biased, and suggesting that it was an attempt to provide support for a predetermined view.
A second paper, by William Anderegg and colleagues, took a rather different approach, dividing scientists into those who were “convinced” and “unconvinced” by the reports of the Intergovernmental Panel on Climate Change (IPCC) and then assessing their relative numbers and their scientific credentials. It was observed at the time that the authors appeared to be trying to create a handy blacklist of scientists non gratae, and so their conclusions – that 97% of scientists were “convinced” and that their expertise was greater than that of their “unconvinced” colleagues – were unsurprising.
But again, the problems with the …
Reality Check: The ‘1000 year Colorado flood’ is actually a 25-50 year flood
Shocker: The “1000 year Colorado flood” is actually a 25-50 year flood
http://hockeyschtick.blogspot.com/2013/09/shocker-1000-year-colorado-flood-is.html
How Fantasy Becomes Fact
Reblogged from Dr. Roger Pielke, Jr. 9/19/13:
The flooding in Colorado has wreaked tremendous devastation, by one estimate the costs will total about $2 billion. Some people remain unaccounted for and it will be many months if not longer before the Front Range recovers. If you’d like to contribute to the recovery, please see this page with resources. As is often the case in the aftermath of extreme events and disasters, people look for some way to put them into a bigger perspective. With respect to floods, a common way of establishing this perspective is through the N-year flood, which is defined as a flood with 1/N probability of occurring in any given year. So the 100-year flood, used in floodplain regulations, is a flood with an expected 1% chance of occurring in any given year. Earlier this week, I presented some of my objections to the utility and meaningfulness of the concept of the N-year flood. In this post I show how the concept of the N-year flood can be used to turn fantasy into fact.In an article titled “The Science Behind Colorado’ Thousand-Year Flood” Time magazine explains:
Parts of Boulder are experiencing a 1-in-1,000 year flood. That doesn’t literally mean that the kind of rainfall seen over the past week only occurs once in a millennium. Rather, it means that a flood of this magnitude only has a 0.1% chance of happening in a given year.
Time is a fixture of the mainstream media and what is written there is widely read and repeated. A big problem with Time’s article is that Boulder did not actually experience a “1,000-year flood.” In fact, according to an analysis presented by fellow CU faculty member John Pitlick yesterday, using standard hydrological methods, Boulder experienced between a 25- and 50-year flood. (I am focusing here on Boulder, I have not seen similar analyses for other Colorado streamflows, though they are sure to come.) Pitlick further noted that the flood waters did not reach the 50-year mark on the Gilbert White memorial (seen at the top of this post.)
Pitlick walks us through maps of estimated inundation for 25-yr, 50 & 100 flood. Observations over recent days look more like 25-yr maps.— Laura Snider (@lauracsnider) September 18, 2013
How is it that the “1000-year flood” has …
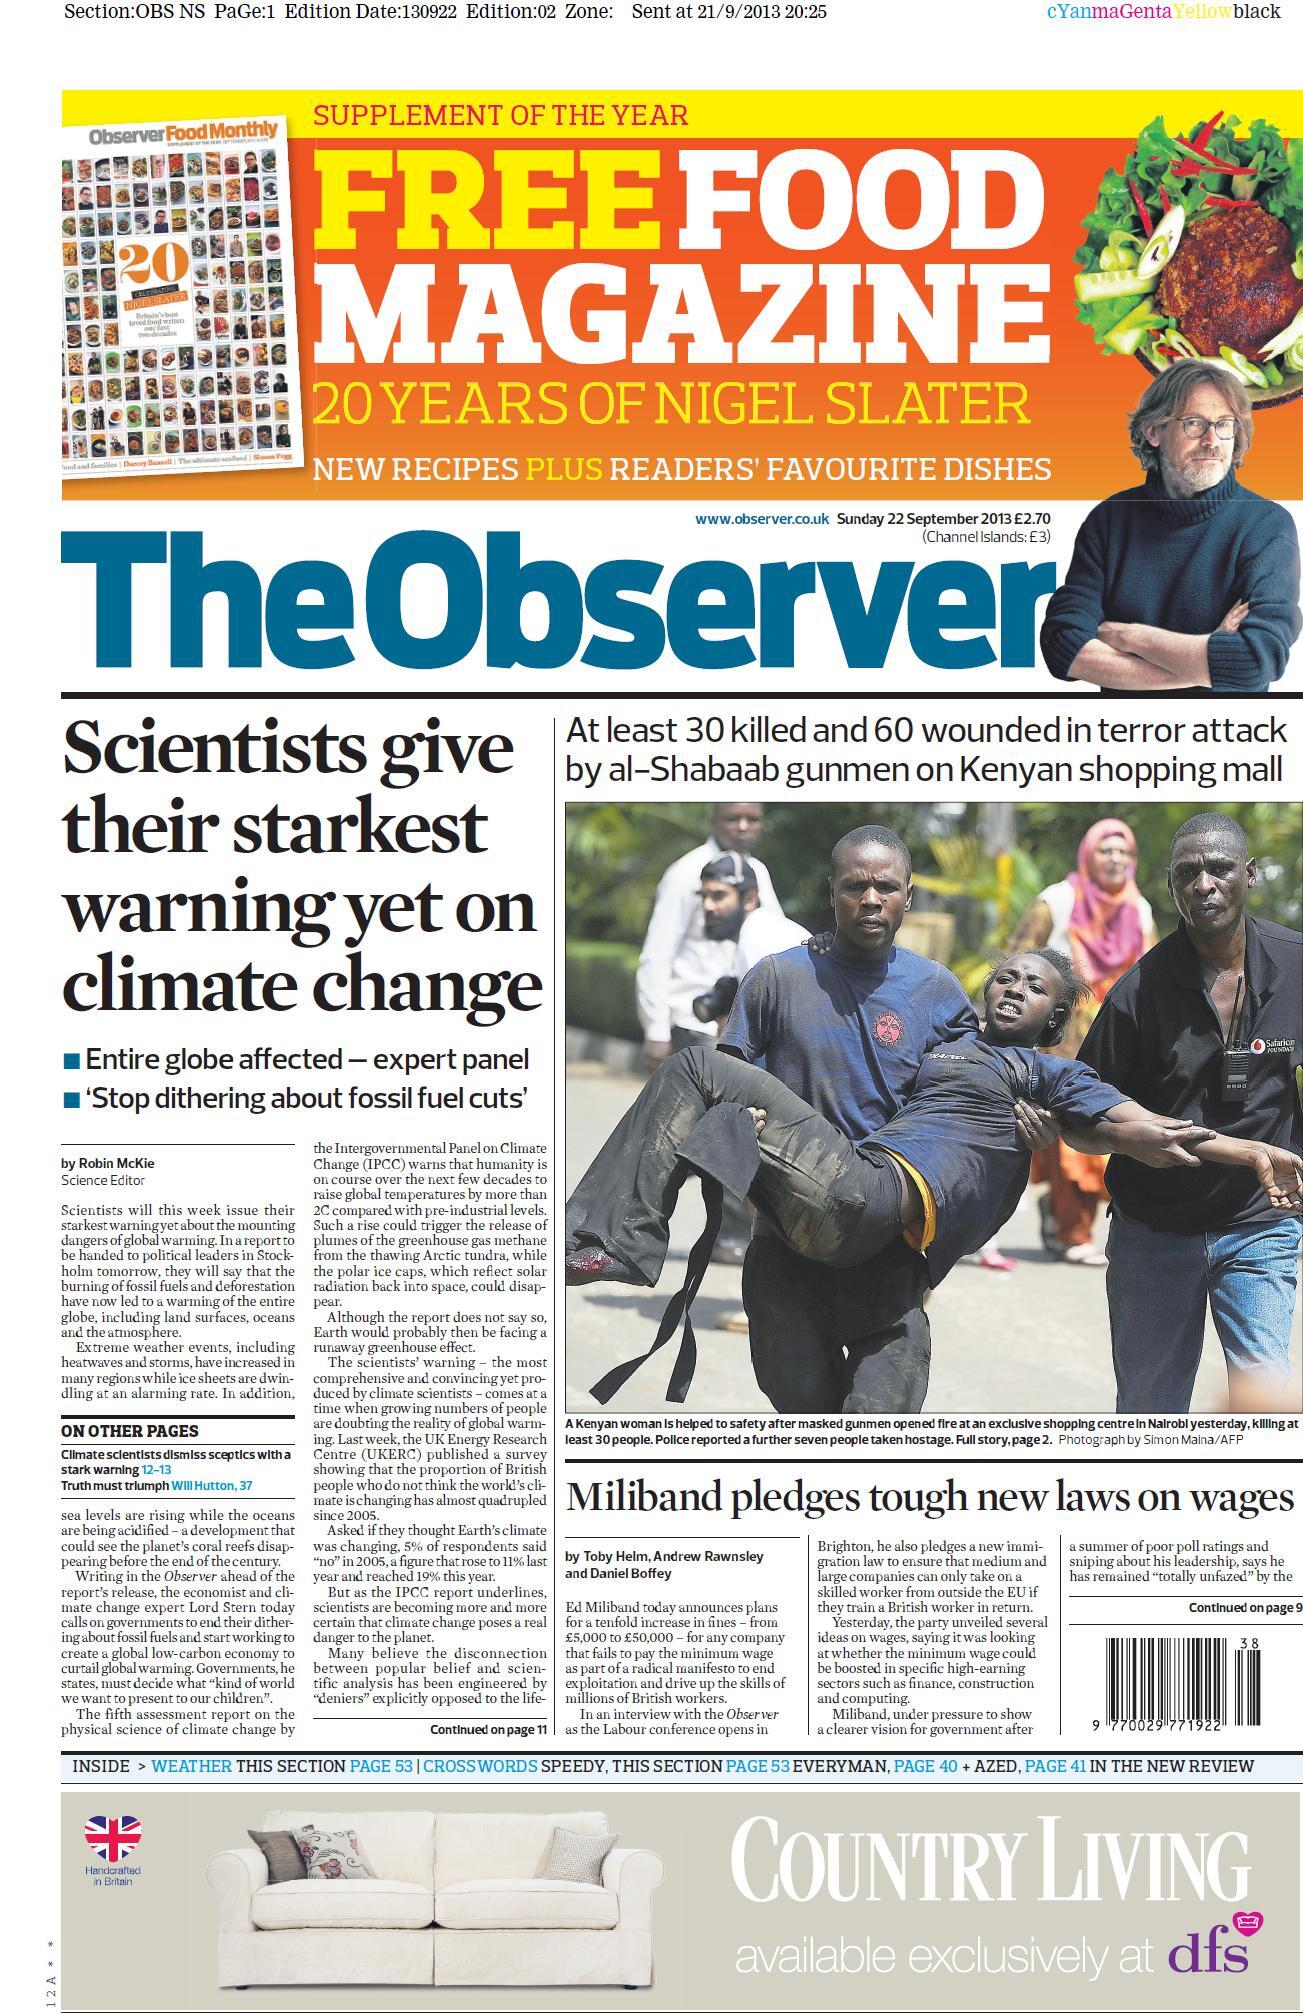
UK Guardian calls UN report ‘the most comprehensive and convincing yet’ — UN IPCC issues stark warning over global warming — ‘Call to ‘stop dithering about fossil fuel cuts’ as expert panel warns entire globe is affected’
 …
…
Claim: Global warming causing Antarctic ice to hit record level!
…CLIMATE STUDY: EVIDENCE LEANS AGAINST HUMAN-CAUSED GLOBAL WARMING — Group of 50 international scientists releases comprehensive new 1200-page report
Excerpt:
The report dismisses these claims with peer-reviewed evidence and concludes that “neither the rate nor the magnitude of the reported late twentieth century surface warming (1979–2000) lay outside normal natural variability,” “solar forcings of temperature change are likely more important than is currently recognized, and evidence is lacking that a 2° C increase in temperature (of whatever cause) would be globally harmful.”
“We conclude no unambiguous evidence exists for adverse changes to the global environment caused by human-related CO2 emissions,” the authors write. “In particular, the cryosphere is not melting at an enhanced rate; sea-level rise is not accelerating; no systematic changes have been documented in evaporation or rainfall or in the magnitude or intensity of extreme meteorological events; and an increased release of methane into the atmosphere from permafrost or sub-seabed gas hydrates is unlikely.”
The authors also note that “forward projections of solar cyclicity imply the next few decades may be marked by global cooling rather than warming, despite continuing CO2 emissions” and warn against using imperfect deterministic climate models to advocate for a “one size fits all” climate policy.
In light of these findings, which are “stated plainly and repeated in thousands of articles in the peer-reviewed literature” that are not “fringe,” the authors emphasize that policymakers “should resist pressure from lobby groups to silence scientists who question the authority of the IPCC to claim to speak for ‘climate science.'”…