
Danish Meteorological Institute Moves To Obscure Recent Record Greenland Ice Growth
German meteorological and climate site Schneefan (snow fan) here writes on the recent changes by the DMI on its Greenland ice mass chart. Personally I wouldn’t be surprised if this were in part due to climate data embarrassment.
Schneefan writes that the Danish Meteorological Institute (DMI) recently changed the reference period for showing the Greenland ice mass: from the warmer 1990-2013 to the internationally usual but colder WMO climate period of 1981-2010.
The change over to the WMO-recommended older and colder reference period has the effect of making the massive ice growth of the past two years with respect to the new mean look smaller, as the current comparison shows (lower chart).

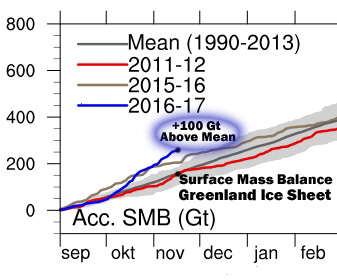
Top: The total daily contribution to the surface mass balance from the entire ice sheet (blue line, Gt/day). Bottom: The accumulated surface mass balance from September 1st to now (blue line, Gt) and the season 2011-12 (red) which had very high summer melt in Greenland. For comparison, the mean curve from the period 1981-2010 is shown (dark grey). The same calendar day in each of the 30 years (in the period 1981-2010) will have its own value. These differences from year to year are illustrated by the light grey band. For each calendar day, however, the lowest and highest values of the 30 years have been left out.“ Source: http://www.dmi.dk/surface-mass-budget/.
By changing the comparison period in April 2017 from 1990-2013 to the older and colder WMO 1981-2010 climate period, the mean shown by the gray line and shaded area is raised. This is illustrated by the thin black lines I’ve added to the two lower charts showing the old mean peak value. Using the 1990-2013 period, the mean peak value was about 550 gigatonnes.
Today using the older and colder WMO 1981-2010 the mean yearly peak rises to about 600 gigatonnes. As a result the current curve shown in blue the strong ice growth during September 2016 becomes less apparent. Moreover, the strong 2015/16 ice year year has been left out (brown curve in the old chart, left).
Foremost by leaving out the strong 2012 melt year (red curve in lower chart), which acted to significantly pull down the 1990-2013 ice mass, and by extending the chart out nine years into the colder past (from 1990 to 1981) the new 1981-1990 mean is considerably higher than the old
Arctic ice extent ‘nearly identical’ to recent years — While Greenland is blowing away all records for ice gain
Alarmists’ Arctic Nightmare Continues
While climate alarmists have been telling endless lies about record heat and melting in the Arctic and Greenland this winter, thick ice has been pushing into the East Siberian, Chukchi and Beaufort Seas – which determine the summer minimum extent.

Ice extent is nearly identical to all recent years.
Ocean and Ice Services | Danmarks Meteorologiske Institut
And Greenland is blowing away all records for ice gain.
Greenland Ice Growth Continues To Blow Away All Records
Greenland is blowing away all records for ice gain.
Greenland Ice Sheet Surface Mass Budget: DMI
This is what Greenland looked like a month ago. I didn’t see anything unraveling.
 …
…
Greenland Enters 2017 Adding Extraordinary Amounts Of Ice And Snow
…Media hyped ‘Heatwaves’ in Arctic have been occurring since 1930s
Heatwaves in the Arctic have been occurring for as long as people have been visiting there.
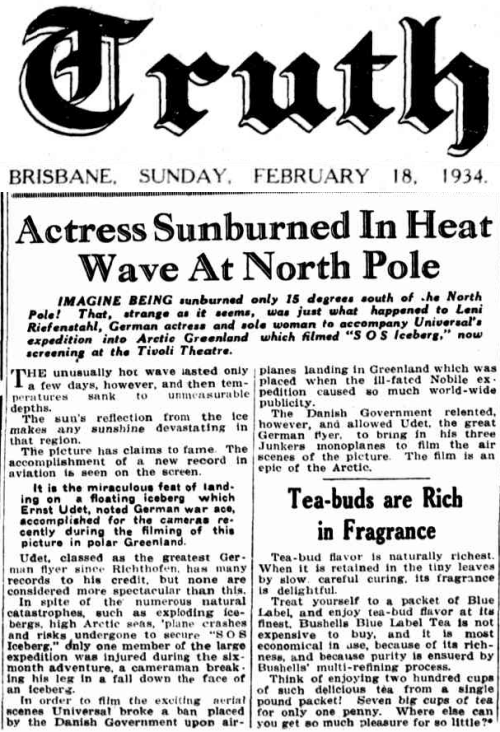
Actress Sunburned In Heat Wave At North Pole
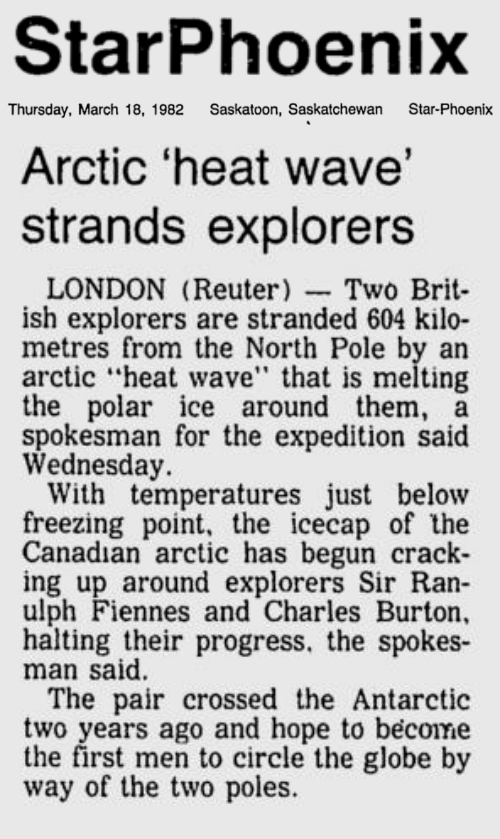
The Phoenix – Google News Archive Search
Ice at the pole is currently two meters thick, the same as it was in 1940.
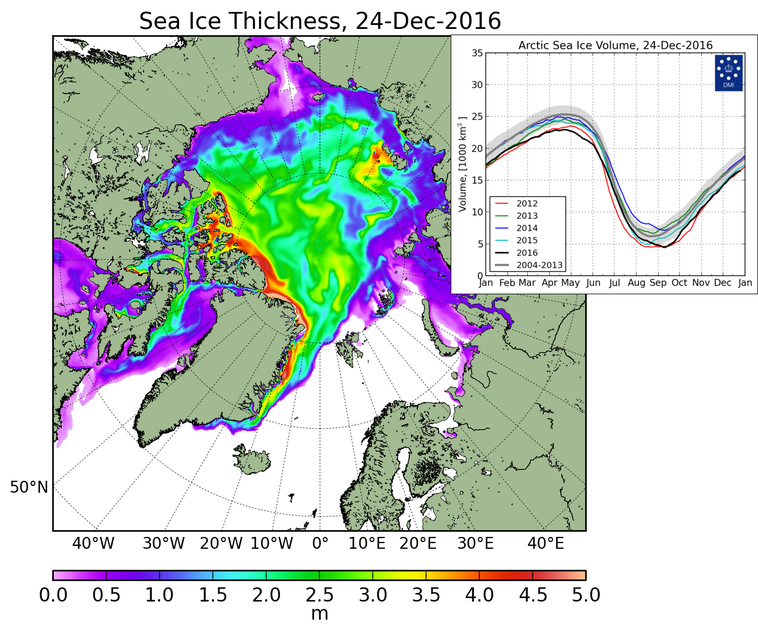
http://ocean.dmi.dk/arctic/icethickness/thk.uk.php
In 1940, the ice at the pole was also two meters thick.
The fake news press has been pulling this same Arctic scam for as long as anyone can remember. Arctic conditions are the same as they were 60 years ago, and they have been predicting an ice-free Arctic for as long as anyone can remember.
The Changing Face of the Arctic; The Changing Face of the Arctic – The New York Times
Actress Sunburned In Heat Wave At North Pole
The Phoenix – Google News Archive Search
Ice at the pole is currently two meters thick, the same as it was in 1940.
http://ocean.dmi.dk/arctic/icethickness/thk.uk.php
In 1940, the ice at the pole was also two meters thick.
The fake news press has been pulling this same Arctic scam for as long as anyone can remember. Arctic conditions are the same as they were 60 years ago, and they have been predicting an ice-free Arctic for as long as anyone can remember.
The Changing Face of the Arctic; The Changing Face of the Arctic – The New York Times…
Greenland’s Ice Well Above Normal – Now Much Colder With More Advanced Ice Sheet Margins Than 90% Of The Last 7,500 Years
Fifteen international scientists recently collaborated to assemble one of the most comprehensive analyses of temperature and ice sheet changes for Greenland and the Canadian Arctic ever produced. Briner et al., (2016) synthesized over 100 records from a large and accumulating database to publish “Holocene climate change in Arctic Canada and Greenland” in the journal Quaternary Science Reviews.
The results are not good news for those who wish to maintain that today’s Greenland Ice Sheet is losing ice area at an unprecedentedly accelerated rate, or that modern temperature values for the Arctic region are dangerously high. Greenland’s Ice Sheet has a larger ice extent now than it has had for most of the last 7,500 years; only the Little Ice Age period (~1300-1900 A.D.) had more ice mass. And both regions (Canadian Arctic and Greenland) are still 1 to 2°C colder now than they were just a few thousand years ago.
The Greenland Ice Sheet Is Now At Nearly Its Highest Extent In The Last 7,500 Years
In the climate alarmism world, the Greenland Ice Sheet has been cooperating with the ice-is-melting-faster-than-ever paradigm for decades. For headline-creators who warn of “ominous” and “catastrophic” rates of change — and how humans are to blame for most of it — the Greenland Ice Sheet has been losing mass at “unprecedented” rates since the 1990s. For example: The Greenland Ice Sheet is losing 110 million Olympic size swimming pools worth of water each year. … ‘The Arctic Is Unraveling,’ Scientists Conclude After Latest Sobering Climate Report – Unprecedented warming has sent the Arctic into uncharted territory, says latest NOAA report … Alert! Greenland’s Ice Now Melting At Catastrophic Speed
But what does “unprecedented” actually mean with regard to ice loss or temperature change in the Arctic? Effectively, precedence only extends back to the beginning of the 20th Century in most cases. Some may only extend precedence back to the 1961-1990 period, which is the baseline for nearly all surface mass balance estimates. So ice is said to be melting faster than any time since 1900, or since 1961-1990. But consider that in 1900, with centuries of solar minima and large-scale volcanic eruptions leading to plummeting Little Ice Age temperatures, the Greenland Ice Sheet had accumulated more
Greenland gaining ice at a record rate
Via:http://realclimatescience.com/2016/11/climate-genius-of-the-day-2/
Greenland is actually gaining ice at a record rate.
Greenland wasn’t always gaining a lot of ice like it is now. In 1939, the glaciers of Greenland and Norway were nearing “catastrophic collapse“

17 Dec 1939, Page 15 – Harrisburg Sunday Courier at Newspapers.com
#
By Kenneth Richard: Since September, the Greenland Ice Sheet surface mass balance has risen +100 Gt above the 1990-2013 average:
– See more at: http://notrickszone.com/2016/11/17/satellites-show-1-2-c-temperature-drop-since-early-2016-as-scientists-project-low-solar-activity-cooling-in-coming-decades/#sthash.zFTpptNd.dfF24zK6.dpuf
#…
Flashback 1939: Scientist warns of ‘catastrophic collapse’ of Greenland’s ice
…Defying Climate Models, Greenland Cooled By -1.5°C During 1940-1995 As Human CO2 Emissions Rates Rose 600%
By Kenneth Richard

Above image from Hanna et al., 2011 (Greenland Ice Sheet)
In 1942, eight U.S. WWII aircraft (2 bombers, 6 fighter planes) emergency-landed on the Southwestern coast of Greenland after encountering severe weather. The crews were rescued and the planes ultimately had to be abandoned at the landing site. So there the planes sat on the Greenland ice sheet, undetected, for more than 4 decades. The active search for the WWII planes had been ongoing since 1981, but it wasn’t until 1988 that a group of artifact enthusiasts (Greenland Expedition Society) were able to finally locate the planes. The primary reason why it was so excruciatingly difficult to find the planes is that the explorers had originally assumed the planes were buried under ice that was relatively close to the ice sheet’s surface. They weren’t. When the planes were finally found in 1988, 46 years after crash-landing on the Greenland ice sheet, they were buried under 260 feet (79 meters) of ice. In other words, between 1942 and 1988, the Greenland ice sheet gained mass at a rate of 57 feet (17 meters) per decade at that location. In 1992, the planes were impressively pulled out of the ice part-by -part. In that 4-year span between 1988 (discovery) and 1992 (recovery), the Greenland ice sheet had advanced with another 8 feet of ice, as the planes were 268 feet beneath the ice sheet surface when they were rescued.…