
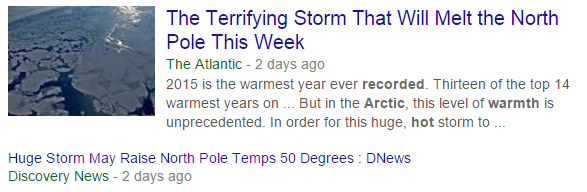
The Washington Post is hyping an Arctic storm ‘Frank’ for causing a spike in North Pole temperatures. See: “Freak storm pushes North Pole 50 degrees above normal to melting point”
But meteorologist Dr. Ryan Maue is countering the media hype that the storm currently hitting the Arctic is caused by mankind.
‘That’s utter bullshit,” Maue declared on December 29, in a response to the Washington Post’s claim that the Arctic event “reeks of a human-forced warming of the Earth’s climate.”

Maue added: “Who is feeding the media this crap?”

Meteorologist Joe Bastardi also weighed in, calling media reports of a melting Arctic, the “lunatic fringe.” Bastardi noted that before this storm, “Arctic temperatures are way below freezing.”

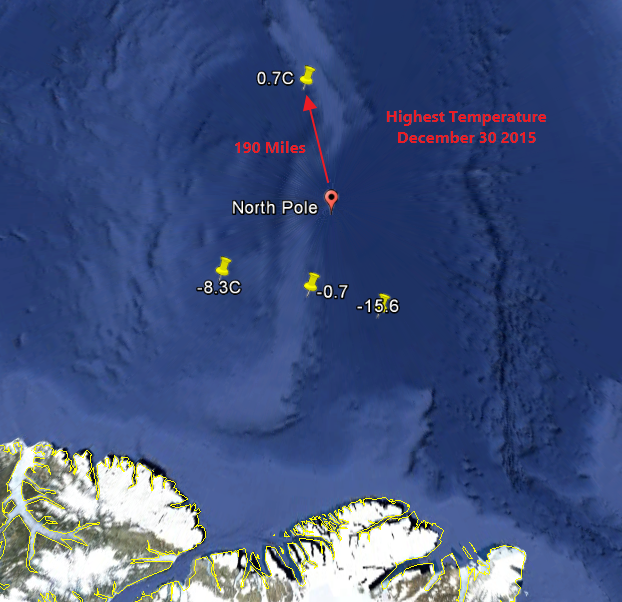
Bastardi also noted that the “data buoy” measuring temperatures in the Arctic was “more than two degrees south of the North Pole and is not representative of true temperatures. He noted that the Danish Meteorological site’s data was “much better and it showed that the Arctic “has been much warmer” in the past.

“Long standing DMI records(back to 1958) indicate the Arctic has been warmer in 1984, 1985, 2000 and 2002 . The Washington Post owes it to readers to show BEST data source,” Bastardi added.
The blog RealClimateScience.com noted today that Arctic sea ice extent was at a 10-year high, despite the media hyped storm.
“Earlier today, sea ice extent was at a 10 year high. But experts say it all melted during one hour at -1C this afternoon,” wrote Tony Heller at RealClimateScience.com, with more than a hint of sarcasm.
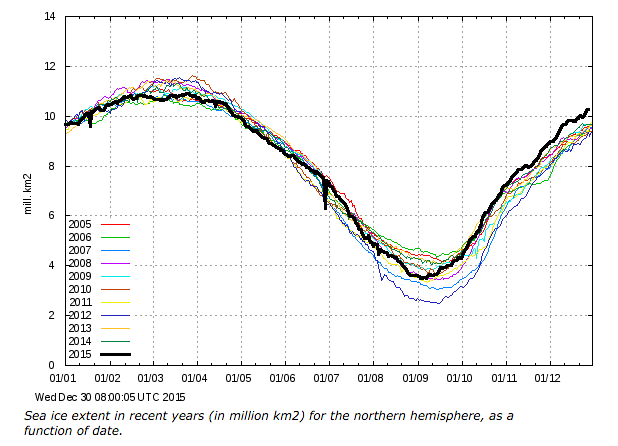
Heller also noted that “Arctic ice is screaming back towards 1990’s levels.”
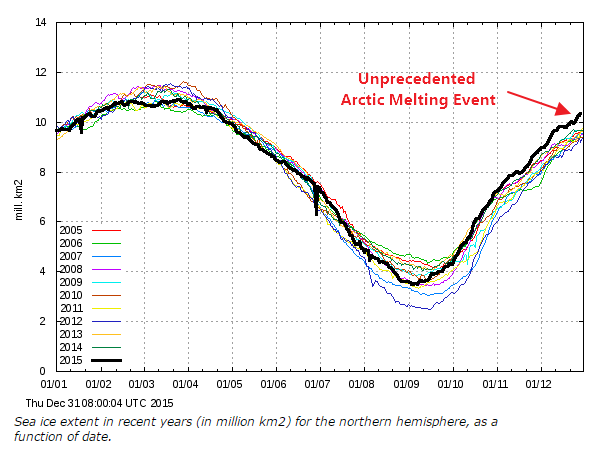
Update Dec. 31, 2015: RealClimateScience.com noted:
“Experts say that a terrifying storm melted the North Pole yesterday”
“This unprecedented melting event has caused Arctic ice to reach its highest December extent in over a decade.”
Ocean and Ice Services | Danmarks Meteorologiske Institut Note: DMI issued this this notice on above graph. “The plot above replaces an earlier sea ice extent plot, that was based on data with the coastal zones masked out. This coastal mask implied that the previous sea ice extent estimates were underestimated. The new plot displays absolute sea ice extent estimates. The old plot can still be viewed here for a while.”
“One buoy 300 km from the pole reported temperatures just above freezing for an hour yesterday. Another buoy a mile away did not report any above freezing temperatures.”
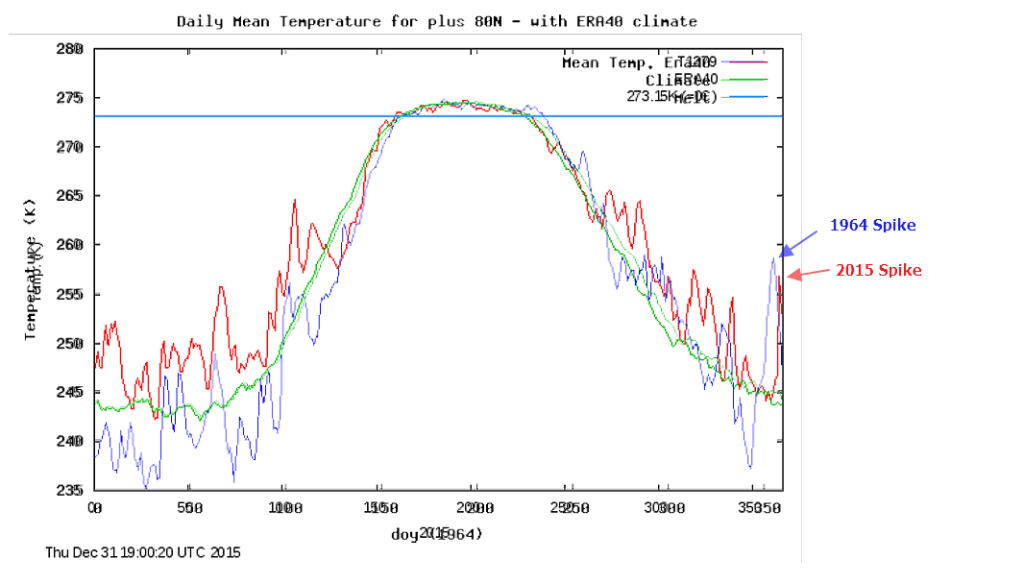
The current warm spike is not unprecedented. Arctic temperature data shows three cases of North Pole temperatures exceeding freezing since 1948.


RealClimateScience.com also noted: “A 1964 Arctic Temperature Spike Was Larger Than 2015 – And occurred during era of concern over ‘Global Cooling’
2015’s temperature spike in the Arctic was “at -20C was smaller than the 1964 ‘global cooling’ spike.”
Update: Journalistic Fraud: North Pole Region Saw Similar Warm Spikes Before…OVER 70 TIMES In Last 58 Years!
- ‘Only a small region near the North Pole saw a burst of warm southern air – lasting a few hours.’
- ‘The temperature in the Arctic above 80°N was estimated to have risen only some 13°K during the event, and not 30°K as the WAPO tried having its readers think.’
- ‘Since 1958 we see that a temperature spike of some 12°K or more in a matter of a few days during the November – March deep winter period occurred more than 70 times!’
- Also taking a look at the wild fluctuations seen in 1964, 1984, or 1990 – back when CO2 was at levels near the “safe” 350 ppm – we see they were far more extreme’
Despite the data, the media is continuing to hype the alleged “unprecedented” weather.
The Washington Post featured Weather Underground’s Jeff Masters explaining: “It’s really hard to scientifically say that’s what’s going on.” Masters added: “This isn’t the climate I grew up with,” he said. “We didn’t see this kind of weather in the 20th century.”
But the data clearly reveals that “extreme weather” has not increased, counter to Masters’ claim. See: PROF. ROGER PIELKE JR: TESTIMONY ON THE CURRENT STATE OF WEATHER EXTREMES: ‘It is misleading, and just plain incorrect, to claim that disasters associated with hurricanes, tornadoes, floods or droughts have increased on climate timescales either in the United States or globally’
Steve Milloy of JunkScience.com, mocked Masters claim: “It wasn’t the weather Jeff Masters grew up with? Well, isn’t weather always different by definition? And then, since he’s so into ‘climate change,’ why would he expect weather to be the same in a climate that is constantly changing? Besides… the Arctic has been this warm before… and sea ice is at a 10-year high.”
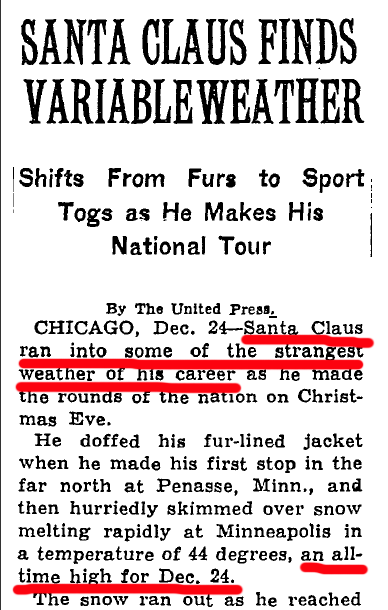
Unusual warmth at during the holidays is not unusual. Even in 1940, Santa had to deal with Christmas warmth. See:
Flashback 1940: NY Times: ‘Santa Claus ran into some of the strangest weather of his career’ as he flies through ‘all-time record high’ temps – From NYTimes, Dec. 25, 1940: Santa finds ‘strangest weather of his career’
Meanwhile, the Washington Post also attempted to link the UK floods to some sort of unprecedented weather. The Washing Post noted: “The U.K. Met office said that December has been a record-breaking month for rainfall in parts of the United Kingdom. A Christmas weekend storm brought up to 8 inches of addition rainfall on saturated soil.”
But the media has failed to note that the current floods in the UK are nothing unusual in the historical record. See: Historic Weather Records Rubbish UK PM Cameron’s Attempts To Blame Floods On ‘Global Warming’
Related Links:
PROF. ROGER PIELKE JR: TESTIMONY ON THE CURRENT STATE OF WEATHER EXTREMES: ‘It is misleading, and just plain incorrect, to claim that disasters associated with hurricanes, tornadoes, floods or droughts have increased on climate timescales either in the United States or globally’ – Link to full testimony of Roger Pielke Jr. to Congress: ‘It is further incorrect to associate the increasing costs of disasters with the emission of greenhouse gases’
Globally, weather-related losses ($) have not increased since 1990 as a proportion of GDP (they have actually decreased by about 25%) and insured catastrophe losses have not increased as a proportion of GDP since 1960.
• Hurricanes have not increased in the US in frequency, intensity or normalized damage since at least 1900. The same holds for tropical cyclones globally since at least 1970 (when data allows for a global perspective).
• Floods have not increased in the US in frequency or intensity since at least 1950. Flood losses as a percentage of US GDP have dropped by about 75% since 1940.
• Tornadoes have not increased in frequency, intensity or normalized damage since 1950, and there is some evidence to suggest that they have actually declined.
• Drought has “for the most part, become shorter, less frequent, and cover a smaller portion of the U. S. over the last century.” Globally, “there has been little change in drought over the past 60 years.”
• The absolute costs of disasters will increase significantly in coming years due to greater wealth and populations in locations exposed to extremes. Consequent, disasters will continue to be an important focus of policy, irrespective of the exact future course of climate change.’
Prof. Roger Pielke Jr. slams NOAA For Claims of Increasing Extreme Weather: ‘In the US on climate time scales there is no evidence for more hurricanes, floods, tornadoes, drought. Happy to debate this topic with data’ – Pielke Jr. : ‘How can a NOAA spokesdude get away with telling USA Today that droughts are increasing when USGCRP, IPCC and peer reviewed research sez no?’


353 Responses
There is a sickness going around that blames almost all natural events on human activity. Witch doctors have done this since antiquity so it is depressing how low the collective IQ of the world has sunk – In many quarters “Idiocracy” has arrived, and it will only get worse.
Liberal Journalists are just Trolling America…..
3% of Americans care about Alarmist Fearmongering……
Liberal Journalists are very arrogant, stubborn, insecure, and neurotic…..
They know most Americans don’t suffer from their Climate OCD Neuroses……
But, they just can’t let it go……
It’s a Compulsion…..
Ha!!
They are forced to Troll…..
When most of your advertising $$$ comes from government you have to stick to the narrative or go out of business. Media Welfare = Propaganda.
NSIDC to “adjust” algorithm calculating arctic ice extent in 3, 2, 1…..
NSIDC already show 2015 at almost an all time low. The chart shown in this article masks out a lot of relevant information – ie. the coastal zones, and shows an incorrect value for 2015.
“NSIDC already show 2015 at almost an all time low.” “Almost,” really? Now who is masking a lot relevant information?
http://nsidc.org/arcticseaicenews/charctic-interactive-sea-ice-graph/
Play with the NSIDC charts and tell me which “all time low” you are referring to, because NSDIC only covers from 1979 on….that’s only 35 years of “all time”.
These warmists are truly silly people since there have been times during the current inter-glacial period of little to no summer ice.
Yet Polar Bears are with us today and the world didn’t end either.
For much of the Inter-glacial period,the world was warmer than it is now.
All large Atlantic depressions are capable of pushing warm air into the Arctic Circle via Spitzbergen in just such a way. All that has happened is that we now have pretty graphics to display it on big TVs. The strongest Atlantic depressions are during colder spells such as the Little Ice Age as 17th century ships logs make entirely clear. Just because it is unfamiliar to the author does not make it unprecedented or even unusual, silly boy 🙂
Remember that Socialist only win when they lie.
A few days ago new McLaren F1 subsequent after earning 18,512$,,,this was my previous month’s paycheck ,and-a little over, 17k$ Last month ..3-5 h/r of work a day with extra open doors & weekly paychecks. it’s realy the easiest work I have ever Do. I Joined This 7 months ago and now making over 87$, p/h.Learn More right Here
bk..
➤➤
➤➤➤ http://GlobalSuperEmploymentVacanciesReportsJobs/GetPaid/98$hourly…❦.❦.❦.❦.❦.❦.❦.❦.❦.❦.❦.❦.❦.❦.❦.❦.❦.❦.❦.❦.❦.❦.❦.❦.❦.❦.❦.❦.❦.❦.❦.❦.❦.❦.❦.❦.❦.❦
SPAM!
A few days ago new McLaren F1 subsequent after earning 18,512$,,,this was my previous month’s paycheck ,and-a little over, 17k$ Last month ..3-5 h/r of work a day ..with extra open doors & weekly paychecks.. it’s realy the easiest work I have ever Do.. I Joined This 7 months ago and now making over 87$, p/h.Learn More right Here
hmn…..
➤➤
➤➤➤ http://GlobalSuperEmploymentVacanciesReportsHigh/GetPaid/98$hourly…❦.❦.❦.❦.❦.❦.❦.❦.❦.❦.❦.❦.❦.❦.❦.❦.❦.❦.❦.❦.❦.❦.❦.❦.❦.❦.❦.❦.❦.❦.❦.❦.❦.❦.❦.❦.❦.❦
A few days ago new McLaren F1 subsequent after earning 18,512$,,,this was my previous month’s paycheck ,and-a little over, 17k$ Last month ..3-5 h/r of work a day ..with extra open doors & weekly paychecks.. it’s realy the easiest work I have ever Do.. I Joined This 7 months ago and now making over 87$, p/h.Learn More right Here
4exr……
➤➤
➤➤➤ http://GlobalSuperEmploymentVacanciesReportsHot/GetPaid/98$hourly…❦.❦.❦.❦.❦.❦.❦.❦.❦.❦.❦.❦.❦.❦.❦.❦.❦.❦.❦.❦.❦.❦.❦.❦.❦.❦.❦.❦.❦.❦.❦.❦.❦.❦.❦.❦.❦.❦
Our politicians believe this global warmist crud, Cameron will knight him like the buffoon Davey.
The Arctic sea ice chart shown above is wrong. It excludes coastal areas. See: http://ocean.dmi.dk/arctic/icecover.uk.php
See also: http://nsidc.org/data/seaice_index/images/daily_images/N_stddev_timeseries.png
The chart presented represents 30% sea ice extent. Don’t know how you think but I think 30% is twice as significant as 15%
Go to the link for the Danish 30% chart. They explain the error.
It’s not an error; it’s just another valid calculated stat! It just shows a coastal masked sea-ice cover stat you might not want to acknowledge. In that stat, 2015 ice is materially higher than the previous 10 years. Calling it an “error” betrays your warming bias, and a gotcha prejudice.
It was not presented as such here. There are a lot of ups and downs in any climate data set. But the overall trend for northern sea ice extent and volume is in decline. And notice the note under the newer plot:
“The plot above replaces an earlier sea ice extent plot, that was based on data with the coastal zones masked out. This coastal mask implied that the previous sea ice extent estimates were underestimated. The new plot displays absolute sea ice extent estimates. The old plot can still be viewed here for a while.”
Of course I saw the note (& saved the page); it was factored into my question. Even with “a lot of ups and downs of any climate data set,” (thank you for acknowledging that often unacknowledged fact), and even with “… headline grabbing catastrophic results? I for one am shocked that in DEC’15, the massive area of NH
non-coastal sea ice extent isn’t at some sort of minimum — aren’t you?” After all, DEC’15 is materially higher than the last 10 years for that stat?
And I suppose you are shocked that coastal ice is low, no? Lot’s of factors influence sea ice extent, for example wind and ocean currents. Ocean temps probably play a bigger role than air temps. But it is clear that NH sea and land ice, in extent and volume, have been declining for several decades.
Repetitive and evasive of my question — of course after an arctic temp spike raising North Pole temps, very low coastal ice might be observed without me, or for that matter, most being “shocked!”
If it stays there, it’s problematic … if not, it isn’t.
I’m betting it won’t.
Stochastic fluctuations do not seem usual tome. NH sea and land ice, in extent and volume, have been declining for several decades. Does that fact concern you?
Should it be concerning for a globe in an interglacial period coming out of a little ice age? What should the globe be doing differently?
You are entitled to your fantasies.
Of course I am! I have a ridiculous fantasy where everytime I ask someone a direct question, I get a direct answer.
Maybe if you bother to look at the ENTIRE Holocene, you will quickly realize your faux concern is absurd.
There have been various times in the inter-glacial that there was little to NO summer ice in the region.
The current ice cap is larger than average for the inter-glacial.
It is difficult to know ice cover extent in past centuries. However, proxy study evidence supports the conclusion that the Arctic Ocean has had continual ice cover for the last 5000 or 6000 years.
http://www.livescience.com/10678-arctic-sea-ice-lowest-point-thousands-years.html
Before that, 6000 to 10000 years ago, there were some periods with ice free summers. These have been attributed to natural changes in Earths orbit.
http://www.sciencedirect.com/science/article/pii/S0277379113004162?np=y
The current warming can only be explained by the increase in greenhouse gases.
The Holocene period started 11,500+ years ago, and continues up to today.
Thus ALL of the things you just said are covered by the “ENTIRE Holocene”.
Thus your citations prove that you agree with Thomas Peterson’s comment that there been times in this current inter-glacial period (known as the Holocene) in which the Arctic has experienced “little to NO summer ice”.
How is what may or may not be causing the current warming relevant to what caused the past warming, other than there was warming?
I did not say Peterson was incorrect. I just added some context.
You’re right. But Dano2 is the one who appeared to need “context”, not Thomas Pearson.
I needed no context. You made that up.
Best,
D
I’m sure I also made up your earlier request for citations (or context) from Thomas Pearson since it no longer exists.
request for citations…from Thomas Pearson since it no longer exists..
Nothing has been deleted. It is still there. You made that up too.
Best,
D
It is no longer visible ABOVE these comments. You really are a weasel.
There have been various times in the inter-glacial that there was little to NO summer ice in the region.
[citation needed]
Best,
D
LOL head up ass very far yet you make me laugh
Smart people would provide a citation, LOLO.
Best,
D
It’s amazing that he manages to get it even further up there all the time!:)
You can’t provide a citation either, apparently. Precious.
Best,
D
You are your own citation.
Weak flail to try and hide failure.
Best,
D
ROFL!!! Disqus allows you to completely remove a prior comment without a trace of any kind, by simply editing it into nothingness. And Climate Depot doesn’t indicate “comment removed” or “comment deleted” unless Climate Depot is responsible for the removal or deletion. SO…poof….you removed a prior comment, without a trace, from it’s former chronological position here on Climate Depot.
But alas, Disqus WILL NOT allow you to remove a post, without a trace, and then put it BACK in it’s former chronological order, later. Poor baby!
You tried to make me look like I “made something up” by removing the post I was referring to. Had I been forced to try to prove that, at most, all I could have used to support my conclusion that you did it because you are an evil liar, would have been my own personal assumptions and opinion. But when I pointed out that your comment had disappeared, instead of just being a an evil liar and saying “see…you made it up”….YOU did something that no only proves to everyone here that are ARE in fact, an evil liar, but it also PROVES that you are a STUPID, as well as evil, liar.
You claimed that “Nothing has been deleted. You made that up too.”
Bravo Dano2! You gave me the best belated Christmas Gift ever….EVIDENCE that proves you are a stupid, evil liar so I no longer have to rely on flimsy premises like my personal opinion and assumptions when I put forward that conclusion. Best!
I haven’t removed any prior comment made by me or you.
Check your dosage.
Best,
D
But notice that Lise_Belise and Thomas Pearson are apparently the same person.
Excuse me, based upon WHAT evidence? LOLOL
ooooooOOOOOOOHHHHHHHHH…….
Hmmmmm….hmmm….
Best,
D
Keep going liar. The little caption beside your name and who it’s to, indicates it that you just re-posted a comment that you CLAIM still exists on this thread. But the re-post is the ONLY time that comment actually appears here. You can never put that comment BACK into the chronology where it was. So claiming it’s still there can always be disproven by anyone who glances up at the time frame that matches the time stamp on it.
Or are you trying to insinuate that you CAN still see it up there….so it must still appear to be up there to everyone else? Because it’s not up there anymore….to anyone else. Literally, there is NO POST addressed to Thomas Pearson from you “two days ago” anywhere in this thread EXCEPT where you posted it UNDER a comment I made ONE day ago.
Have someone check your dosage.
Best,
D
You might say “Do you consider it unusual that the area in which the concentration of Arctic sea ice is over 30% is higher than it has been in relation to the area in which sea ice concentration is less than 30% for the last ten years?”
Of area around the coast, the ice concentration is between 15 and 30%. Areas off the coast, the ice concentration is roughly 30% and above. Does that mean that ocean temps are lower off shore and warmer on shore? Does that mean that air temps offshore are colder than onshore? What can we, and can’t we, logically assume about the differences between the shore ice and the offshore ice without comparing all of the variables involved?
The first (Danish) chart-the one with the mask- shows 2015-2016 levels at 10.25 km2.
The second (Danish) chart-the one without the mask shows 2015-2016 levels at 13.75 km2
(link-http://ocean.dmi.dk/arctic/icecover.uk.php)
The one you posted from NSIDC shows the 2015-2016 total at -12.25 km2.
None of the charts are “wrong”, and the first two charts are of different measurements of the same area-one with a mask applied, and one without that mask applied.
The first Danish chart (with the mask) actually showed the past ten years on it-from 2005-2015, and the way that chart was presented here was under the joking caption of “This unprecedented melting event has caused Arctic ice to reach its highest December extent in over a decade.” Since neither the updated, unmasked chart, nor the one Mike435 posted, show all of the past ten years, Mike has yet to prove that how the first graph was presented here is “wrong”.
The caption given here does not mention that coastal data was excluded. The caption says: “Sea ice extent in recent years (in million km2) for the northern hemisphere, as a function of date.” Marc Morano left out the next line that says: “Please notice, that the sea ice extent in this plot is calculated with the coastal zones masked out. To see the absolute extent, go to this page.” This may well be an honest error. Perhaps Morano will post a correction when he recovers from New Year’s Eve. 😉
It’s not Marc’s caption. The caption is from the danish site. It is not Marc’s fault that the coastal data on that chart was excluded. Marc is also not responsible for the red lettering or arrow. He linked to a chart from realclimatescience.com Marc ALSO included a link to the actual chart on the danish site AND anyone who checks the chart will see the “new” chart. Note that the authors of both charts says- “This coastal mask implied that the previous sea ice extent estimates were underestimated.” That the coastal mask IMPLIED that the previous sea ice extent estimates were underestimated DOES NOT EQUATE with the previous ice extent estimates WERE WRONG.
All this means that the chart itself was CORRECT. BOTH TIMES. That the coastal zones were masked out has ZERO affect on the fact that the chart shows that the concentration of sea ice (higher than 30% in the Arctic) was higher at the end of 2015 than it has been in the past ten years.
Its not Marc’s chart, or his error, or his problem.
Morano is responsible for what he posts on his blog. Perhaps the Danish site added the correction after Morano posted this. Nonetheless, the chart with the caption given is incorrect. I merely pointed this out.
Maybe I should be more direct.
Before the charts in question, Marc introduces the fact that hes reporting on what Tony Heller posted on his blog at realclimatescience.com
Marc uses QUOTATION MARKS to indicate when he’s quoting what Tony said. (Meaning its not Marc’s caption) You must have MISSED the fact that the caption you are NOW complaining about has quotation marks around it. Those little marks indicated that TONY is the one responsible for the caption that claims-
“This unprecedented melting event has caused Arctic ice to reach its highest December extent in over a decade.”
The one beneath the graph was placed there by the Danish researchers and unless you want to attempt to prove that they mislabeled their own chart, I’m going with the assumption that they labeled it exactly as they wanted to, and as it is written, it doesn’t make “the chart with this caption” wrong or incorrect in any way. Again, the chart is correct., How they created the chart is correct. If you personally assumed that the chart in question DID measure and cover “absolute sea ice extent” or “15% and up sea ice extent” in the Arctic, then based on the details that have always existed on the Danish website AS WELL AS the “please see” note on the Danish website, YOU ARE WRONG.
PLEASE NOTE- neither Tony nor Marc added the word “absolute” to the chart, nor did they add anything about 15% and up, and the link THEY FREELY POSTED demonstrates that the makers of the chart never even meant to IMPLY that their chart represented “absolute sea ice extent” or “sea ice extent 15% and above”.
SO, based on the actual physical evidence (facts), your conclusions aren’t based on solid premises. The only question left is-did you INTEND to reach those mistaken conclusions when you started or did that happen by mistake?
Morano is responsible for what he posts on his blog.
He’s under no obligation to babysit readers to make sure they understand exactly what was posted, why it was posted, and what his motives were when he posted it.
YOU are responsible for what YOU posted here.
I do not require babysitting. I just pointed out a mistake. It is you who have gotten your panties in a knot. Do some breathing exercises and try to relax.
Morano has now updated his post to correct the issue I pointed out.
And? It proves the man isn’t a lying cherry picker right? He left the chart there, and it’s still a correct chart. The note doesn’t change that.
It points out he can’t speak to the issue.
Best,
D
You never do.
Another weak dishonest from this sockpuppet. I sense a pattern….
Best,
D
Are you really that ignorant of trend analysis or are you just trolling? If the chart measures the same thing over 10 years, it doesn’t really matter what is blanked out since it will blank out the exact same thing on every single year. So as a measurement of the trend of coverage, how it is being used in the post, it would be perfectly valid even if it overestimates or underestimates the actual coverage. It is a Measure of Performance, it doesn’t actually directly measure anything, but is does show trends. To paraphrase a former US president, “It’s the trend, Stupid!”
NH sea and land ice, in extent and volume, have been declining for several decades.
“NH sea and land ice, in extent and volume, have been declining for several decades.”
And even if true, this is a problem why? … and secondly, what do you think you can do about it?
You can start with these.
http://www.amap.no/arctic-climate-impact-assessment-acia
http://climate.nasa.gov/resources/education/pbs_modules/lesson2Overview/
What to do? Obviously, we should be reduce net CO2 emissions. So, I support nuclear power and reforestation projects.
Albedo, stop emitting carbon.
Are these trick questions? My 7th-grader can answer.
Best,
D
And this year is the highest recorded in a decade, your point is? For that matter, the sea ice extent was both more and less is the fairly recent past and at times was increasing and decreasing during the same time frame, So? 1944 was the last time the Northwest Passage was open, was that caused by Global warming? This year the ice extent is clearly higher, using the methodology of the chart, than in any of the years recorded on the chart, which was the point of the post.
See pages 83-97 of …
http://cradpdf.drdc-rddc.gc.ca/PDFS/unc103/p534120_A1b.pdf
or the graphic here: http://www.skepticalscience.com/images/Transits.png
you seem to be missing around 6 years of data again with you graph
Exactly, since 1979. That’s several decades.
No.
http://nsidc.org/arcticseaicenews/files/2014/04/Figure3.png
So you don’t think that above 15% also includes the 30% regions?
You’re thinking is broken.
The 1st chart showed JUST the areas in which the “ice concentration is higher than 30%”. The “new” chart shows all areas in which the ice concentration is higher than 15%.
Are areas in which there is only 15% ice equal to areas in which there is 30%? Of course not. Drawing a bigger circle that measures “absolute ice extent” does not make the amount of ice in each area equal.
You’re absolutely right. A cherrypicked chart – just lucky that to find one that was wrong, so they could support their ridiculous case.
Mike,your 15% sea ice chart is less accurate than the other chart which is for the 30% sea ice coverage.
DMI is more accurate.
They are just using different measures. Both show the NH sea ice is not at a ten year maximum.
Sorry Brain dead LIES just don’t cut it nomore people have wised up Loser
Winners provide evidence to show lies. Lemme guess: you won’t be providing us any evidence, amirite?
Best,
d
Try the 30% graph and stop dicking around loser
Winners produce their own graphs to make their point. Are you a winner?
Best,
D
The Arctic sea ice chart shown above is wrong. It excludes coastal areas. See: http://ocean.dmi.dk/arctic/icecover.uk.php
See also: http://nsidc.org/data/seaice_index/images/daily_images/N_stddev_timeseries.png
If they followed the cold as much as they followed the heat, we wouldn’t be talking about climate change. That cold air that was displaced went somewhere – why don’t they go chase that for a change?
The Paris Climate Agreement abolishes all forms of climate change, extreme weather events, and rising sea levels for now and for all time. It is a done deal and we here in the USA do not have to pay anything for it because we are a poor nation with a large national debt, trade deficit, and unfunded liabilities. Climate change no longer exists so it should be of no concern to us any more. Human caused climate change cannot possible be the cause of anything because human caused climate change has been abolished for now and for all time.
The Atlantic changed the title of that story! It was “The Terrifying Storm That Will Melt the North Pole This Week” and now it says “The Terrifying Storm that will Unfreeze the North Pole”.
The Washington Compost owned and operated by man-child Jeff Bezos, idiot savant, indoctrinated Marxist Harvard graduate. He’s destroying the very country that allowed him his fortune, and now his actions weaken and will eventually destroy the country and its native people.
He got this virus from the long line of Jews and their sickness to destroy societies, take them over so they can own and control everything.
Good job, Jeff. When it all collapses, you will not be spared.
Meanwhile Arctic sea ice extent is currently at a 10 year high
Nope. Big fibbin.
Best,
D
https://uploads.disquscdn.com/images/ecbf6c99fdbae2697326c229f3a465b135e96e5ced8247830e284b81df818c9b.png https://uploads.disquscdn.com/images/d7cfaaca2daa03f569b8589a9cdb912f902caff543eae52324208f000fd3cc02.jpg https://uploads.disquscdn.com/images/7205fadea80a8e4f7a1173f233fa175ef7d19e8e0dd0295f6f6e4a5712a7ace8.jpg
http://nsidc.org/arcticseaicenews/charctic-interactive-sea-ice-graph/
Hey Dano. Happy New Year. See the comment on the link to the Danish site or my comment earlier.
Happy new year, Mike. Thank you,
Best,
D
Dan0? Mike435, really? My respectometer just plummeted – little/no phy-sci background, NO THERMODYNAMICS study at all! A train-wreck of bad info epoxied together in dogma, w/ years of posts in evidence of same. I guess that begins to explain a lot…
Forget what I said about, “let’s think of this another way.”
Happy New Year to you too Jim. Don’t take any wooden swift boats. 😉
Weak-minded thinking by you – I was a weatherman in the USAF and studied bioclimatology before switching to the plant side. Typical denialist.
Best
D
Really three graphs 2 stop before the end of the year and the other that stops years before (FAIL try again with up to date graphs)
Try to produce your own graphs to make your point.
Best,
D
I just asked why all your graphs are so old don’t they make new ones ?
If you have newer ones from those sources, post them.
Best,
D
There linked in the article moron.
Thanks smartie, the charts I posted are the latest from those sources. Following the links in the article moron will get you to January 2015. Ouch.
Best,
D
They are the latest with only 5 years of history moron.
Thanks smartie, the charts depict clearly that Arctic ice is not in recovery.
A sixth-grader can see it.
Best,
D
Your charts only show 5 years… The DMI one shows a lot more…. No ice loss… the Earth isn’t warming. You are a satellite data denier.
Let us know when you get to sixth-grade chart reading.
Best,
D
You’re the one that thinks 2015 is the hottest… and you are clearly wrong… You are the one who can’t read a chart.
Sorry 4 years.
DMI has a longer history measuring using the same measuring stick…
You’re an idiot.
Thanks, smartie-smart. You whined about wanting newer graphs, admonished me to follow the link in the article, and comically were unable to see the graphs in the article are a year old.
Aren’t you precious?
Best,
d
They aren’t a year old unless you consider December 2015 to be a year old…. You’re the king of morons.
It’s linked in the article… is your mouse diabled?
Try to look at the charts and see if you can understand there is a difference and following the links will get you an older chart than what I showed.
Can you grasp it?
Best,
D
I have… You’re as dumb as 3 year old if you can’t see it.
Thanks, smartie-smart. Those charts are not newer than mine.
Can you grasp the concept of not newer?
best,
D
Your charts only show 5 years of data… they are a from a different source… they are measuring different things.. But the DMI data is updated daily… Your data is just as new as the one posted in the article… And you are too stupid to understand that…
YOu don’t even have 10 years worth of data there moron.
But you can tell the Danes there morons if you want to.
Thanks smartie! All you need to do is show any previous year was higher than 2015 to show big fibbin!
Can you grasp the concept?
Best,
d
It is… That’s what UAH and RSS temperature shows… 2010 was still hotter… FYI.. that means we’re cooling… Because this is an el Nino year. You fail…. and you’re the worst.
Thanks, smartie smart! We’re talking about ice! Can you understand the topic?
best,
D
No. Actually we are talking about science… which involves data… And temperature data plays a role… and your graphs only showed a few years worth of data… Where was the data from 2005? Loooser.
Ice, smartie. Can you grasp that the chart refutes the assertion Meanwhile Arctic sea ice extent is currently at a 10 year high
Can you understand it? Can you read a graph? Can you grasp simple graphs?
Best,
D
But the other DMI chart shows it is correct.
http://ocean.dmi.dk/arctic/old_icecover.uk.php
And there’s 10 years of data … not just 4.
The DMI chart measures much less ice.
Thanks!
Best,
D
Not the one I posted… Learn how to read a chart.
Not the one using the old method.
You can’t show it is true.
Best,
D
I posted the link. Already done.
You are incapable of grasping it. Got it.
Best,
D
I grasped it just fine…. More sea ice than 10 years ago when coastal areas are included..
Not capable of understanding. Got it.
best,
D
You shouldn’t talk so negatively about yourself…
Your incapable of grasping your chart only shows 4 years worth of data and not 10.
Smart people can tell my graph was sufficient to refute the assertion. What’s your excuse?
Best,
D
You wouldn’t know a smart person if he bit you on the nose.
Smartie was refuted.
Best,
D
You’re not smartie… don’t know what you’re talking about.
And your facebook link was awesome… More science in the comments section from “deniers” than on the page itself. You Climastrologists don’t know anything more than what you are told can’t think for yourselves.
Oopsie!
‘That’s utter bullshit,” meteorologist Dr. Ryan Maue declared on December 29, in a response to the Washington Post’s claim that the Arctic event “reeks of a human-forced warming of the Earth’s climate.” Maue added: “Who is feeding the media this crap?”
Morano made that up. WaPo didn’t state that.
Caught fibbin!
Best,
D
That is funny. The Wash Po article Maue links too actually criticizes that claim.
“Scribbler [environmental blogger Robert Scribbler] says such an anomaly “reeks of a human-forced warming of the Earth’s climate”, although some climate scientists aren’t convinced global warming is meaningfully impacting these types of storms.”
https://www.washingtonpost.com/news/capital-weather-gang/wp/2015/12/28/freak-storm-in-north-atlantic-may-push-temperatures-70-degrees-above-normal-at-north-pole/
Liberal Alarmists in the Media……
…are no different than 6 Day Creationists or Intelligent Designers……
You could explain all the Science to them that is contrary to their Climate Religious Beliefs…..
…and they won’t be swayed….
Their Climate Beliefs aren’t really based in Science….
If 95% of the Climate Scientists came out tomorrow and said: “There is no reason for Alarm…..Emissions aren’t Bad……They’re Good……
….Stop Worrying……No need for CO2 Regulations”….
Would the WashPost, NYTimes, Eric Holthaus, and the rest of the Climate Cult admit they were wrong and stop pushing their Propaganda?
NOPE…..of course not…..
In fact…….close to 50% of Climate Scientists……ARE NOT…..Alarmists……
You wouldn’t know that by reading or watching the Liberal Media…..
The Liberal Media are Insecure, Childish, and Arrogant Narcissists……
They’ll never admit they’re wrong……
Especially not regarding their Highly Sacred Climate Religion…..
They always need to hold something over the Heads of the ‘Illiterate’ Masses……so they can Teach us and Enlighten Us…..
Ha!!
How did they get so Enlightened?
Their Parents from the Suburbs paid for them to go to a Liberal University…….and Major in Journalism…..
After 4 Years……they all automatically attain Buddhahood……upon Graduation……..enabling them…….
….to bring the Truth of Reality to us Lowly Illiterates…..
Ha!!!!
No Thanks…..I have 3 Degrees in Science…….MUCH Superior to Journalism…..
I didn’t learn the Art of Telling Stories…….I learned how to Decipher and Understand the Natural World and its Natural Processes……
What’s Real and What’s not Real………..is not up to a Poll……
Denialists have no science on their side. I made a dog shadow puppet from your projection.
Best,
D
You’d think with three degrees in science he’d know that sentences end in periods.
and your degrees are in what again I think I missed you telling us all how brainy you are (.)
Keep trying. You’ll get there someday.
http://rs2.pbsrc.com/albums/y43/lilmopeep1/renAndStimpy.jpg~c200
No, that one will not.
Best,
D
nice sciency come back and your degrees are in what again?
It is true: denialists have no science on their side. Nothing. Nada. Nil. Null set. Zip. Zero. Zilch. Squat. Jack. Bupkis.
Best,
D
That’s right, Pielke, Lindzen, Christy, Edso, Spencer, Curry, Soon, Happer and a host of others have “no science background” whatsoever. Al Gore, on the other hand, is a walking, talking Colosus of scientific knowledge. Why do we know this? He made a movie. That “settles” it.
Just a reminder to you and your AGW alarmists – Gore made a brash prediction 10 years ago and the “best if used by” date is rapidly approaching – later this month. Any wagers that his prediction of doom and gloom will (a) be realized, (b) be covered by the MSM, (c) be excused as merely a warning for “immediate action to be taken” – but hasn’t been and won’t be, despite COP21 posturing?
The alarmists have Gore, Bill Nye “The Pseudo-Science Guy”, John Kerry and the political apparatus of the IPCC. I’ll stick with my team of skeptical scientists.
Aside from the fact you can’t name any science on your side, share with us exactly what it was Algore (isfat!) done perdiktid.
Exactly what it was.
Best,
D
I’ve given you names of scientists who are recognized as knowledgeable in their respective fields of climate science. Go read their published and posted work for yourself and, unless you think UA-H hired Spencer as a throw-away position or that MIT felt sympathy for Lindzen and kept him on board for no good reason, feel free to critique their analysis with your own data.
Gore predicted that by January, 2016 it would be too late to do anything about CAGW. He garnered significant press with his road show, a Nobel Prize for his activism, a big payday after selling his TV “station” to Al Jazeera and he travels in luxury between his mansions while scolding the rest of us to curb our carbon footprint. Notice that I have not made any comment about his physical appearance nor how he speaks (although he does have a penchant for being condescending in his pronunciation and speaking pattern) – those are things you brought up.
Wow! you’ve given me names. Congratulations!!!!!!!!!!!!!!!!!!!!!!!!!!!!!!!!!!!!!!!!!!!!!!!!!!!!!!!!!!!1
Who cares? You’ve given no science. You have no science. No NewPhysics, no equations, testable hypotheses, body of work, journals, models, scribbles on a napkin.
Big whoop.
Best,
D
I figured you were intelligent enough and curious enough to go read what these prominent skeptics of CAGW have written, why they are skeptical of the doom-and-gloom predictions and present your own counter-argument as to why they are wrong. Was I wrong in giving you that much credit?
Still no science.
Best,
D
You really are lazier than the average gullible alarmist, aren’t you? The science you seek is written by the scientists I’ve already steered you to. Go do your own homework and refute what they present. I’m not going to do it for you. In the meantime, let’s pretend that mankind’s 5% contribution to atmospheric CO2 emissions is capable of tipping the global climate to catastrophe, as you alarmists propose. What are you personally doing about it to prevent this contagion from happening?
Continuing with the no science.
Best,
D
We have satellites… no warming for 18 years.
Oopers! You were duped!
Best,
D https://uploads.disquscdn.com/images/182c7c526aab159d16be77294b67de0813033c7f42a312f61fa2693ecdfa3fef.png
No I wasn’t…. both UAH and RSS agree… as well as radiosonde.
My graphics refute you. And here’s a balloon set refuting you too.
Awh!
Best,
D https://uploads.disquscdn.com/images/d30e998f64823a474c3dd61c1a12dd174584a539741b0fa5f5652c4e358fdb4c.jpg
https://uploads.disquscdn.com/images/de95529ad877a4ac3c8d2426d3d4ecb88a7d1c6a1a8b39264eda79dd876812a0.jpg
https://uploads.disquscdn.com/images/bb5fe8e1ae09ebed97b46a3885f8f2f3e4e68677bc7c8fa69205b75c5d1becd0.png
No. they don’t… No warming for 18 years….
Let us know when you get to sixth grade so you can read a chart.
In ~9th grade you’ll learn about start point bias.
Best,
D
You graduated and still can’t read them.
You failed.
Best,
D
Nope you did.
Your list does include a couple of scientists, Curry and Lindzen, whose body work is respectable. I read Pielke’s book, Climate Fix, and found it interesting; he has made a fair case that the mass media hypes extreme weather (as it does with crime and terrorism). Christy and Spencer do some tricky satellite data processing, but have a history of miscalculations and greatly overstate their conclusions. The others are just crackpots. But let’s be honest. The vast majority of climate scientists and researchers in related fields have concluded the our ghg emissions pose a serious risk to the ecological systems that we and many other species depend on. So, irrespective of what you think of Gore, Kerry and Nye, I am going to go with the mainstream scientific view.
No,. They haven’t and most don’t believe its dangerous.
Dear Dano.
Please explain to me your church’s teaching about the
pressurized
frigid
turbulent
refrigerated gas bath
blocking 17% of the energy available to a light warmed rock,
being a MIGHTY MIGHTY HEATER in the SKY,
so that the VERY GASES blocking the 17%
and doing ALL the PHASE CHANGE REFRIGERATING, are the ”CORE” of the Magical Heater.
Be succinct.
Make the thermodynamic thunder roll, with exquisitely phrased profundities that rattle the intellectual rafters so to speak,
as if you’re speaking forth, in an expert production of Othello.
Move on to your scintillating expose on how all through history – people have used frigid gas baths, to warm the light-warmed rocks, the baths blocked 17% available light to.
Make that stuff ring like you really believe in it, and you don’t really think people are sitting around worldwide laughing into your thermodynamically,
befuddled face.
No science on their side, still.
Best,
D
We’ll accept that as your confession you don’t really know what you’re talking about. Deflection is your culture’s way, like being fascinated with bombastic story telling is the way of other death cults whose membership hope something’s really wrong so they don’t feel so wacky,
about being so doggone wacky
Still not showing science.
Best,
D
You wouldn’t know it if you saw it.
That’s not showing any science either.
Best,
D
The science was already shown in the article… You are too stupid to see it and can’t read graphs.
Hoot! Me loves me this Internet Performance Art!
I LOLzed!
Best,
D
You’re a moron… you’re easily impressed.
Thanks smartie. Poor hapless Allen and you have shown no science to validate your beliefs.
Best,
D
Yes we do… that satellites say….
No warming in 18 years….
No Sea Ice changes in about 9 years….
And volume is about the same as 7 years ago…
All totally inconsistent with it being the “hottest year ever”
Keep up your climastrological masturbation.
Except ALL the satellites. You know…. those things that can measure the radiation coming off from the whole earth and not just in a relatively few spots.
What about the satellites? do you think you know something? What papers say something using satellites that says something about radiative physics working differently on earth than elsewhere in the universe?
Best,
D
Satellites say the Earth hasn’t warmed for 18 years… A complete contradiction of the entire AGW hypothesis… what more do you need to know… the models are wrong… they aren’t even close.
Satellites say the Earth hasn’t warmed for 18 years.
Hilariously wrong. And dishonest cherry-picking, but still. https://uploads.disquscdn.com/images/182c7c526aab159d16be77294b67de0813033c7f42a312f61fa2693ecdfa3fef.png
Best,
D
You’re claiming falsely that 2015 is the hottest year… The charts clearly show you are wrong…
The graph starts in 1979 after about .3 or .4 C of cooling from 1940-1975… sooo…. probably no warming in 70 years.
Clownical. Every metro organization on the planet is saying 2015 was the warmest year on record. Aren’t you precious?
Best,
D
Yes… because they are using fudged surface data based on instruments that cover .003% of the planet… Satellites cover nearly the entire surface…. How many temperature stations do we have in Central AFrica?
Fudged! Drink!
Satellite people say surface datasets are better.
Best,
D
One satellite person says that… because he’d be fired if he didn’t
You made that up. it’s all denialists have.
Best,
D
Nope… well proven. All you have is made up and “in-filled” fudged data.
Dishonest assertion. You can’t back your comedy.
Best,
D
nope… completely proven… Every day… The last pause buster change being the most egregious.
Still not backing your assertion.
best,
D
Has been 100 times… All of you assertions you’ve proved wrong with your own charts.
That’s not backing it either.
Best,
D
Yes it is.
Typie-typing nonsense isn’t “backing” or “providing evidence”
When you get to 8th grade you’ll learn that.
best,
D
Yes but I learned from you… You have nothing… You can go back and see how NASA changes historical data on a weekly basis recently… It’s really sad you’re so stupid.
You can’t back that claim, smartie.
Best,
D
Yes it is. 100 times a month.
Proven every day.
The satellites clearly don’t say that. As your own chart indicates.
People don’t live in dirigibles. They live on the surface of the earth.
/Captain Obvious
Best,
D
That your fudged temperature stations read .002% of.
You can’t show temps are fudged. Failure.
best,
D
I can show you aren’t measuring African and Antarctica… I can show you 40% of the numbers in the USA are fudged.. It says so right in the database
You have zero evidence for that assertion. None. Nada. Nil. Null set. Zip. Zilch. Jack. Squat. Bupkis.
Best,
D
Yes.. in the database they have an e next to it… meaning estimated…
Yes, we can… 100’s of people have… It’s all on the NASA website.
and CO2’s effect saturates at around 200ppm… That’s been in the meteorological manuals for almost a century.
Hilarious. I’ll take those points on offer:
o GHG’s are ‘saturated’ [25 points]
https://www.facebook.com/ClimateDenialistTalkingPointGame
Best,
D
That’s not science… Read your meteorological manuals… Facebook is not a reference… LOL.
Thanks, LOLO, no one said it was science – it is making fun of your false statement!
Best,
D
If it isn’t saturated… why isn’t the temperature rising…. DOHHHH… You have no science on your side…
Clownical. Two years in a row warmest on record, but tempercher ain’t risin’.
Me loves me my Internet Performance Art!
Best,
D
Again… satellites all say 2010 was warmer… therefore we are cooling which is why ice is not going away…
People don’t live in dirigibles.
/basic
Best,
D
And where they do live they create the UHI effect…
How many temperature stations in central Africa? Antarctica?
Satellites don’t measure Antarctica either, so weak logic fail.
best,
D
But they measure the rest of the earth… pretty much all of it.
so only your logic fails.
And where they do live they create a UHI effect which won’t effect satellites.
Since 2015 Arctic ice was record low max extent and 4th lowest overall, we must conclude you are telling big fibs to make comedy or get attention.
Best,
D https://uploads.disquscdn.com/images/7d4f2d7e8c018c975c01fee36682fa2dfadb0e24fe50bca83bd9d278a9ef970b.jpg
But its hifher than 10 years ago now.. and volume is up from 2012
It is not higher than 10 years ago. And it is dishonest to start from record low point. Stop being dishonest.
Best,
D
No… After 40 years of global cooling… 1970’s were a high point…
Stop being dishonest.
Best,
D https://uploads.disquscdn.com/images/b761b9e6fd6f7b1d42f01c8c24a67bbdb59f82b5aeebc12965ffa9a2c0f85bb2.jpg
So ice stays stable during the well documented global coolilng and immediately begins falling off… It isn’t that big of a drop… and the data pre 1979 is not nearly as good. You only have 60 years of data… it’s nothing. and the data isn’t that good.
According to DMI it is.
DMI refutes you.
Best,
D https://uploads.disquscdn.com/images/92010f56a544471a31fb8d215ac8b564898bedfa19b2ffd131e3510dde12be97.png
No…. They refute you… I’ve posted the line 3 times now… You’re an idiot moron.
Not smart enough to grasp it, we get it.
Best,
D https://uploads.disquscdn.com/images/92010f56a544471a31fb8d215ac8b564898bedfa19b2ffd131e3510dde12be97.png
LOL… back to proving sea ice hasn’t GROWN for 10 years by showing 4 years worth of data… Hilarious. I hope no one is paying you to post this stupidity.
You’re still a moronic twit.
How many times do I need to post the link moron?
http://ocean.dmi.dk/arctic/old_icecover.uk.php
Thanks smartie-smart, you are lacking capacity to understand, we get it.
Best,
D
You lack the ability to read it moron.
Better go back to watching Hawaii 50 Dano.
http://ocean.dmi.dk/arctic/plots/icecover/icecover_current.png
Not smart enough to grasp the difference between the two charts, we get it.
Best,
D
I’ve already explained the difference …. your the moron who tries to prove ice has declined over the last 10 years with a chart that has 4 years worth of data…. You’re the definition of a moron.
10 of the hottest years on Earth… yet no change in sea ice extent…. You’re hilariously stupid.
Speaking of hilariously stupid:
yet no change in sea ice extent
Not capable of understanding there is a change. Got it.
Best,
D https://uploads.disquscdn.com/images/d75f5ef63f731c1f7b0df57cc828746d19c3096dec11909c0706e610de364fac.png
https://uploads.disquscdn.com/images/ae0f6859a7ab002f68fbe1072eb775f527b12edab0f6148f3ee447e5cdf148d8.png https://uploads.disquscdn.com/images/0a678faa894534bbc6b39d6d6f2fea320bc6ac0786d66a14ec7719ee39646e1e.png
Again, your graph ALWAYS starts at the end of the 40 year global cooling phase… why are you cherry picking… And Despite 7 of the hottest years on record… ice volume same as 7 years ago… an in an El Nino year…. You are stupid to believe the crap.
I told you volume was same as 7 years ago… Thanks for confirming my chart… you really didn’t need to posit it… it just proves you wrong.
Clowntastic! Smartie can’t grasp the concept of the start of satellite measurements!!!11
You are a ….erm…”special” little boy!
Best,
D
I grasp them perfectly… It happened to be after 40 years of global cooling…
Dim bulbery is good entertainment.
Best,
D
It certainly is.
zombie_hockey.jpg
What is the rate of change since 2010? Aren’t these the “hottest years on Record”… LOL.
Thanks. Trend down. Not up like you were duped into believing.
Best,
D
Since 2010? No… it’s not … despite being the “hottest years” on record..
Trend down, as you are comically unable to grasp.
Best,
D https://uploads.disquscdn.com/images/0a678faa894534bbc6b39d6d6f2fea320bc6ac0786d66a14ec7719ee39646e1e.png
NOt since 2010… despite 5 of the hottest years on record AND an el nino…. YOu’re so stupid… I’m laughing out of my chair.
Still can’t read a graph… I hope my taxes weren’t wasted on your education.
Really you are so stupid it’s funny.
Don’t have a little sads cuz refuted. Here’s a hankie. There, there.
Best,
D
http://ocean.dmi.dk/arctic/plots/icecover/icecover_current.png
You are refuted.
Your mama was refuted when she saw what came out…
Highest in 10 years.
http://ocean.dmi.dk/arctic/plots/icecover/icecover_current.png
Smartie not capable of understanding.
Entertaining!
Best,
D
And you’re not smart enough to explain it to anybody… because there’s nothing to explain… Post one more time that 4 years of ice extent data to prove we are lower than 10 years ago… MORON.
Dano2 IQ of 30
But it’s the hottest year on record… why isn’t sea ice dropping through the floor? Your graph shows no statistically significant change in 10 years. Totally contradictory… and then of course baselined off the coldest years in recent history.
Liar: Your graph shows no statistically significant change in 10 years.
Grasping at weak straw.
Best,
D
Not lying… All of your years in the same band…. You can’t read a graph because you have a n IQ of 30. DMI graph shows most ice in 10 years.
You’re the one grasping.
Satellites show no warming in OVER 18 years. FACT. SCIENTIFIC ONE even.
I already refuted this erroneous assertion. You don’t get your own facts.
Best,
D
By showing 1998 was hotter than today…. yep… sure you did.
You made that up too.
Best,
d
Nope that’s what your graph shows.
You are dishonestly and mendaciously cherry-picking data.
Got it.
best,
D
No… you use a chart with only 4 years of data to claim that ice is less than it was 10 years ago… Even a 3rd grader is not that stupid.
Clownical.
best,
D
Factual…
Your clowntastic is certainly entertaining. Here’s your ten years, smartie-smart.
Aren’t you….erm…”special”? yes you are! You are special!
Best,
D https://uploads.disquscdn.com/images/15e74736e85d815417e97aaafecd14b6d06b01aba3225d96e4133668a3d275b1.jpg
So mo changes in 10 years. Great.
Unreadable graph, hence using only last few years to show 2015 not rebounding.
/seventh-grade graphics skills
Best,
D https://uploads.disquscdn.com/images/ec62cd693443a08d5e848043c71051ee4b420c427b94ffb7a785e06523693eea.png https://uploads.disquscdn.com/images/21c2eb3d0a77b9113fc591fc08db0c173922f5f02d52fe997e39e644bcfdb984.png
Unreadable to you moron.
Thanks, smartie smart doesn;t understand the data!
Best,
D
Moron alert Dano2
http://ocean.dmi.dk/arctic/plots/icecover/icecover_current.png
Not the same. 30% coverage. Can’t you grasp simple things?
Best,
D
I know its not the same… But why is one more valid than the other moron.
No capacity to understand, we all get it.
Best,
D
Whatever you do… Don’t hit the Antarctic button and look at that one….
You’re so hilariously stupid it’s funny…
Again, the Danes disagree.
Why did you post a new chart if your first one wasnt just 4 years… youre so stupid. I hope your mom isnt reading this.
You were the toddler who whined, so i showed you what the chart you whined you wanted looked like, I’m enjoying your spectacle, you make me laff!
Best,
D
Yes and the chart showed all 10 years in the same band… proving that sea ice stopped declining 10 years ago…
How is Antarctica doing moron.
You’re the clown.
He posted 2 charts and a couple of links in the Gavin Schmidt thread that completely destroyed his argument and proved mine was correct. He’s a freaking genius with data! I encourage him because he does more damage to his own side than I ever could. 🙂
and proved mine was correct.
Since ice right now at record low, you must mean and proved mine was [clownical].
Best,
D
Can you read? Or do you just choose not to?
This is not the Gavin Schmidt thread is it? LOL!!
Cuz Arctic ice with Arctic storm somethingsomething handflap wootwoot squirrel! is the best you can do.
That is: smart people and half-wits know the topic was Arctic ice. Then there is you.
Best,
D
It was your data moron… It was your chart… You can’t read it. Not my problem.
Smartie-smart cherry-picking chart!
Best,
D
10 years no change in ice according to your size…. Mine shows a little improvement. Yet this is the warmest year on record and an El Nino year… and still ice levels are the same as 8 years ago.
Still not smart enough to grasp it….hmmmm…I detect a pattern…
Best,
D
Yes… the pattern is you’re stupid to read a graph.
YOu’re still a moron.
You haven’t refuted anything except your own false statements with graphs you can’t read.
Dano has a degree, in applied Magic Gais. He has got EXPERT testimony of all the heateristical
hotterisms
that make a MAGIC gais turn a PRESSURIZED FRIGID TURBULENT REFRIGERATED BATH,
into a
mighty, MIGHTY Heetur in the sky. Ya’LL.
He can TAYLe YeW abowt how ALL THROUGH history, MEN have used FRIGID REFRIGERATED BATHS,
to
RAISE the TEMPERATURES of light-warmed ROCKS,
so the rocks got WARMER than when there was MORE LIGHT REACHING the light warmed rock
and there WAS no
refrigerated
turbulent
frigid
fluid
bath.
Now you must admit YOU MUST
admit
that is a Magical, MAGICAL Gais, to make a mighty mighty heetur like that.
Hey
You can make the sky hot by using fire too.
You should HEAR HIM RIVET the CROWD with HIS STORY about how makin that DEVIL FIRE
makes the SKY get HOTTER and HOTTER til you can’t hardly find any shade, from those Backerdistical
Backerdisms.
Boy, HOWDY that TaiR, is a MIGHTY magical heater. MIGHTY magical!
Ya’ll..
It’s a fact… there are polls… most believe it’s warming… some believe it’s a problem… many don’t
Nonetheless, denialists have no science on their side.
Best,
D
Except all the Satellite data.
The data show warming, so who knows what your bumbling and stumbling is supposed to mean.
Best,
D
But not enough warming and none recently… when it should be increasing slope every year.
Every AGW model fails…. miserably.
Every AGW model fails…. miserably.
You are completely and utterly unable to show that is true. Your italicized is an utter failure.
Best,
D
That’s not what the AR5 showed
Yes it is.
Best,
D
No it isnt.
You can’t show that it did.
best,
D
Already have… you can’t read a chart.
and actual facts.
at least our science is not science that we made up along the way and then changed then faked numbers and then we were still proven wrong with actual facts. the earth hasn’t warmer in over 15 years. global warming is a theory that HAS NOT been proven in any way. it has only been proven by democrat sponsored scientists in order to get more money from said democrats via grants.this was all proven when the emails came out the fake the number to increase tempts a few years ago.
You can’t provide valid, testable evidence for a single word you typie-typed. Well, maybe “a”, “and”, and “the”, but that’s it. Nothing more.
Best,
D
Since we are talking about how the Washington Post is covering climate change, here are two recent editorials to consider.
2015: A year of progress and buffoonery on climate change
https://www.washingtonpost.com/opinions/2015-a-year-of-progress-and-buffoonery-on-climate-change/2016/01/02/9ad6955c-af33-11e5-9ab0-884d1cc4b33e_story.html
Even ExxonMobil says climate change is real. So why won’t the GOP?
https://www.washingtonpost.com/opinions/even-exxonmobil-says-climate-change-is-real-so-why-wont-the-gop/2015/12/06/913e4b12-9aa6-11e5-b499-76cbec161973_story.html
What’s your point? That big corporations have advantages over startups when Big Government gets in the way… We already knew that.
Right. ExxonMobil is so worried about startup oil companies that they want their own product taxed. So, it is a plot involving 195 countries, the Pope and many other faith leaders, the oil companies and scientists and economists from every part of the world. You have destroyed any credibility you may have once had.
https://www.youtube.com/watch?v=wRpAANsoG8I
They are a protected monopoly… the taxes get passed on moron. You tink exxon pays them?
A tax would reduce usage. It would rebated to the public.
They will still make their billions (well… at least once the price of oil goes back up).
The data sets are mostly based off the same information… No conspiracy needed…. but an I’m saving the world complex is helpful. Plus the normal corporate/government groupthink.
Please explain the growing disparity between the surface temperature record and the satellite temperature record… Why are they diverging… Why do we see the historic data shifting…. at least once every month…. Do you think we are still getting earth-shattering news every month about the temperatures in 1880 and 1910? Seriously, are you really that stupid?
They both show warming. Can you explain why that is?
Satellites show very minimal warming in the last 20 years… All of the warming occurred between 1979 and 1998…. Nearly 20 years of warming after a 30-year cooling period… So…. temperatures have barely risen in the last 70 years.
No. But there is no point to debating science with people who reject science.
What science have I rejected?
Dear Magic Gasser. Please bear testimony of your church’s teachings about how the frigid, refrigerated, turbulent fluid bath blocking 17% available energy to the planet,
became a MIGHTY, MIGHTY HEATER in the SKY!
Go on to explain how,
many times through history,
pressurized
frigid
turbulent
refrigerated gas baths
blocking light to the
light warmed rocks immersed in them
have been used to heat the rocks such that they were warmer
AFTER the frigid refrigerated turbulent fluid bath
than
when there was more light arriving on the light warmed rock,
and there WAS no
frigid refrigerated turbulent gas bath.
Make the profoundly thundering thermodynamic truths ring like somebody put on a production of Othello.
Pause at really important points, and add in little piquant anecdotes of a humorous nature, & whatnot.
DECEMBER 22, 2015 – JUDICIAL WATCH SUES FOR DOCUMENTS WITHHELD FROM CONGRESS IN NEW CLIMATE DATA SCANDAL
(Washington, DC) – Judicial Watch announced today that it filed a lawsuit on December 2, 2015, in the U.S. District Court for the District of Columbia seeking records of communications from National Oceanographic and Atmospheric Administration (NOAA) officials regarding methodology for collecting and interpreting data used in climate models (Judicial Watch v. U.S. Department of Commerce (No 1:15-cv-02088)).
http://jwatch.us/JFrUD6
Climate Change is Unfaslifiable Woo-Woo Pseudoscience
Karl Popper famously said, “A theory that explains everything explains nothing.” So what do you make of the theory that catastrophic manmade CO2-driven “climate change” can account for harsher winters and lighter winters, more snow and less snow, droughts and floods, more hurricanes and less hurricanes, more rain and less rain, more malaria and less malaria, saltier seas and less salty seas, Antarctica ice melting and Antarctic ice gaining and dozens of other contradictions? Popper gave a name to “theories” like this: pseudoscience.
https://youtu.be/huKY5DzrcLI
Flashing a bunch of newspaper headlines is not science. The warming continues. The melting continues. Sea level rise continues. Ocean pH is dropping. The impacts on weather are complex and not as well understood.
Why did you skip this post I made? DECEMBER 22, 2015 – JUDICIAL WATCH SUES FOR DOCUMENTS WITHHELD FROM CONGRESS IN NEW CLIMATE DATA SCANDAL
It was not important.
Nah, you’re just thermodynamically incompetent.
Phil Jones the world’s # 1 climatologist admitted in 2 0 0 5 ”The scientific community would come down on me in no uncertain terms if I said the world cooled since 1 9 9 8. OKAY IT HAS but it isn’t but seven years of data
and it isn’t statistically significant.”
Flash forward to 2010. JONES has been CAUGHT LYING and in exchange for NOT GOING TO JAIL he AGREES to REVEAL the REAL GLOBAL TEMP.
feb 2010 BBC INTERVIEW with PHIL JONES:
BBC: Isn’t it true there has been NO WARMING since 1 9 9 5 and that since 2 0 0 2 there has been slight WARMING?
JONES: YES. I did the calculations and find that SINCE 1 9 9 5 there has been NO WARMING and that there has in fact, since 2 0 0 2, been some SLIGHT but not STATISTICALLY SIGNIFICANT,
C O O L I N G.
Look around AGAIN: WHAT data set showed in 2 0 0 5, NO MORE WARMING since about 95-98 and SLIGHT, but NOT STATISTICALLY SIGNIFICANT
C O O L I N G?
The RAW DATA PLACED that way online by LAW to stop – ADJUSTMENTS SCAMS.
When the WORLD’S #1 CLIMATOLOGIST is caught with FOUR OTHER METEOROLOGICAL HEADS
PLOTTING to ISSUE PRESS RELEASES that IT HAS KEPT WARMING when they are ARGUING about how it HASN’T and THEY don’t KNOW what to DO,
Then admits under pain of going to JAIL, that ”I”ve been FAKING ALL THIS WARMING since 1 9 9 5/98.
then that DATA is FAKE.
Your CLAIM is FAKE.
Sea level still rises identically to the way it’s been for FIVE THOUSAND YEARS from about 2 to maybe 4 mm a YEAR.
Ocean pH is NOT dropping, there isn’t even STANDARDIZED pH MANAGEMENT. Not ANYWHERE in the world.
In other words your story’s wrong because you got it from M S M who weren’t really interesting in finding out Al Gore’s movie about ”using the fire will make the sky get hot” is a hoax.
Look up the word stochastic.
Look up the word ”thermometer”
Then burst out in song about how the sun warmed rock was HEATED through BLOCKING LIGHT to it
and scrubbing it with a FRIGID REFRIGERATED BATH.
And it needs to be so clear we think you had Al Gore lay hands on your head and set you aside as a special messenger, of magic gais and frigid baths that heat up rocks to the point they’re WARMER than when they weren’t in a frigid bath.
Get a life.
Let his clown skit play out. I popped some popcorn so I can watch.
Best,
D
What you should have done was gone and gotten some books so you could talk about your low information voter religion with some CONFIDENCE.
Again: BEAR TESTIMONY of YOUR PERSONAL UNDERSTANDING, Magic Gasser,
of the MAGICAL and GREEN ancient CIVILIZATION who ALSO HEATED THEIR OWN rocks,
by WASHING THEM in FRIGID, REFRIGERATED BATHS.
Explain that. GO FIND the GUY who WILL.
I’ll wait.
Best,
D https://uploads.disquscdn.com/images/4f371fc2bac007d1ee49f5b2225ae1d708ac7ffccabaa681f4ddec44d1c072bc.gif
His skill at capitalization is impressive.
LoooooooooL I did.
As an atmospheric radiation instrumentation Electronic Engineer.
And of course that means you’re in a bind so bad….LoLoL you can’t
ban me for telling you start barking proper thermodynamic process or face… well you know.
Me.
Cmon and tell us about your church. ”FIRST, the earth had no atmosphere to remove energy so it was warm. 100% of available energy made it to the surface.
THEN, there was a LIGHT BLOCKING, FRIGID SELF REFRIGERATING COOLANT BATH suspended around it, and it got
HOTTER than it WAS in VACUUM. Getting ALL the LIGHT
WITHOUT the FRIGID, REFRIGERATING BATH! Ya’LL! ”
I do not pay much attention to people who cannot write coherently.
Obviously you’re over here begging for a chance to BARK some MAGIC GAIS CHURCH SOLIDARITY.
GET BARKING Magic Gasser ! Let’s HEAR it about how YOU THOUGHT the SUN WARMED EARTH
was made WARMER than when it DIDN’T have a FRIGID, REFRIGERATED, SUNLIGHT BLOCKING
BATH, we won’t all LAUGH in your NOT PAYING ATTENTION, face. LoL Yeah, we will.
You go ahead and start barking about the magic gais makes the sky a mighty, MIGHTY heetur.
We’ll try to see our way through to the end when you declare OTHER ancient green civilizations used to HEAT THEIR sun warmed objects in FRIGID, SUN BLOCKING BATHS of REFRIGERATED GAS, TOO.
Sing it like you mean it. Say it like you’re auditioning for a position in a Kenneth Branaugh movie.
Look up the word ”And That’s How The Frigid, Light Blocking Bath Of Refrigerants, Made The Sun-Warmed Rock, HOTTER Than When It Wasn’t In The Frigid, Light Blocking Refrigerant Bath.”
Let us all know in whatever fascinating hand wavings you put together, so it doesn’t sound like you’re high,
when you say that sounds real.
http://ocean.dmi.dk/arctic/plots/icecover/icecover_current.png
Sea ice still highest in 10 years.
This is not for NH sea ice. Morano updated his post to include the correction I originally pointed out.
Yes, it is for the NH sea ice. 30% or more ice, coastal zones included. Their other charts is 15% or more ice with coastal zones excluded. Its all there on their website.
Since current ice extent may very well be at a record low right now, what’s your point again?
Best,
D
The new plot does not show 2015 as being at a 10 year high. That was the old plot that excluded the coastal zones.
I know… But they apparently don’t have data using the new method more than 5 years going back… So for comparison purposes… that’s all they have. And in comparison 2015 ended superstrong.
The quote on http://ocean.dmi.dk/arctic/old_icecover.uk.php is “Total sea ice extent on the northern hemisphere since 2005. The ice extent values are calculated from the ice type data from the Ocean and Sea Ice, Satellite Application Facility (OSISAF), where areas with ice concentration higher than 30% are classified as ice.” So it’s true, the 30% NH sea Ice area (not same as sea ice extent which includes 15%) is clearly at a 10 year high and materially so…
But you and others continue to feed a TROLL! As I posted many days ago he has “little/no phy-sci background, NO THERMODYNAMICS study at all! A train-wreck of tired-old bad info epoxied together in dogma, w/ years of posts in evidence of same.”
By his own post, “I was a weatherman in the USAF and studied bioclimatology before switching to the plant side,” Like I said, he is is little/no phy-sci (iow, life-sci dominant, phy-sci ignorant), NO THERMODYNAMICS “plant”… a vegetable… “best” description might be a mushroom, rooted in the dark of his own bs!
This thread is a representative capsule of years of evidence of his mental um acuity? The thread itself is prima facie evidence of my earlier assertion! For more that a full decade, he has dogmatically posted such trails of evidence, the same as this thread.
IRONIC ISN’T IT; his phy-sci & thermodynamic vacuous posts are in evidence about as long as the 10 year NH 30% or more ice areas, that were materially surpassed in DEC’15 and continues here in early JAN’16. The difference between these two of course is that the NH 30% ice will eventually drop back into the 10 year plots – the other will like never exhibit any evidence of acuity in phy-sci or thermodynamics.
At this point, perhaps it’s “best” if I conclude with, “please don’t feed the troll!”
All too often, the pro AGW argument is based on the notion that those of us that question their logic are “anti-science”. Anything in the world can be proven if one accepts an anecdote – or a singularity as proof. Modern science is based on statistical data, in which a single event; be that a tornado, a hurricane, or a temperature spike; must be analyzed in conjunction with the universe of other data in order to look for trends. If a signal is discovered, it requires an explanation. Noise never requires an explanation, as it is just noise. Drawing conclusions from noise is the purview of politicians – not scientists.