
Global warming ‘pause’ expands to ‘new record length’: No warming for 18 years 5 months
Special to Climate Depot
El Niño has not yet paused the Pause
Global temperature update: no warming for 18 years 5 months
By Christopher Monckton of Brenchley
Since December 1996 there has been no global warming at all (Fig. 1). This month’s RSS temperature – still unaffected by the most persistent el Niño conditions of the current weak cycle – shows a new record length for the Pause: 18 years 5 months.
The result, as always, comes with a warning that the temperature increase that usually accompanies an el Niño may come through after a lag of four or five months. If, on the other hand, la Niña conditions begin to cool the oceans in time, there could be a lengthening of the Pause just in time for the Paris world-government summit in December 2015.
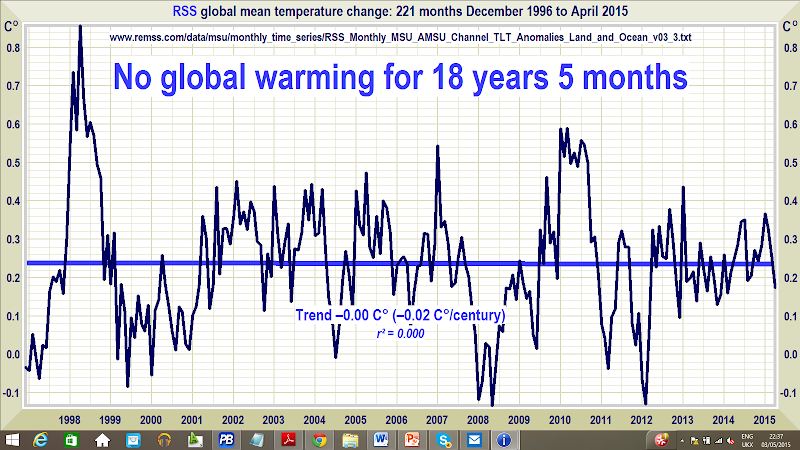
Figure 1. The least-squares linear-regression trend on the RSS satellite monthly global mean surface temperature anomaly dataset shows no global warming for 18 years 5 months since December 1996.
The hiatus period of 18 years 5 months, or 221 months, is the farthest back one can go in the RSS satellite temperature record and still show a sub-zero trend.
The divergence between the models’ predictions in 1990 (Fig. 2) and 2005 (Fig. 3), on the one hand, and the observed outturn, on the other, also continues to widen.

Figure 2. Near-term projections of warming at a rate equivalent to 2.8 [1.9, 4.2] K/century, made with “substantial confidence” in IPCC (1990), for the 303 months January 1990 to March 2015 (orange region and red trend line), vs. observed anomalies (dark blue) and trend (bright blue) at less than 1.4 K/century equivalent, taken as the mean of the RSS and UAH v. 5.6 satellite monthly mean lower-troposphere temperature anomalies.

Figure 3. Predicted temperature change, January 2005 to March 2015, at a rate equivalent to 1.7 [1.0, 2.3] Cº/century (orange zone with thick red best-estimate trend line), compared with the near-zero observed anomalies (dark blue) and real-world trend (bright blue), taken as the mean of the RSS and UAH v. 5.6 satellite lower-troposphere temperature anomalies.
The Technical Note explains the sources of the IPCC’s predictions in 1990 and in 2005, and also demonstrates that that according to the ARGO bathythermograph data the oceans are warming at a rate equivalent to less than a quarter of a Celsius degree per century. There are also details of the long-awaited beta-test …