
Climate Scientists Recycling The Same Sea Level Nonsense From 35 Years Ago
…Analysis: ‘Greenhouse gas levels reach record highs, nothing happens’
…Scientists Find That Sea Level Rise Is Much Slower Than Expected…No Human Fingerprint
…Did human caused sea level rise make Sandy worse? ‘Sea level rise rates in Manhattan have been constant since 1850, and are primarily due to subsidence’
…Analysis: Satellite sea level data has been ‘adjusted’ upward by 34% over past 9 years alone (by 1 mm/yr, equivalent to an additional 4 inches per century)
‘One has to wonder what all the excitement is about if for the last twenty years there has been no acceleration of the rate. Couple that with the fact that it’s rather easy to determine that there’s been a good deal of inflating the rate of sea level rise by those same CU Sea Level Research Group scientists.’…
UN IPCC 1990 Sea Level Predictions Only Missed By A Factor Of Five: ‘The 1990 IPCC Report predicted about 120 mm of sea level rise by the year 2014’
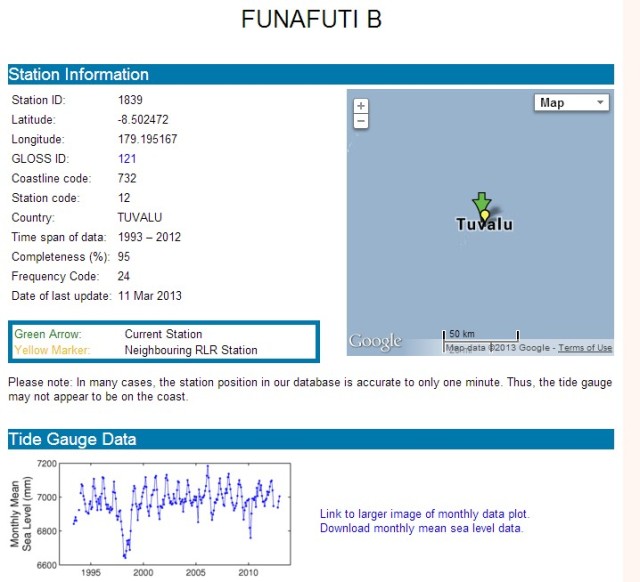
…Tuvalu – Still Drowning After All These Years — ‘Only one minor problem. Sea level isn’t rising at Tuvalu’
 …
…
Analysis: Satellite Sea Level Error Is Almost 100% Of The Trend
…Meteorologist Joe D’Aleo: National Geographic’s Sea Level Folly
National Geographic’s Sea Level Folly
Joseph D’Aleo, CCM
In the September 2013 issue of National Geographic, the feature story is on rising sea levels and how they are changing our coastlines. It shows a Statue of Liberty half submerged. The magazine in at least the past decade has adopted the failing climate change advocacy position prevalent in today’s mainstream media. It has become more science fiction than science fact. It is sad because it once was a very popular very balanced and informative trustworthy magazine. A lot of the hype on sea level rises including talk by Mayor Bloomberg of the need to spend $20 billion dollars to protect the city from rising seas and storms is based on faulty data.
The entire environmental movement is based on flawed theories and models. Whenever the data disagrees with the data they assume the data is wrong and adjust it to fit their projections.
The late, great Richard Feynman, a Cornell Physicist said about the scientific method that if data or experiments don’t support your theory no matter how beautiful it is or smart you are, the theory is wrong.
For example, global temperatures stopped warming close to 17 years ago and have cooled since 2002. This is while CO2 has increased over 11%. None of the climate change models used by the UN showed this hiatus. Claims of the warmest decade and very high ranking months and years are based entirely on our government manipulating climate data. In 1999 when NASA’s James Hansen observed relative to the US annual temperatures in the 20th century, that the 1930s was clearly the warmest decade and 1934 the warmest year, 1934 was a full 1.1F warmer than the spike in the super El Nino of 1998 in the NOAA’s/NASA’s prize US data set which adjusted for urban contamination.
That was inconvenient since their global data set that was not adjusted for urbanization was showing significant warming over the same period. NOAA in 2007 removed the urban adjustment and changed other processing steps. The result was now that 1998 became 0.2F warmer than 1934, a change of 1.3F. One data set that was not altered, the state all time record highs and lows, showed a very different story more like that depicted in 1999. 39 of the 50 all time state record highs occurred before 1960. The most, 23, occurred in the 1930s. More …
More IPCC Misdirection: Its Dodgy Sea Level-Rise Assessment — Scientist rebut UN claims: ‘Recent scientific findings argue that rate of sea level rise since 1993 is little different than the long-term (20th century) rate of sea level rise once natural variability and non-climatic influences are accounted for’
More IPCC Misdirection: Its Dodgy Sea Level-Rise Assessment
http://www.cato.org/blog/more-ipcc-misdirection-its-dodgy-sea-level-rise-assessment
Patrick J. Michaels and Paul C. “Chip” Knappenberger
Global Science Report is a weekly feature from the Center for the Study of Science, where we highlight one or two important new items in the scientific literature or the popular media. For broader and more technical perspectives, consult our monthly “Current Wisdom.”
The UN’s Intergovernmental Panel on Climate Change (IPCC) is set to release its Fifth Assessment Report (AR5) of the physical science of climate change at the conclusion on its editorial meeting in Stockholm scheduled from September 23-26th.
A version of its Summary for Policymakers (SPM)—perhaps the most influential portion of the report as it is the widest read—has been “leaked” to generate media interest in the upcoming release. It certainly has, but perhaps not in the manner intended. The leaked SPM has revealed a document so flawed and removed from current science that it has been described as not only being “obsolete on the day that it is released, but that it will be dead wrong as well” (okay, we wrote that).
Examples already abound as to the problems evident in the leaked SPM. Here we add another—this one having to do with the recent rate of sea level rise.
In the Summary for Policymakers section of its Fourth Assessment Report (published in 2007) the IPCC had this to say about the rate of sea level rise:
Global average sea level rose at an average rate of 1.8 [1.3 to 2.3] mm per year over 1961-2003. The rate was faster over 1993 to 2003: about 3.1 [2.4 to 3.8] mm per year. Whether the faster rate for 1993 to 2003 reflects decadal variability or an increase in the longer-term trend is unclear.
Since then, we have highlighted numerous findings in the scientific literature that present strong evidence that the increase in the rate of sea level rise since 1993 is largely not an increase in the longer-term trend (or at least not from human-caused climate change which is the IPCC’s implication) and that the short-term rate of sea level rise has been slowing, and returning back towards the long-term average.
But the IPCC’s heart remains hardened.
The leaked version of the AR5 SPM includes this description of sea level rise:
It is very likely that the mean rate of global averaged sea level rise was 1.7 [1.5 to 1.9] mm …