
Oh noes! Global warming kills gut bacteria in lizards
From the UNIVERSITY OF EXETER and the department of “likely headed for Retraction Watch” comes this study that doesn’t seem to pass the smell test, because putting lizards in hot boxes isn’t the same as lizards in the wild, and the diurnal variation of temperature far exceeds 2-3°C. More likely, the lizards are reacting to stress from the environment, and have less bacteria because they’ve been isolated from their normal exposure to microorganisms.

Climate change could threaten reptiles by reducing the number of bacteria living in their guts, new research suggests.
Scientists from the University of Exeter and the University of Toulouse found that warming of 2-3°C caused a 34% loss of microorganism diversity in the guts of common lizards (also known as viviparous lizards).
In the experiments, lizards were put in temperature-controlled enclosures and samples of their gut bacteria were tested to identify which bacteria were present.
The diversity of bacteria was lower for lizards living in warmed conditions, and the researchers found this had an impact on their survival chances.
By raising the temperature by 2-3°C in their experiment, the researchers reflected warming predicted by current climate change models.
“Our research shows that a relatively small rise in temperature can have a major impact on the gut bacteria in common lizards,” said Dr Elvire Bestion, of the Environment and Sustainability Institute on the University of Exeter’s Penryn Campus in Cornwall.
Study: Antarctic Ice Sheet Has Been Stable For Millions Of Years – During Warmer Temps Than Now
Via: http://mailchi.mp/thegwpf/antarctic-ice-more-stable-than-thought?e=f4e33fdd1e
|
||||
 The ice sheets of central Antarctica have been stable for millions of years when conditions were warmer than now, a new research has found. Researchers from the Universities of Edinburgh and Northumbria studied rocks on slopes of the Ellsworth Mountains in Antarctica, whose peaks protrude through the ice sheet. However, the scientists are concerned that ice at the coastline is vulnerable to rising temperature, though the discovery points towards the long-term stability of Antarctica’s ice sheet. — The Indian Express, 8 May 2017 Glacier flow at the southern Antarctic Peninsula has increased since the 1990s, but a new study has found the change to be only a third of what was recently reported. The new research calls into question recent claims of much more dramatic ice loss. The new Leeds led research calls into question a recent study from the University of Bristol that reported 45 cubic kilometres per year increase in ice loss from the sector. The Leeds research found the increase to be three times smaller. —University of Leeds, 2 May 2017 1) Antarctic Ice Sheets Stable For Millions Of Years 2) Antarctic Peninsula Ice More Stable Than Thought 3) Data Analyses Show Rapid Global Surface Cooling, Growing Arctic Ice Thickness 4) Scientists ‘More Confident Than Ever’ In Global Warming After Studying The Lack Of It For 15 Years 5) NYT Columnist Warns Of ‘Intellectual Hubris’ Among Climate Scientists 6) Ivanka Trump To Review Climate Policy As US Mulls Paris Pullout 7) And Finally: Are Microbiologists Climate-Denying Science Haters? A new study examining explanations for the 10- to 15-year “hiatus” in global warming has scientists “more confident than ever that human influence is dominant in long-term warming.” But climate skeptics are already firing back at the claims. IACS’s study looked at different explanations for the “hiatus” in global warming, which the study defined as the 10 or 15 years after 1998, ultimately to put to rest arguments by skeptics the lack of warming during this time cut into theories of catastrophic warming. “I think it |
Study: EVOLUTION OF ARCTIC SEA ICE IN THE PRE- AND POST-SATELLITE ERA
Re-calibration of Arctic sea ice extent datasets using Arctic surface air temperature records

Abstract: A new seasonal and annual dataset describing Arctic sea ice extents for 1901-2015 was constructed by individually re-calibrating sea ice data sources from the three Arctic regions (North American, Nordic and Siberian) using the corresponding surface air temperature trends for the pre-satellite era (1901-1978), so that the strong relationship between seasonal sea ice extent and surface air temperature which has been observed for the satellite era (1979-present) also applies to the pre-satellite era. According to this new dataset, the recent period of Arctic sea ice retreat since the 1970s followed a period of sea ice growth since the mid-1940s, which in turn followed a period of sea ice retreat since the 1910s. Arctic sea ice is a key component of the Arctic hydrological cycle both through its freshwater storage role, and its influence on oceanic and atmospheric circulation. Therefore, these new insights have significance for our understanding of Arctic hydrology.
Full paper available from the lead author
…NEW STUDY CONFIRMS: THE WARMING ‘PAUSE’ IS REAL AND REVEALING
A new paper has been published in the Analysis section of Nature called Reconciling controversies about the ‘global warming hiatus.’ It confirms that the ‘hiatus’ or ‘pause’ is real. It is also rather revealing.
It attempts to explain the ‘Pause’ by looking into what is known about climate variability. They say that four years after the release of the IPCC AR5 report, which contained much about the ‘hiatus’ it is time to see what can be learned.
One could be a little sarcastic in saying why would Nature devote seven of its desirable pages to an event that some vehemently say never existed and maintain its existence has been disproved long ago. Now, however, as the El Nino spike of the past few years levels off, analysing the ‘pause’ seems to be coming back into fashion.
The authors of this recent paper delicately tread a line between the two opposing camps saying, on the one hand, that both sides have a point and their particular methods of analysis are understandable. But on the other hand they make it clear that there is a real event that needs studying.
As someone who has paid close attention to the ‘pause’ for almost a decade I am perhaps more attentive than most when it comes to a retelling of the history of the idea and the observations.
The authors say the pause started with claims from outside the scientific community. Well, yes and no. It was tentatively suggested in 2006 and 2007 by climate sceptics many of whom were experienced scientists and quite capable of reading a graph and calculating statistics. A decade after it was raised, every time the ‘pause’ is debated it is a tribute to those who first noticed it and faced harsh criticism. It was the sceptics who noticed the ‘pause,’ and in doing so made a valuable contribution to science. For years it was only analysed and discussed on the blogosphere before journals took notice.
There is nothing new in their recent paper or that hasn’t been discussed by the GWPF. Perhaps that will give pause for thought for some who see battle lines drawn between pause supporters (sceptics) and pause busters (scientists).
What the authors miss, with their three definitions of the pause, is a simple fact we have often pointed out. Look at HadCRUT4 from …
Inconvenient study concludes: warmer temperatures lead to a more stable climate
From RESEARCH ORGANIZATION OF INFORMATION AND SYSTEMS and the “goodbye climate disruption” department, comes this study that might very well explain why we have less landfalling U.S. hurricanes, less tornadoes, and extreme weather of all kinds seems to be waning.
Climate instability over the past 720,000 years
Ice core analysis from Dome Fuji, Antarctica and climate simulation
A research group formed by 64 researchers from the National Institute of Polar Research, the University of Tokyo, and other organizations analyzed atmospheric temperatures and dust for the past 720,000 years using an ice core obtained at Dome Fuji in Antarctica. Results indicate that when intermediate temperatures occurred within a glacial period, the climate was highly unstable and fluctuated. A climate simulation was also performed based on the Coupled Atmosphere-Ocean General Circulation Model, which revealed that the major cause of the observed climate instability was global cooling by a decline in the greenhouse effect.
Climate instability severely impacts both the Earth’s natural environment and human society. In the continued effort for understanding how global warming could affect climate instability, it is important to identify periods in the past that experienced climate instability. These periods need to be studied and modeled to clarify any potential causes of the observed instability. However, little progress has been made in improving our documenting and understanding of climate instability prior to the last glacial period.
The research groups of Dr. Kenji Kawamura and Dr. Hideaki Motoyama (National Institute of Polar Research) analyzed the Second Dome Fuji ice core (Fig. 1, left) that were obtained as part of the Japanese Antarctic Research Expedition (JARE) between 2003 and 2007. Their team reproduced fluctuations in the air temperature and dust (solid particulate mat
Sea Level 2000 years ago higher than today? Roman coastline discovered two miles inland
Dig uncovers Roman invasion coast |
||
An archaeological dig at a Kent fort has uncovered the coastline at the time of the Roman invasion of Britain in 43AD – two miles from today’s shore. The team was excavating a 295ft (90m) stretch of collapsed Roman wall, when they found a small medieval dock. English Heritage archaeologist Tony Wilmott said they then found a “hard surface”, in a water-filled trench, which was the Roman beach. The dig was on previously untouched land at Richborough Roman Fort. Mr Wilmott said: “It is widely known that Richborough Roman Fort was the gateway to Roman Britain 2,000 years ago. “But what is really exciting is that we have actually found the Roman foreshore while digging in a deep trench alongside the remains of a Roman wall. “The bottom of the trench continually fills with water and by trowelling you can feel the hard surface, which was the Roman beach.” He added: “We have long been curious about this fallen Roman fort wall and now we know there was a Roman harbour sitting out there.”
At the start of the dig, local volunteers helped to reclaim the walls from undergrowth, exposing them for the first time since the 1930s. |
||


New report about Antarctica is horrible news for global warming alarmists
By Justin Haskins
Warming on the Antarctic Peninsula has long been touted by supporters of the theory man is destroying the planet by using fossil fuels as proof of the dangers of global warming. Al Gore, the face of the world-is-going-to-end climate movement, has visited Antarctica on at least two occasions to highlight the alleged problem.
“This prediction has proven true,” Gore wrote about the claim Antarctica would warm faster than the global average. “Today, the West Antarctic Peninsula is warming about four times faster than the global average.”
Alarmists say the melting of ice sheets in Antarctica will cause massive problems for the rest of the world. For example, left-wing website ThinkProgress wrote in 2012, “Although the vast ice sheets of the frozen continent are remote from almost all of human civilization, their warming has drastic implications for billions of people. With the melting of those almost inconceivable reserves of ice, the planet’s sea levels are rising. Scientists now expect 21st-century sea level rise — on the scale of three to six feet or more — will be dominated by the melting of the Greenland and Antarctic ice caps.”
Climate realists have rightfully pointed out the evidence shows total ice accumulation on Antarctica has outweighed losses, a claim bolstered by a 2015 NASA study, which found, “An increase in Antarctic snow accumulation that began 10,000 years ago is currently adding enough ice to the continent to outweigh the increased losses from its thinning glaciers.” But even many climate change skeptics have accepted some significant parts of Antarctica are warming.
All that is about to change.
A study published in the journal Science of the Total Environment in February is now getting the attention of prominent climate change skeptics. The study claims the Antarctic Peninsula is cooling and that the previous warming in the second half of the 21st century is “an extreme case.” The researchers also found the recent cooling trend, which they say began in 1998-99, has already had a significant impact on the Antarctic Peninsula’s cryosphere, slowing down “glacier recession.”
According to the authors’ abstract:
…“The Antarctic Peninsula (AP) is often described as a region with one of the largest warming trends on Earth since the 1950s, based on the temperature trend … recorded at Faraday/Vernadsky station. Accordingly, most works describing the evolution of the natural systems in the AP region cite this extreme trend as the
Danish Meteorological Institute Moves To Obscure Recent Record Greenland Ice Growth
German meteorological and climate site Schneefan (snow fan) here writes on the recent changes by the DMI on its Greenland ice mass chart. Personally I wouldn’t be surprised if this were in part due to climate data embarrassment.
Schneefan writes that the Danish Meteorological Institute (DMI) recently changed the reference period for showing the Greenland ice mass: from the warmer 1990-2013 to the internationally usual but colder WMO climate period of 1981-2010.
The change over to the WMO-recommended older and colder reference period has the effect of making the massive ice growth of the past two years with respect to the new mean look smaller, as the current comparison shows (lower chart).

Top: The total daily contribution to the surface mass balance from the entire ice sheet (blue line, Gt/day). Bottom: The accumulated surface mass balance from September 1st to now (blue line, Gt) and the season 2011-12 (red) which had very high summer melt in Greenland. For comparison, the mean curve from the period 1981-2010 is shown (dark grey). The same calendar day in each of the 30 years (in the period 1981-2010) will have its own value. These differences from year to year are illustrated by the light grey band. For each calendar day, however, the lowest and highest values of the 30 years have been left out.“ Source: http://www.dmi.dk/surface-mass-budget/.
By changing the comparison period in April 2017 from 1990-2013 to the older and colder WMO 1981-2010 climate period, the mean shown by the gray line and shaded area is raised. This is illustrated by the thin black lines I’ve added to the two lower charts showing the old mean peak value. Using the 1990-2013 period, the mean peak value was about 550 gigatonnes.
Today using the older and colder WMO 1981-2010 the mean yearly peak rises to about 600 gigatonnes. As a result the current curve shown in blue the strong ice growth during September 2016 becomes less apparent. Moreover, the strong 2015/16 ice year year has been left out (brown curve in the old chart, left).
Foremost by leaving out the strong 2012 melt year (red curve in lower chart), which acted to significantly pull down the 1990-2013 ice mass, and by extending the chart out nine years into the colder past (from 1990 to 1981) the new 1981-1990 mean is considerably higher than the old
Analysis: It’s not just droughts, but nearly all extreme weather is declining or at or near record lows
Climate Depot Special Report
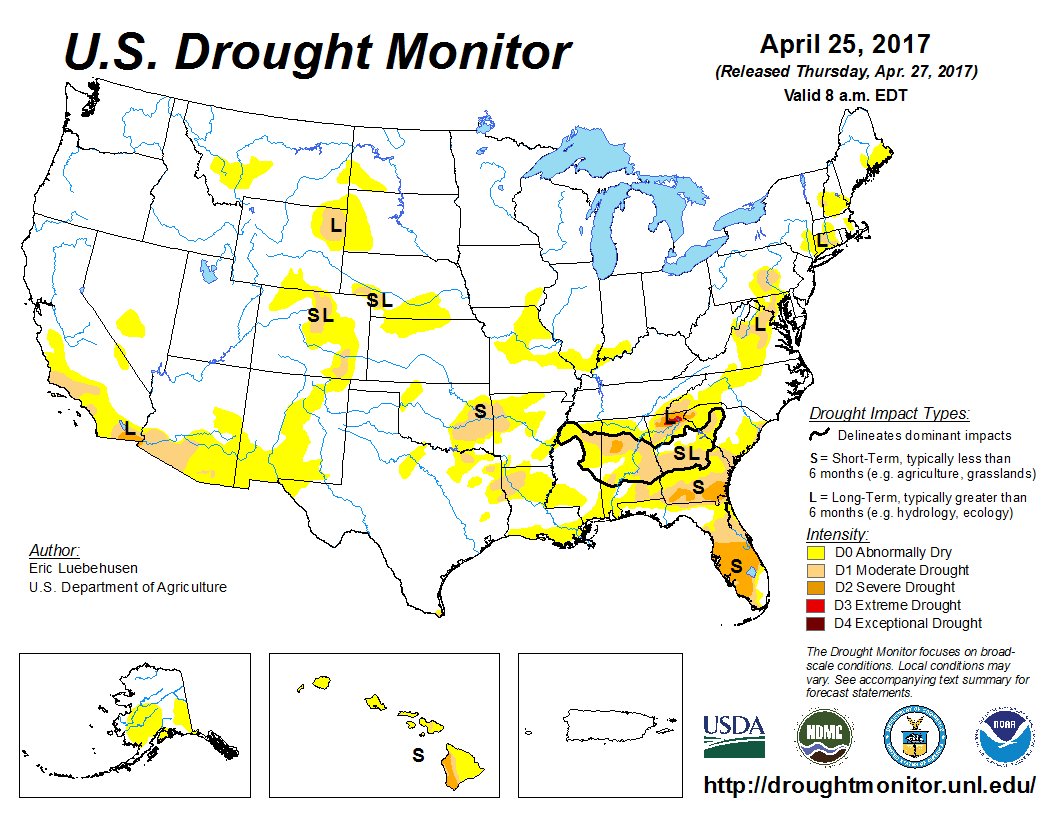
The federal government has just released yet another key piece of scientific data that counters the man-made global warming narrative. The federal U.S. Drought Monitor report shows that droughts in the U.S. are at record lows in 2017. See: Feds: U.S. drought reaches record low in 2017 as rain reigns – Sees lowest levels of drought ever monitored
“Drought in the U.S. fell to a record low this week, with just 6.1% of the lower 48 states currently experiencing such dry conditions, federal officials announced Thursday. That’s the lowest percentage in the 17-year history of the weekly U.S. Drought Monitor report,” USA Today reported on April 27. (Ironically, climate activists had declared California to be in a permanent drought: Flashback 2016: Warmist wrong claim: ‘Thanks El Niño, But California’s Drought Is Probably Forever’)
Former Vice President Al Gore has made extreme weather warnings a staple of his climate change activist. See: Al Gore on the Weather: ‘Every night on the news now, practically, is like a nature hike through the book of Revelations’
Below is a complete rundown of the very latest on extreme weather conditions: Update data from the 2016 Climate Depot report: Skeptics Deliver Consensus Busting ‘State of the Climate Report’ to UN Summit
…Extreme Weather: Scientist to Congress in 2017: ‘No evidence’ that hurricanes, floods, droughts, tornadoes are increasing – Dr. Roger Pielke Jr. of University of Colorado
Hurricanes: 1) Inconvenient NOAA report: ‘It is premature to conclude (AGW has) already had a detectable impact on’ hurricanes & 2) NOAA: U.S. Completes Record 11 Straight Years Without Major (Cat 3+) Hurricane Strike & 3) 30 peer-reviewed scientific papers reveal the lack of connection between hurricanes & ‘global warming’
Floods: ‘Floods are not increasing’: Dr. Roger Pielke Jr. slams ‘global warming’ link to floods & extreme weather – How does media ‘get away with this?’ – Pielke Jr. on how extreme weather is NOT getting worse: ‘Flood
Feds: U.S. drought reaches record low in 2017 as rain reigns – Sees lowest levels of drought ever monitored
By Doyle Rice – USA TODAY
Drought in the U.S. fell to a record low this week, with just 6.1% of the lower 48 states currently experiencing such dry conditions, federal officials announced Thursday.
That’s the lowest percentage in the 17-year history of the weekly U.S. Drought Monitor report. The previous record low occurred in July 2010, when 7.7% of the contiguous U.S. was in a drought.
“Drought has certainly been disappearing at a rapid rate this spring,” said meteorologist Brad Rippey of the U.S. Department of Agriculture. The five-year drought in California is practically over, with only about 8% of the state currently in drought.
The strong El Niño of 2015-16 may have caused the initial decrease last year, he said. “El Niño is historically a ‘drought-breaker,’ while La Niña is a ‘drought-maker.’ ”
A persistent low-pressure area sitting along the west coast of North America this year helped fuel the ongoing wet weather, USDA meteorologist Eric Luebehusen said. Low pressure causes air to rise, which allows clouds and precipitation to form. Those storms and wet weather then typically meander east-northeast across the central U.S., he said.
The current record low is in sharp contrast to September 2012, when drought reached a record high — 65.5% — in the U.S.
Prior to the weekly Drought Monitor, the monthly Palmer Drought Severity Index was the primary method for measuring drought in the U.S., according to Rippey. As recently as June 1993, there was no drought in the continental U.S., that index reported.
Making direct comparisons between the Drought Monitor and Palmer data are difficult, since the drought categorizations are different and the weekly vs. monthly discrepancy is problematic, he added.…