Five Cool Ways to Remind Senators How Biased The Media is About Climate
…Climate Wire: ‘Targets of climate hate mail rally to support one another’ — Features Climate Depot’s Morano As The Villain
Below is full text of Marc Morano, Publisher of Climate Depot’s answers on January 10, 2014 to Stephanie Paige Ogburn of E&E’s Climate Wire:
Morano: ‘It is refreshing to see these scientists finally hear from the public. For years, they have been shielded from public scrutiny as they hyped a man-made global warming crisis. Anyone involved in a public controversy like global warming will get nasty emails. I sure do. See below for sample of my hate mail.
Answers to Ogburn’s questions:
1) How many people, on average, read a given post on your site?
MORANO ANSWER: It depends on the news cycle. According to Google Analytics, from Friday January 3 through January 6 2014. Climate Depot had 492,350 Pageviews and 361,643 Unique Visitors. On any given day the site routinely gets tens of thousands of readers, with individual articles getting nearly as many. the emails posted are on home page, so just one visit to home page and you can access an email if there are any posted that day.
2) How do you find researchers to highlight and what is your decision making process in choosing to spotlight a specific researcher —
ANSWER: I usually go by the outrage factor. When a professor or activist is being particularly ridiculous or insulting, I think I am doing them a favor by posting their publicly available emails addresses.
3) What are you hoping to accomplish when highlighting the work of a researcher on your site?
ANSWER: I hope to draw readers to the to the latest claims and oftentimes the utter silliness of some of the studies, (ie. AGW causes more, rapes, prostitution, bar fights, a storm is an example of of our ‘sins’ and we should ‘repent. Etc.
4) I noted that you often put researchers’ e-mail addresses at the top of your posts. It’s an odd format. Why do you do that?
ANSWER: So readers can drop them a line and to let the professors hear from the public.
5) You are probably aware that researchers often get e-mails about their work when they get publicity. Many of them are not that nice. Do you think your posting their e-mail addresses on your blog contributes to that? Does that concern or worry you?
ANSWER: As I said, all sides of the debate get nasty emails. I hope the professors can hear from the public and not …
Flashback: ‘Hottest’ year claims are ‘purely political statements’ — ‘Claims based on year-to-year temp data that differs by only a few HUNDREDTHS of a degree’ – Even NASA’s Hansen admitted it is ‘not particularly important’
…Veteran meteorologist on extended USA cold blast: ‘WOW F*@*ing WOW’ – ‘Hasn’t seen anything like it since 1918’
…‘Hottest year’ claims exposed: ‘The differences in temperature that they rely on for a judgment that something was warmest are in hundredths of a degree!’ – A fancy way of spinning temp standstill
he differences in temperature that they rely on for a judgment that something was warmest are in hundredths of a degree! …
Real Science: ‘So far, this winter is the coldest since 1979 in the US’
…NASA AND NOAA CONFIRM GLOBAL TEMPERATURE STANDSTILL CONTINUES – ‘Only 0.09 deg C separates top ten warmest years’
Via: http://www.thegwpf.org/nasa-noaa-confirm-global-temperature-standstill-continues/
NASA AND NOAA CONFIRM GLOBAL TEMPERATURE STANDSTILL CONTINUES
Date: 21/01/14
Dr David Whitehouse
In a joint press conference NOAA and NASA have just released data for the global surface temperature for 2013. In summary they both show that the ‘pause’ in global surface temperature that began in 1997, according to some estimates, continues.
Statistically speaking there has been no trend in global temperatures over this period. All these years fall within each other’s error bars. The graphs presented at the press conference omitted those error bars.
When asked for an explanation for the ‘pause’ by reporters Dr Gavin Schmidt of NASA and Dr Thomas Karl of NOAA spoke of contributions from volcanoes, pollution, a quiet Sun and natural variability. In other words, they don’t know.
NASA has a temperature anomaly of 0.61 deg C above the average of 14.0 (1951 – 80) making it the 7th warmest year. Note that it is identical to 2003 and only 0.01 above 2009 and 2006. Taking into account the errors there has been no change since last year.
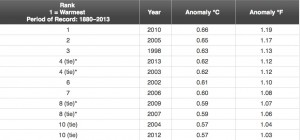
NOAA also has 2013 as the 4th warmest year, at 0.62 deg C above the global 20th century average of 13.9 deg C. Note that only 0.09 deg C separates their top ten warmest years.
Courtesy NOAA. Click on image to enlarge.
Given that the IPCC estimates that the average decadal increase in global surface temperature is 0.2 deg C, the world is now 0.3 deg C cooler than it should have been.
Feedback: [email protected]
Related Links:
Global Temperatures: 10th warmest year on record according to RSS AMSU Satellite

