
Satellite Data: Post El Niño Global Surface Cooling Continues – Pause Extends To 20 Years
Critical German climate site wobleibtdieererwaermung.de (WBDE) reports that the earth’s surface is cooling, and presents the latest chart from NCEP:

As of April 11, the measured global values continue to decline (black curve) as do the computed values for April 18. Source: www.karstenhaustein.com/climate.php.
The time-delayed post El Niño cooling is now showing up in the UAH and RSS satellite data.

Source: UAH Global Temperature Update for March, 2017: +0.19 deg. C
Foremost the atmosphere over the ocean – the largest storage of energy on the planet – cooled significantly over the month of March.
Especially remarkable is the 0.29°K drop in temperature above the global oceans measured by the UAH, and is now only 0.09°K above the WMO 1981-2010 climate mean.
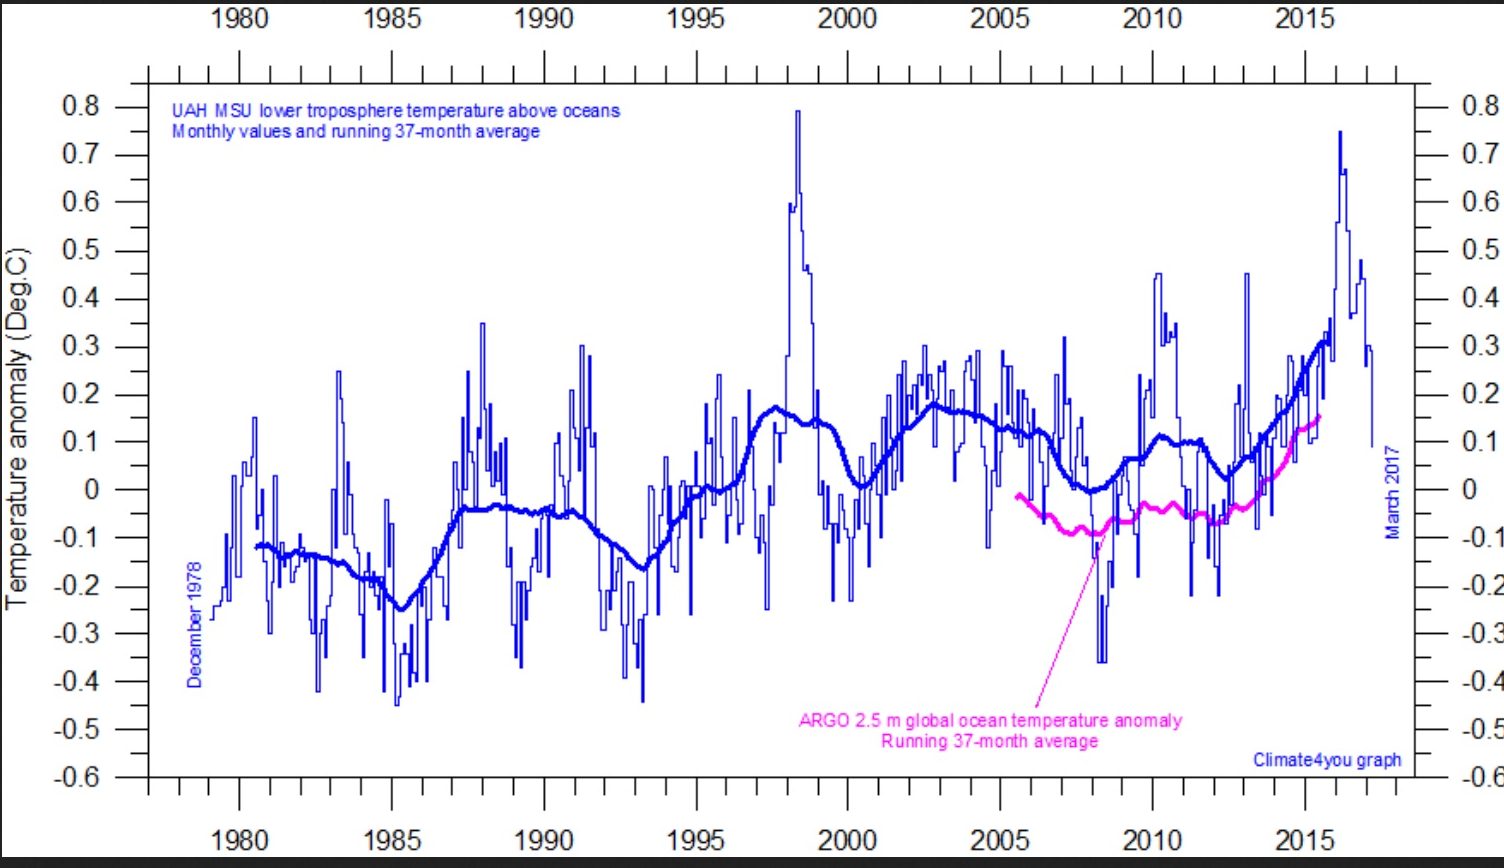
The plot shows the anomaly from the 1981- 2010 mean, UAH satellite temperature in the atmosphere 1500 meters over the sea surface. (TLT). The rose colored curve shows the 37-month running mean of the ARGO buoys which measure the water temperature 2.5 meters below the sea surface. Source: www.climate4you.com/
The RSS satellite data also showed a significant drop in global surface temperature above the seas falling from +0.38°K above the mean to 0.18°K above the mean — a drop of 0.20°K.

Chart: Woodfortrees.org
Although there have been some ups and downs over the past months, the overall global surface temperature trend remains steeply downward, dropping more than 0.6°K since early 2016.
Moreover, the surface temperature above the oceans is significant as the oceans cover more than 70 percent of the earth’s surface.
The overall negative linear trend will likely continue over much of 2017 as the delayed effects of the disappeared El Niño work their way into the satellite data.
So is the pause over? WBDE writes:
Despite the warming effect of the powerful 2015/16 El Niño, the unfalsified satellite date show that the year 2016 did not produce any new significant global heat record compared to the 1998 El Niño year. […]
The claimed global warming by the IPCC climate models has been missing for almost 20 years! And that with continuously rising atmospheric CO2 concentrations!”
The question remains: what happens in the years and decade that follow? A new slightly higher plateau, or stuck at the current old plateau?
– See more at: http://notrickszone.com/2017/04/12/satellite-data-post-el-nino-global-surface-cooling-continues-pause-extends-to-20-years/#sthash.2XPmxaYl.dpuf…
DESPITE NOAA DENIAL, GROWING NUMBER OF NEW STUDIES CONFIRM GLOBAL WARMING HIATUS
Despite widespread denial among climate activists, a growing number of scientific research papers in recent months have confirmed the global warming hiatus, trying to explain its possible reasons (for the latest studies see here, here and here). The latest study claims that the Southern Ocean played a critical role in the global warming slowdown.


The post-2002 global surface warming slowdown caused by the subtropical Southern Ocean heating acceleration
Geophysical Research Letters, 27 March 2017
Abstract: The warming rate of global-mean surface temperature slowed down during 1998-2012. Previous studies pointed out role of increasing ocean heat uptake during this global warming slowdown, but its mechanism remains under discussion. Our numerical simulations, in which wind stress anomaly in the equatorial Pacific is imposed from reanalysis data, suggest sub-surface warming in the equatorial Pacific took place during initial phase of the global warming slowdown (1998–2002), as previously reported. It is newly clarified that the Ekman transport from tropics to subtropics is enhanced during the later phase of the slowdown (after 2002) and enhanced subtropical Ekman downwelling causes accelerated heat storage below depth of 700 m in the subtropical Southern Ocean, leading to the post-2002 global warming slowdown. Observational data of ocean temperature also support this scenario. This study provides clear evidence that deeper parts of the Southern Ocean play a critical role in the past-2002 warming slowdown.…
Pause Or Not, Climate Models Continue To Grossly Overstate Global Temperature Trends
What follows is a wrap up of an article written by skeptic climate and weather site wobleibtdieerderwaermung.de here.
It writes that for thousands of years it has been the solar and ocean cycles that have been influencing the weather worldwide and in Germany.
And looking at data objectively, it is pretty clear that there is little relationship between weather/climate and the rising CO2 concentrations in the atmosphere, as the global warming pause between 1997-2016 shows:

Linear trend of RSS temperatures. No warming in 224 months despite the current powerful El Niño-event. “The least-squares linear-regression trend on the RSS satellite monthly global mean surface temperature anomaly dataset shows no global warming for 18 years 8 months since May 1997, though one-third of all anthropogenic forcings have occurred during the period of the Pause.“ Source: The Pause hangs on by its fingernails.
Naturally climate models continue to grossly overstate the trend for global temperature:

IPCC climate models obviously have assumed an excessively high value for CO2 climate sensitivity. Source: On Natural Climate Variability and Climate Models.
The IPCC climate model projections diverge increasingly from the measured reality, year after year.
In fact new studies have clearly exposed three decisive errors in the programming of climate models:
1. The cooling effect of aerosols has been over-estimated by a factor of 2: Hamburg Max Planck Institute for Meteorology: Aerosols cool less than originally thought.
2. The warming effect of CO2 in in the atmosphere is as a result overestimated by a factor of 2 or three. See: Die kalte Sonne site here (German).
3. The complex effect of fluctuations in solar activity are poorly accounted for in climate models. Solar Forcing of Climate – NIPCC
The consequences: All parameters when used realistically lead to a considerably lower global and regional warming — especially in the future, see following chart:
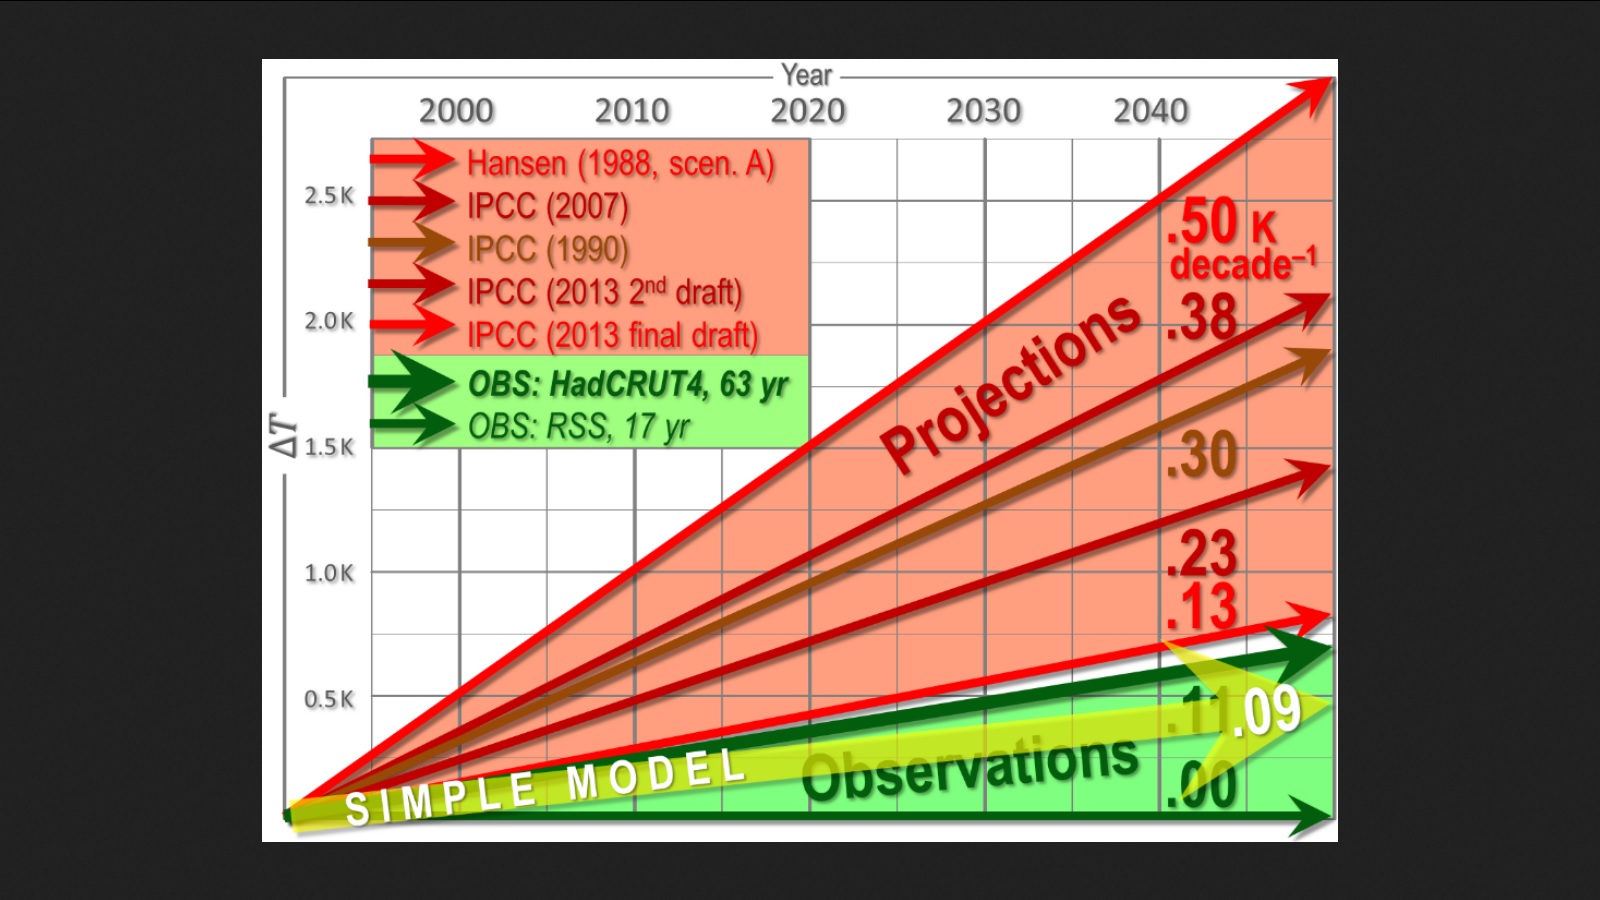
Source: Peer-reviewed pocket-calculator climate model
It’s time to end the hysteria surrounding CO2 and its grossly exaggerated effects on climate and the ridiculous efforts of protecting the climate on every point on the planet every day for 30 years (whose statistical average is the World Meteorological Organization’s definition of climate). Very little can be accomplished trying, and the price would be enormous and ruinous.
– See more at: http://notrickszone.com/2017/04/08/pause-or-not-climate-models-continue-to-grossly-overstate-global-temperature-trends/#sthash.ozs3j696.dpuf…
Earth Cools: Global Temperatures Drop To Pre-El Nino Levels
The recent El Nino is cooling down as shown clearly in both sea surface temperatures and lower troposphere air temperatures. The two relevant data sets are UAH v.6 and HadSSTv3.1 now provide averages for the month of March 2017. The cooling pattern continues in the tropical seas while ocean temperatures in the Northern Hemisphere (NH) are flat.
Analysis finds NOAA satellite data is incompatible with theory of man-made global warming
Analysis finds NOAA satellite data is incompatible with theory of man-made global warming Previous posts by Dr. Noor van Andel have demonstrated that the theory of anthropogenic global warming [AGW] is falsified by observations over the past 62 years which show outgoing radiation from greenhouse gases has significantly increased, rather than decreased as predicted by the AGW theory.
STUDY: Current Global Warming Is ‘Not Outside The Range Of Natural Variations’
A UK-based climate policy group has put out an annual climate assessment “exclusively on observations rather than climate models” to serve as a counterpoint to those put out by the United Nations and government agencies that warn of unabated global warming.
The Global Warming Policy Foundation’s (GWPF) climate assessment, like the World Meteorological Organization (WMO), noted 2016 was likely the warmest year on record due to an incredibly strong El Niño warming event that boosted tropical ocean temperatures starting in 2015.
That’s about all the GWPF’s report has in common with the WMO’s assessment for 2016, which warns “the influence of human activities on the climate system has become more and more evident.”
“There is little doubt that we are living in a warm period,” said Ole Humlum, a physical geography professor at the University Centre in Norway and author of the GWPF report.…
‘Global warming’ dominated by ‘fake news’ fueled by manipulated data

For decades, we’ve heard the Chickens Little cry that the sky is warming. Then, in 2009, a hack of climate researchers’ emails at the University of East Anglia indicated that things weren’t quite on the up-and-up, science-wise. Climatologists had massaged global temperature records to bolster their claims of man-made global warming, and they had destroyed emails to skirt FOIA requests. “Climategate,” as it came to be called, suggested that many of the alarming reports about global warming had been fake news.
It happened again about a month ago. On February 4, Dr. John Bates, “senior scientist” at NOAA’s temperature data center (until his retirement in late 2016), reported that his own organization had not quite been on the up-and-up, science-wise. He alleged that Thomas Karl, director of the temperature data center (until his own retirement earlier last year), had “breached [NOAA’s] own rules on scientific integrity when [he] published [a] sensational but flawed report” and rushed it into print in order to influence global leaders at the U.N. Climate Conference in Paris in 2015.
That paper, called the “Pausebuster,” cited new data purporting to show that the hiatus in global warming since 1998 had not occurred. According to Dr. Bates, however, Dr. Karl had put his “thumb on the scale” by releasing new data that were “misleading” and “unverified.” Furthermore, it is unlikely ever to be verified: Dr. Bates also reported that the computer used to process the data “had suffered a complete failure.” Hello, Climategate 2.0!
Oh, you’d never heard of it? I bet you’ve heard a lot about the 2015 Paris Climate Accords that were agreed to in part because of the fake “Pausebuster” data. But the mainstream media have little interest writing stories that refute liberal assumptions, so fake news becomes no news. To hear about Climategate 2.0, you’d have to follow alternative sources like Manhattan Contrarian (where I first learned of it), or Judith Curry, or Watt’s Up with That?, or the U.K.’s Daily Mail.
This pattern of fake news followed by no news has been repeated throughout the era of climate change fabulist fear-mongering. In 1989, according to the Associated Press, a director of the United Nations Environmental Program (UNEP) predicted that “entire nations could be wiped off the face of the earth by rising sea levels … by the year 2000.” This was followed by no news
Analysis: How The Recent El Nino Saved Climate Models
How The Recent El Nino Saved Climate Models
http://www.thegwpf.com/how-the-recent-el-nino-saved-climate-models/
The message one is trying to get across when communicating science can depend much on what one doesn’t say. Leaving something vital out can make all the difference and when it’s done it can make scientists look like politicians, although not sophisticated ones. As an example of what I mean consider the El Nino phenomenon – a short-term oceanographic weather event. The El Nino can be used to make computer climate models look better than they are, for a short time at least. It is obvious that computer models are running hotter than the observations over the past 30 years, but add the recent 2015-6 El Nino and things look much better. Let me show you an example of this. Recently a group of academics kindly produced a graph intended to “help” journalists. They labeled it, “selflessly helping the Mail Online to improve their science coverage.” It shows how the HadCRUT4 global surface temperature data is “still rising” which is laid over climate models showing how accurately the models simulate the data. It is a classic example of misinformation by omission, or in other words how to enlist the short-term 2015-6 El Nino weather event to rescue long-term computer models. It is a prime example of bad science communication. Also shown is how this trick can be applied to satellite data. Let’s see what it looks like when the unmarked El Nino on the graph starts to come down, as it has done. Another variation of this technique can be seen in a recent TV interview of Lawrence Livermore National Laboratory scientist Ben Santer by Seth Myres. Guest and presenter took aim at Senator Ted Cruz’ comments that satellite data show no warming in 17 years. SANTER: Listen to what he said. Satellite data. So satellite measurements of atmospheric temperature show no significant warming over the last 17 years, and we tested it. We looked at all of the satellite data in the world, from all groups, and wanted to see, was he right or not? And he was wrong. Even if you focus on a small segment of the now 38-year satellite temperature record — the last 17 years — he was demonstrably wrong. More importantly, if you look at the entire record it shows strong evidence of a human effect on climate. Warming of the lower atmosphere. Cooling of …
Sign the Petition: Investigate NOAA impartially – No Warmist Whitewash!
…Listen Now: Morano: NOAA RESEARCHERS VIOLATED AGENCIES DATA QUALITY
MARC MORANO: NOAA RESEARCHERS VIOLATED THE AGENCIES DATA QUALITY AND STORAGE STANDARDS
Decorated National Oceanic and Atmospheric Administration research scientist John Bates has become a whistleblower, disclosing NOAA scientist violated agency protocols in a rush to publish unverified research for political reasons.
Marc Morano publisher of Climate Depot discusses the growing scandal surrounding newly retired decorated National Oceanic and Atmospheric Administration research scientist John Bates decision to become a whistleblower and disclose how NOAA scientist violated agency protocols in a rush to publish unverified research that purported to show there had been no 18 year long pause in rising temperatures as every other temperature data set in the world recorded, rather temperatures had risen at an alarming rate. The scientists violated the agency’s rules, rushing to publication data which had yet to be tested and confirmed in order to influence the outcome of the Paris climate negotiations in 2015. In a second breach of agency protocol, the scientists failed to properly archive and store their datasets. Subsequently, some of the original data sets were lost when the computer used to process the data suffered a complete failure.
Morano says the NOAA researchers learned nothing from the Climategate scandal of 2009, ignoring the need for transparency and accountability bringing climate science into further disrepute and public mistrust.