
Warmists have just lost the Antarctic peninsula: Temperature shifted from a warming trend to a cooling trend
Via: http://antigreen.blogspot.com/2017/04/warmists-have-just-lost-antarctic.html
The peninsula was the only bit of the Antarctic that suited the Warmists. They gleefully reported glacial breakups there, quite ignoring that the Antarctic as a whole was certainly not warming and was in fact tending to cool. The study below however shows that the warmer period on the peninsula was an atypical blip that has now reversed
Recent regional climate cooling on the Antarctic Peninsula and associated impacts on the cryosphere
M. Oliva et al.
Abstract
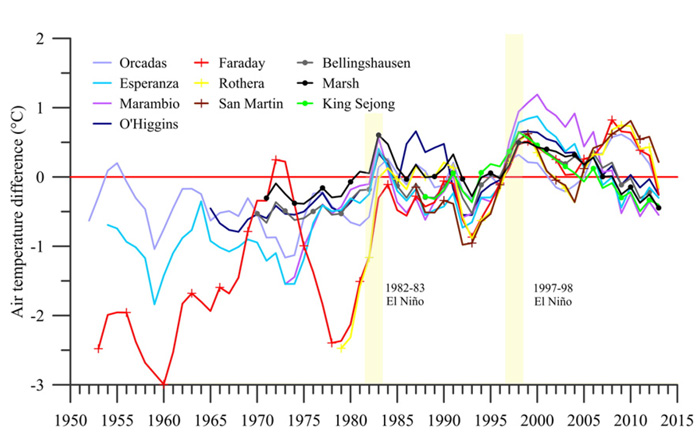
The Antarctic Peninsula (AP) is often described as a region with one of the largest warming trends on Earth since the 1950s, based on the temperature trend of 0.54 °C/decade during 1951–2011 recorded at Faraday/Vernadsky station. Accordingly, most works describing the evolution of the natural systems in the AP region cite this extreme trend as the underlying cause of their observed changes. However, a recent analysis (Turner et al., 2016) has shown that the regionally stacked temperature record for the last three decades has shifted from a warming trend of 0.32 °C/decade during 1979–1997 to a cooling trend of − 0.47 °C/decade during 1999–2014. While that study focuses on the period 1979–2014, averaging the data over the entire AP region, we here update and re-assess the spatially-distributed temperature trends and inter-decadal variability from 1950 to 2015, using data from ten stations distributed across the AP region. We show that Faraday/Vernadsky warming trend is an extreme case, circa twice those of the long-term records from other parts of the northern AP. Our results also indicate that the cooling initiated in 1998/1999 has been most significant in the N and NE of the AP and the South Shetland Islands (> 0.5 °C between the two last decades), modest in the Orkney Islands, and absent in the SW of the AP. This recent cooling has already impacted the cryosphere in the northern AP, including slow-down of glacier recession, a shift to surface mass gains of the peripheral glacier and a thinning of the active layer of permafrost in northern AP islands.
Science of The Total Environment. Volume 580, 15 February 2017, Pages 210–223
#
Related Links:
Antarctica: Via: Skeptics Deliver Consensus Busting ‘State of the Climate Report’ to UN Summit
NASA Study: ‘Antarctica is not currently contributing to sea level rise’ – ‘Mass Gains of Antarctic Ice Sheet Greater than Losses’ – Zwally’s team calculated that the mass gain from the thickening of East …
Oh No! Global warming will cause increase in exercise — But exercise increases global warming!
Flashback 2007: Exercise Causes Global Warming – Walking to the Shops ‘Damages Planet More Than Going By Car’
By Noel Sheppard | August 8, 2007 – Newsbusters

As reported by the Times Online Saturday in a piece hysterically titled “Walking to the Shops ‘Damages Planet More Than Going By Car'” (grateful h/ts to all NBers and readers who forwarded this article for consideration, emphasis added throughout):
Walking does more than driving to cause global warming, a leading environmentalist has calculated.
Food production is now so energy-intensive that more carbon is emitted providing a person with enough calories to walk to the shops than a car would emit over the same distance. The climate could benefit if people avoided exercise, ate less and became couch potatoes. Provided, of course, they remembered to switch off the TV rather than leaving it on standby.
Absolutely amazing. But there was more:
The sums were done by Chris Goodall, campaigning author of How to Live a Low-Carbon Life, based on the greenhouse gases created by intensive beef production. “Driving a typical UK car for 3 miles [4.8km] adds about 0.9 kg [2lb] of CO2 to the atmosphere,” he said, a calculation based on the Government’s official fuel emission figures. “If you walked instead, it would use about 180 calories. You’d need about 100g of beef to replace those calories, resulting in 3.6kg of emissions, or four times as much as driving.
“The troubling fact is that taking a lot of exercise and then eating a bit more food is not good for the global atmosphere. Eating less and driving to save energy would be better.”
Now, just imagine where this insanity could go:
- Gymnasiums and athletic clubs closed to slow global warming
- Jogging made illegal to slow global warming
- Golf banned to slow global warming
- All organized sporting events including amateur, collegiate and professional banned to slow global warming.
Is it becoming obvious the amount of control environmentalists seek over personal behavior all in the name of global warming?…
Study in Nature: 21 climate models find climate change ‘may increase net recreational physical activity in U.S.’ by 2099
Here’s abstract of Nature Human Behavior paper on global warming predictions of exercise rates in next 40-80 years.
Regular physical activity supports healthy human functioning1,
 …
…
New Study impresses AP’s Seth Borenstein – Uses ‘extensive computer models’ to find ‘man-made extreme weather has hit all over the world’
By SETH BORENSTEIN
Published: Yesterday
In a first-of-its-kind study, scientists analyzed weather stations worldwide and calculated that in 85 percent of the cases, the record for hottest day of the year had the fingerprints of climate change. Heat-trapping gases from the burning of coal, oil and natural gas made those records more likely or more intense.
“The world is not quite at the point where every hot temperature record has a human fingerprint, but it’s getting close to that,” said lead author and Stanford University climate scientist Noah Diffenbaugh.
Climate change’s influence was spotted 57 percent of the time in records for lowest rainfall in a year and 41 percent of the time in records for most rain in a 5-day period, according to the study in Monday’s Proceedings of the National Academy of Sciences.
For the last several years, researchers have come up with a generally accepted scientific technique to determine whether an individual weather extreme event was made more likely or stronger because of climate change. It usually involves past weather data and extensive computer models that simulate how often an event would happen with no warming from greenhouse gases and compare that to how often it does happen.
Outside scientists said what makes Diffenbaugh’s study different and useful is that he doesn’t look at an individual event such as California’s five-year drought. Instead, he applies the technique to weather stations as a whole across the world, said Columbia University climate scientist Adam Sobel, who wasn’t part of new work.
“This is a step forward in that it allows general statements about what fraction of events of the given types selected have a statistically significant” human influence, Sobel said in an email.…
New Climate Study Calls EPA’s Labeling Of CO2 A Pollutant ‘Totally False’
A new study published by seasoned researchers takes aim at the heart of the Environmental Protection Agency’s (EPA) authority to issue regulations to curb carbon dioxide emissions.
The study claims to have “proven that it is all but certain that EPA’s basic claim that CO2 is a pollutant is totally false,” according to a press statement put out by Drs. Jim Wallace, John Christy and Joe D’Aleo.
Wallace, Christy and D’Aleo — a statistician, a climatologist and meteorologist, respectively — released a study claiming to invalidate EPA’s 2009 endangerment finding, which allowed the agency to regulate CO2 as a pollutant.
“This research failed to find that the steadily rising atmospheric CO2 concentrations have had a statistically significant impact on any of the 14 temperature data sets that were analyzed,” the authors say in the release for the second edition of their peer-reviewed work.
“Moreover, these research results clearly demonstrate that once the solar, volcanic and oceanic activity, that is, natural factor, impacts on temperature data are accounted for, there is no ‘record setting’ warming to be concerned about,” the researchers say. “In fact, there is no natural factor adjusted warming at all.”
The study is intended to bolster a petition Wallace and D’Aleo filed with EPA as part of the Household Electricity Consumers Council (CHECC), asking the agency to reconsider its endangerment finding.
The libertarian Competitive Enterprise Institute (CEI) also filed a petition with EPA to reconsider the endangerment finding. The Trump administration has not indicated whether or not they will reconsider the Obama-era finding. Any challenge would be met with legal action from environmental activists.…
Research Report Disproves the Alarmists’ Basic Claims About CO2
This report and the earlier edition go far beyond this by disproving the alarmists’ basic claim that increases in atmospheric CO2 result in global warming. The Research Report results can be replicated using the basic data that the authors are willing to provide, most unlike the elaborate global climate models relied on by climate alarmists. Both the First and Second Editions have been extensively peer reviewed by experts in the relevant fields. So the reports have all the characteristics of good science, and should have the support of anyone who supports science, which the marchers claim to represent.
Climate skeptics have long argued that fluctuations in global temperatures are not primarily due to human-caused emissions of CO2 from using fossil fuels to improve their lives, and have generally attributed these fluctuations to changes in the sun, our source of heat and light. The importance of solar variations and other natural fluctuations has now been shown to be the case despite many tens of billions of taxpayer dollars spent by the US and other governments to try to disprove the obvious and mislead the public on this central scientific issue in the climate debate.…
Live Poor & ‘Green!’: World’s ‘Greenest’ People Live In Ridiculously Poor Authoritarian Regimes
By ANDREW FOLLETT – Daily Caller
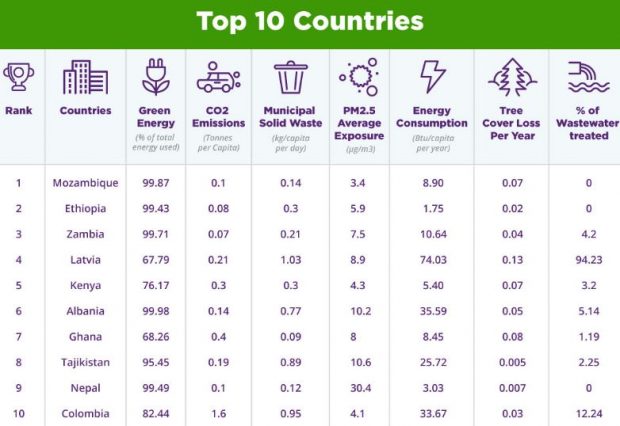
A new report ranking countries with “the most environmentally friendly people” shows the greenest nations are also some of the poorest in the world.
A MoneySuperMarket report listed Mozambique, Ethiopia and Zimbabwe as having “the most environmentally friendly people in the world,” while ranking Americans as being some of the least eco-friendly people on the planet. That may not be a bad thing, though, given the greenest countries also tend to be poor and run by authoritarian regimes.
“At the top of the list, people from Mozambique have the least impact of anyone anywhere – using almost 100 per cent green energy, producing almost no carbon dioxide and creating almost no waste,” MoneySuperMarket said in a statement. “Their only disadvantage is that they don’t treat any of their wastewater, so anything that gets poured away stays as it is.”
The average person living in Mozambique earned $511.47 a year in 2015, which was 4 percent of the global average. Mozambique is ruled by an authoritarian-leaning “hybrid regime,” according to the Economist’s Democracy Index.
Likewise, the Economist lists Ethiopia’s government as an authoritarian regime, and Zambia is listed as having a “hybrid regime.” Ethiopia’s average resident earned $1,529.89 a year in 2015, and the average Zambian earned only $3,602.33. In contrast, the average American earned nearly $52,000 a year.
(Graphic: Courtesy of MoneySuperMarket)
In fact, there is not a single “full democracy” listed in the top 10 of MoneySuperMarket’s report. Three countries are listed as “flawed democracies,” four as “hybrid regimes” and three as authoritarian states.
The average person living in on of those 10 countries had an annual income of $3,640.83 in the year 2015 – nearly five times below the global average annual income of $17,760 in that year.
(Graphic: Courtesy of MoneySuperMarket)
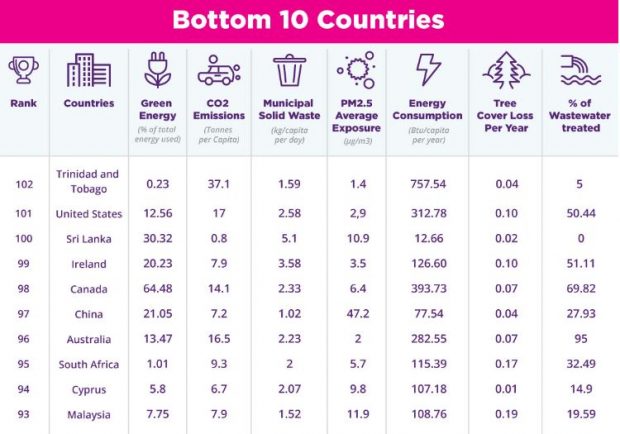
The 10 least green countries listed in MoneySuperMarket’s report were far richer and more democratic than the greenest countries. Four of the 10 countries had “full democracy,” five were listed as “flawed democracies” and only China was listed as authoritarian.…
Believe It! Global Warming Hiatus Real, Chinese And Japanese Scientists Affirm
Slowdown: The braked warming of the last one and a half decades and its reasons
By Dr. Sebastian Lüning und Prof. Fritz Vahrenhholt
(German text translated by P Gosselin)
Stefan Rahmstorf is against the notion of a warming hiatus. In his eyes it doesn’t exist. Instead he prefers to live in his Rahmstorfian world, where every thing is the way it’s supposed to be: warming is galloping along. It’s a strange parallel world that has nothing to do with reality.
The rest of the scientific community, fortunately, see things somewhat more realistically and are busily publishing papers on the reasons for the hiatus or slowdown. The Institute for Atmospheric Physics of the Chinese Academy of Sciences has even issued a press release on the subject:
New Study Reveals the Atmospheric Footprint of the Global Warming Hiatus
The increasing rate of the global mean surface temperature was reduced from 1998 to 2013, known as the global warming hiatus or pause. Great efforts have been devoted to the understanding of the cause. The proposed mechanisms include the internal variability of the coupled ocean-atmosphere system, the ocean heat uptake and redistribution, among many others. However, the atmospheric footprint of the recent warming hiatus has been less concerned. Both the dynamical and physical processes remain unclear.
In a recent paper published in Scientific Report, LIU Bo and ZHOU Tianjun from the Institute of Atmospheric Physics, Chinese Academy of Sciences have investigated the atmospheric anomalous features during the global warming hiatus period (1998-2013). They show evidences that the global mean tropospheric temperature also experienced a hiatus or pause (Fig. 1). To understand the physical processes that dominate the warming hiatus, they decomposed the total temperature trends into components due to processes related to surface albedo, water vapor, cloud, surface turbulent fluxes and atmospheric dynamics. The results demonstrated that the hiatus of near surface temperature warming trend is dominated by the decreasing surface latent heat flux compared with the preceding warming period, while the hiatus of upper tropospheric temperature is dominated by the cloud-related processes. Further analysis indicated that atmospheric dynamics are coupled with surface turbulent heat fluxes over lower troposphere and coupled with cloud processes over upper troposphere.
Figure 1. (a) Global mean temperature anomalies from 1950 to 2015 and (b) linear trends of global mean temperature for near surface (i.e. the lowest atmospheric layer), and

Study: ANTARCTIC PENINSULA COOLED NEARLY 1°C DURING 1999–2014
CO2 Science Magazine
Warming trends that were once among the highest recorded on earth have slowed and even reversed to show cooling.
Climate alarmists generally contend that current temperatures are both unnatural and unprecedented, as a result of global warming caused by anthropogenic CO2 emissions; and they claim that this “unnaturalness” is most strongly expressed throughout the world’s polar regions. In this regard, they often point to warming on the Antarctic Peninsula (typically the Faraday/Vernadsky station) as the proverbial canary in the coal mine, where over the past several decades it has experienced warming rates that are among the highest reported anywhere on Earth.
However, in recent years two studies have challenged this assessment. Carrasco (2013) reported finding a decrease in the warming rate from stations on the western side of the Antarctic Peninsula between 2001 and 2010, as well as a slight cooling trend for King George Island (in the South Shetland Islands just off the peninsula). Similarly, in an analysis of the regional stacked temperature record over the period 1979-2014, Turner et al. (2016) reported a switch from warming during 1979-1997 to cooling thereafter (1999-2014). And now, in 2017, we have a third assessment of recent temperature trends on the Antarctic Peninsula confirming that the canary is alive and well!
As their contribution to the debate, Olivia et al. (2017) report in the journal Science of the Total Environment how they “complete and extend [the study of Turner et al.] by presenting an updated assessment of the spatially-distributed temperature trends and interdecadal variability of mean annual air temperature and mean seasonal air temperature from 1950 to 2015, using data from ten stations distributed across the Antarctic Peninsula region.” And what did that assessment reveal?
In describing their findings, the eight European researchers write “we show that [the] Faraday/Vernadsky warming trend is an extreme case, circa twice those of the long-term records from other parts of the northern Antarctic Peninsula.” They …
New Paper: N. Hemisphere Temps Rose 4–5°C Within ‘A Few Decades’ 14,700 Years Ago – 40 Times Faster Than Today’s Rates
Temperatures, Sea Levels ‘Naturally’ Rise
30 – 40 Times Faster Than Today’s Rates
Modern Temperatures Only Rising 0.05°C/Decade
Since 1850, CO2 concentrations have risen from 285 ppm to 400 ppm. During these ~165 years, the IPCC has concluded that surface temperatures have warmed by 0.78°C. This is a warming rate of only 0.05°C per decade for 1850-2012 — which happens to be the same rate of warming over the 1998-2012 period.
IPCC AR5 (2013): “The globally averaged combined land and ocean surface temperature data as calculated by a linear trend, show a warming of 0.85°C over the period 1880 to 2012, when multiple independently produced datasets exist. The total increase between the average of the 1850–1900 period and the 2003–2012 period is 0.78 °C, based on the single longest dataset available 4 (see Figure SPM.1). … [T]he rate of warming over the past 15 years (1998–2012; 0.05 °C per decade), which begins with a strong El Niño, is smaller than the rate calculated since 1951 (1951–2012; 0.12 °C per decade).”
Modern Sea Levels Only Rising 0.17 Of A Meter/Century
IPCC AR5 (2013): “[T]he rate of global averaged sea level rise was 1.7 mm yr between 1901 and 2010“
Historical Hemispheric Temperatures Rose 2.0°C/Decade
According to a new paper, the Bølling Warming event 14,700 years ago raised the surface temperature for the entire Northern Hemisphere by 4 to 5°C within a few decades. This is a hemispheric warming rate of approximately 2.0°C per decade, which is 40 times faster than the 0.05 °C per decade global warming rate since 1850 (and 1998).
Historical Sea Levels Rose 5.3 Meters/Century
Central Greenland’s surface temperatures rose by as much as 12°C during this time frame (14,700 years ago to 14,500 years ago). Consequently, glaciers and ice sheets disintegrated rapidly and sea levels rose by about 18 meters (“12-22 m”) in 340 years. An 18 m rise in 340 years is the equivalent of 5.3 meters per century, which is more than 30 times faster than the rate of sea level change (0.17 m per century) between 1901 and 2010.