
Analysis: NOAA rain modeling study ‘has no scientific basis, and ignores all available actual data’ – ‘Man-Made Modeling Abuse Increases The Odds Of NOAA Fraud’
NOAA says that nearly a foot of rain in one day in Louisiana confirms their models showing man-made climate change has increased the odds of floods.
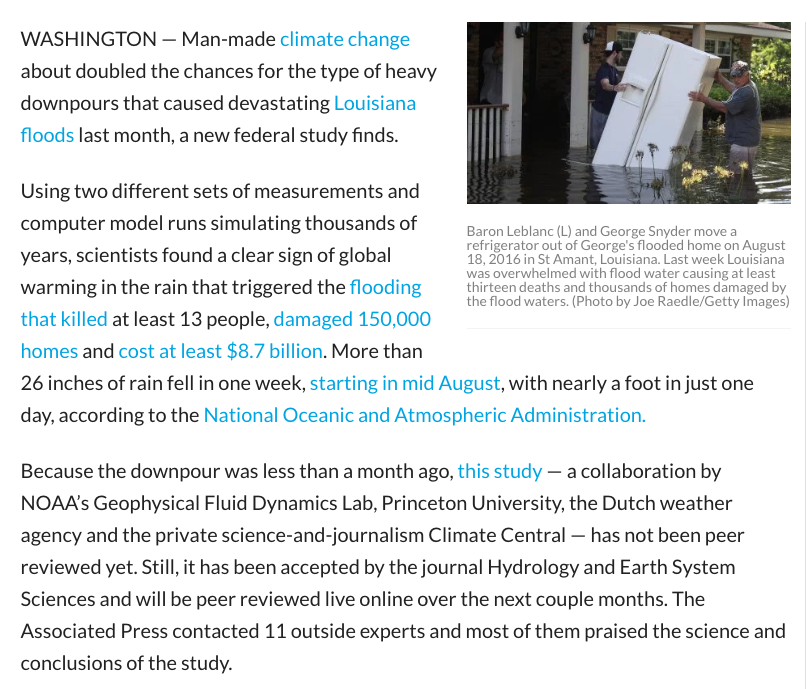
NOAA: Climate Change increased odds for Louisiana downpour | FOX 61
On April 15, 1927 New Orleans got 15 inches of rain in 18 hours during the largest flood in US history.
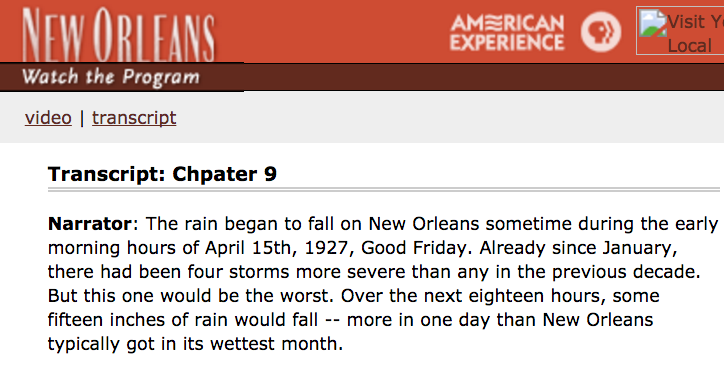
American Experience | New Orleans | PBS
New Orleans was founded in 1717, against the objections of the chief engineer who said it flooded all the time.
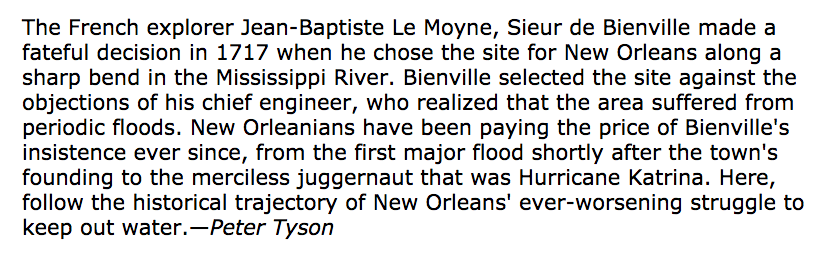
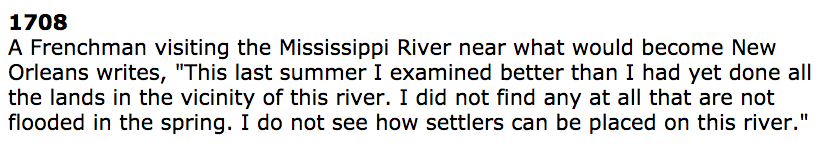
NOVA | Storm That Drowned a City | A 300-Year Struggle | PBS
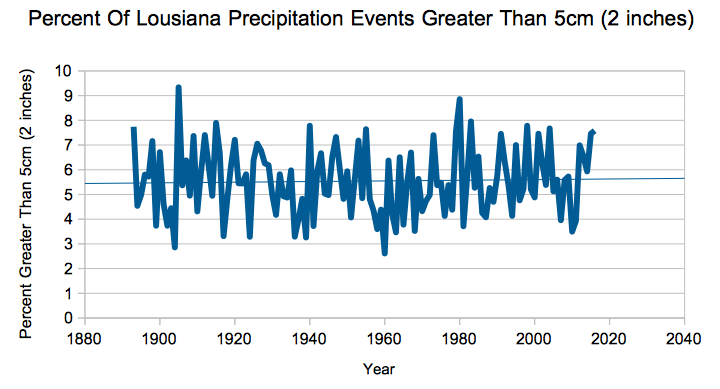
There has been no increase in heavy rain.
The NOAA study has no scientific basis, and ignores all available actual data. Software models can be written to produce any result the author wants to produce. They are not evidence of anything other than deep corruption at NOAA.…
Tipping Points Postponed Again: Arctic Sea Ice Refuses To Melt – No Real Shrinking In 10 Years
Japanese climate blogger Kirye caught my eye here at Twitter when posting a comparator chart of Arctic sea ice extent (and thickness) for 2007, 2015 and this year (2016) for September 4. In a nutshell, what is all the alarm about?
She comments that “Arctic ice is not doomed in the real world.” Clearly Arctic sea ice this summer will most likely not set a new record. There’s far more ice up there then what global warming alarmists hysterically projected earlier.
Also a recent chart of Arctic sea ice extent by the National Snow Ice and Data Center (NSIDC) shows that current sea ice extent is some half a million square kilometers over the 2012 level:

Source: NSIDC
Clearly over the past years Arctic sea ice has refused to have anything to do with the often claimed “death spiral” and alarmists are always forced to go back a number of years in order to get the sharp downward overall trend they want to see.
Lately, however, it has not been downward at all.
No downward trend over past decade
Looking back at the past 10 years, we see there has been practically no downward trend whatsoever. A chart generated at Woodfortrees here for the past 10 years clearly illustrates this:

No melt in 10 years! Chart: Woodfortrees
Clearly the Arctic is nowhere near a death spiral, and the polar ice has in fact defied the models and the many earlier predictions that it would disappear by 2015 altogether. With all that ice still up there, it’s time for the sea ice and global warming modelers to discard their equations – and to start over again from scratch.
With millions of square kilometers of ice still up there reflecting summer radiation back into space, it’s time readjust the energy budget.
Tipping points postponed again!…
Green Party Prez Candidate Jill Stein Predicts One Foot Of Sea Level Rise Per Year
Jill Stein says NASA’s James Hansen predicts 50 feet of sea level rise in the next 50 years, but NOAA is more conservative at only 10 feet.

The people at NOAA who actually study sea level say it is rising less than seven inches per century.

the absolute global sea level rise is believed to be 1.7-1.8 millimeters/year.
On September 8, 1900 – sea level at Galveston, Texas rose 18 feet in one hour.

The storm killed 10,000 people, whose bodies were dumped at sea. But the bodies washed back so they had to burn them.

CO2 was 300 PPM at the time.…
‘Record hottest year’ means record high bumper wheat crop — opposite of crop models

Last year there were warnings from crop modelers in Nature that heat kills wheat and yields were going to fall in the “near future”, if temperatures rose. In fact global warming was “already slowing wheat gains”. What followed was a record El Nino, and 2015 was the hottest ever year, with 2016 vying to beat it. But instead of wheat doom, this month the USDA forecasts a record yield of wheat with bumper crops globally. Wheat output has grown in Australia, the US, Russia, Ukraine, everywhere pretty much, except the EU where it has been too rainy. Where are the mea culpas? h/t to the GWPF
Jan 2015, published in Nature. “Global Wheat Yield May Drop as Temperatures Rise”
“… researchers are now letting farmers know that the world’s wheat yields are excepted decline in the near future, with the world standing to lose six percent of its wheat crop for every degree Celsius that the annual global temperature increases.
“The simulations with the multi-crop models showed that warming is already slowing yield gains, despite observed yield increases in the past, at a majority of wheat-growing locations across the globe,” researcher Senthold Asseng, at the University […]
Warmists Choke On Record Wheat Crop
http://us4.campaign-archive2.com/?u=c920274f2a364603849bbb505&id=e781d5e165&e=96bb006873
|
||
 Any fool can extrapolate the present. As the headline writer knows, anything “could” happen. From Mary Shelley’s Frankenstein through Arnold Toynbee, HG Wells and Aldous Huxley, each human advance is accompanied by forecasts of disaster. In the 1960s, Paul Ehrlich shatteringly declared “the population bomb” would lead to mass starvation by the end of the 1970s. He was supported by Barry Commoner and his thesis of an imminent “closing circle” of ecological suicide. Optimism’s trump card is the past and present. It is facts. These too can lie, but those who say so must prove it. –Simon Jenkins, The Guardian, 1 September 2016 A generation after leading scientists and experts warned the world of an escalating series of horrendous famines, the crop gluts continue. The latest kick in the pants to the Malthusian doomsayers is a bumper global wheat harvest. Defying not only the Club of Rome doomsayers, but also the climate Chicken Littles who have been warning about damage from rising temperatures to world agriculture, food production is booming even as meteorologists call July 2016 the hottest month ever. This isn’t to say that there aren’t problems and worries in the world, but the combination of human ingenuity and the complexity of natural systems means that science is never quite as settled as publicity seeking scare mongers want people to think. —The American Interest, 3 September 2016 1) Climate Chicken Littles Choke On Record Wheat Crop 2) Global Temperature Report: August 2016 3) University Official Wants Answers On Whether Climate Professors Are ‘Indoctrinating’ Students 4) Brexit Axe: Britain To Scrap EU Green Energy Subsidies 5) Simon Jenkins: In Post-Brexit Britain Optimism Should Become A Strategy 6) Post-Modern Life Is Killing Science: Cancer Research UK Refutes Claim Child Cancer Rose 40% As if they haven’t heard enough bad news already, researchers are now letting farmers know that the world’s wheat yields are excepted decline in the near future, with the world standing to lose six percent of its wheat crop for every degree Celsius that the annual global temperature increases. That’s at least according to a study recently published in the journal Nature Climate Change, which details how expected |
Supposed ‘Ground Breaking’ Study Only Proves Warming Proponents Have Jumped The Shark
They called it a “ground breaking study,” I call it rubbish. This new study claims that global warming began in 1830 just when the industrial revolution began to pick up steam (no pun intended). What they didn’t take into account was just around the same time the Earth was coming out of an unusually cold 40-year period caused by low sunspot activity called the Dalton Minimum (no relation to Timothy Dalton).
An international team of scientists, led by Associate Professor Nerilie Abram from the Australian National University, have analysed detailed reconstructions of climate going back 500 years. To their surprise, they’ve found that the current global warming trend began in the 1830s, further confirming that it is an anthropogenic, or human-induced, phenomenon. The study was published today in Nature.
Co-researcher Dr Helen McGregor, an earth sciences expert from the University of Wollongong, tells SBS Science the findings have a major impact on our understanding of how climate change works.
“If we know when global warming started, we know what the actual rates of warming are and we know when our climate is emerging above natural variability,” McGregor explains.
The scientists go on to explain they created a climate model (which have proven to be very flawed–for example none of these models have figured why the earth hasn’t warmed in over 18 years.). So to create this model they took into account other account climate model simulations and experiments (that’s right a flawed climate model using data from a flawed climate model–almost like a double negative), major volcanic eruptions and, most importantly, natural markers of climate variation found in places like corals, tree rings, and ice cores obtained from glaciers.
Dr McGregor says the study provides new, independent proof that climate change is indeed caused by human activity.
“One thing that our study provides is that it’s an alternative line of evidence,” she explains. “We’re not using thermometers and satellite records, we’re using natural archives of climate, so it’s a completely independent source of information that shows that climate change and warming is occurring.
“The central tenet of climate change, that the planet is warming, doesn’t change.”
Well not necessarily, because nowhere in their analysis do the scientists take into account sunspot activity.
Note: The sun goes through a natural cycle approximately every 11 years. The greatest number of sunspots in any given solar cycle is designated as the …
Study Shows Global Warming Thawed Antarctica 128K Years Ago: Before Fossil Fuels
by Jeff Dunetz | Aug 16, 2016 | Climate
Somewhere between 115K and 130K years ago the Earth went through a warming spell so severe that 65% of the Antarctic Ice melted. Which means among other things, that unless the Flintstones lied to us and they used a carbon-based fuel instead of foot power, global warming can happen without any help from mankind.
Winter sea ice around Antarctica shrank 65 per cent in a natural warm period between Ice Ages about 128,000 years ago, when temperatures were slightly warmer than now, according to the new report in the journal Nature Communications.
The way the scientists drew their conclusion was an analysis ancient ice cores drilled from deep in the Antarctic ice sheet. Based on the chemistry of those cores the scientists were able to figure out how far the snow got blown from the ocean before it landed and got compressed into ice. From that data they concluded that “reduction in winter sea ice area of 65±7% fully explains the ice core evidence from 128K years ago.”
Study in journal Nature: ‘Overestimated global warming over the past 20 years’
Recent observed global warming is significantly less than that simulated by climate models. This difference might be explained by some combination of errors in external forcing, model response and internal climate variability.…
30 Scientific Papers Reveal Inverse CO2 – Sea Level Signal: As CO2 Rises, Sea Level Falls
According to the IPCC (2013), global sea levels rose by less than two-tenths of a meter (0.19 m) between 1901 and 2010. Considering the scientific record of long-term sea level trends from locations across the globe, this small <0.2 m change in sea levels over the course of the last 110 years does not even fall outside the range of natural variability.
Sea levels have commonly risen and fallen at amplitudes much greater than two-tenths of a meter. As Harris et al. (2015) confirm, “relative sea-level variations of ∼1 m were common throughout the Holocene.”
For example, consider Bracco et al. (2014). These scientists found that sea levels along the coasts of South America were a full 4 meters higher than they are now between 5,500 and 6,000 years ago. Then, over the course of just a 400-year time span (between 4,700 -4,300 years ago), sea levels dropped by a full 3 meters (to +1 meter above today’s levels), then rose by 2 meters (to +3 meters above today’s levels), and then fell to current levels after 4,300 years ago. Here’s what these long-term sea-level oscillations look like graphed (Fig. 5):
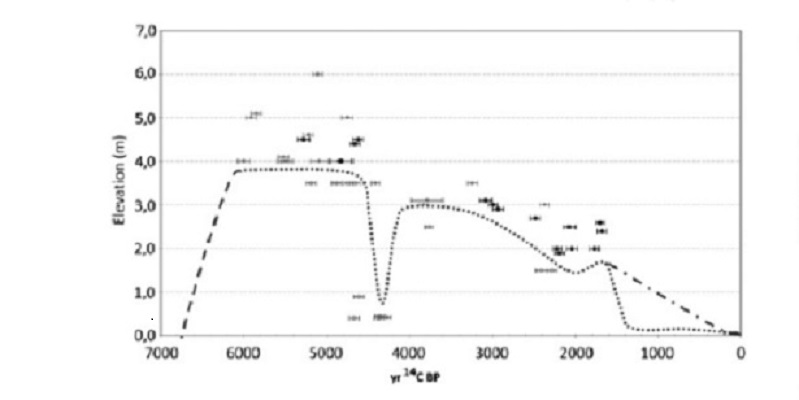
These rapid variations in sea levels pose critical explanatory problems for advocates of the AGW (anthropogenic global warming) supposition that human CO2 emissions, and not internal Earth-system dynamics, are what drive sea level changes. Specifically, AGW advocates presume that rising CO2 concentrations cause sea levels to rise (and lowering CO2 concentrations cause sea levels to fall). A large volume of rapidly accumulating scientific evidence not only does not support this CO2-rise-causes-sea-level-rise supposition, it suggests that a long-term inverse correlation could just as easily be formulated: As CO2 rises, sea levels decline.
To illustrate this, consider the Bracco et al. (2014) graph above depicting meters-per-century variations in sea levels with the corresponding CO2 concentration recorded for each period. Notice that the highstand period (5,000 to 6,000 years ago) had lower concentrations of CO2 than the following millennia that subsequently had higher CO2 concentrations. Also, consider that there was no significant change in CO2 levels during the 400 years of rapid sea level changes. Finally, notice that the last 200 years of sea level changes (if there have been any) are undetectable on this scale at this location even though CO2 concentrations were rising from 280 ppm to
Climate experts at war over prediction of ice-free Arctic
- The Times
A Cambridge University professor has been accused of “crying wolf” by predicting the imminent disappearance of Arctic ice.
Peter Wadhams has been criticised by scientists who fear that he could undermine the credibility of climate science by making doom-laden forecasts.
He repeatedly predicted that the Arctic would be “ice-free” by last summer, by which he meant it would have less than one million sq km of ice. His forecasts, reported around the world, turned out to be wrong.

Satellite measurements revealed there was a minimum of 4.6 million sq km of Arctic ice last summer, well below the long-term average but above the record low in 2012 of 3.6 million sq km.
In June this year, Professor Wadhams, head of the Polar Ocean Physics Group at Cambridge, predicted that Arctic ice “may well disappear” this September. He added: “Even if the ice doesn’t completely disappear, it is very likely that this will be a record low year.”
A recent press release promoting his new book, Farewell to Ice, claimed that there was a“greater than even chance” that the North Pole could be ice-free for the first time next month.
The US National Snow and Ice Data Center, which monitors Arctic ice, said last week: “It is unlikely that Arctic sea ice extent this September will fall below the record minimum set in 2012.” Ed Hawkins, a climate scientist at the University of Reading, analysed Professor Wadhams’ forecasts on a climate science website and questioned whether they should be taken seriously.
He wrote: “There are very serious risks from continued climatic changes and a melting Arctic but we do not serve the public and policymakers well by exaggerating those risks. We will soon see an ice-free summer in the Arctic but there is a real danger of ‘crying wolf’.”
Dr Hawkins said the Intergovernmental Panel on Climate Change, the UN’s climate science advisory body, had forecast that the Arctic would be “reliably ice-free”, meaning more than five consecutive years below one million sq km, by the mid-21st century.
Dr Hawkins said: “Putting a precise date on when we see the first days or weeks that are ‘ice-free’ is unwise because of the chaotic nature of the climate system and uncertainties in future greenhouse gas emissions.”…