
Study: ‘The vast interior of Greenland is slowly thickening’ – Greenland ice sheet moving slower now than in the last 9000 years
“Like many others, I had in mind the ongoing dramatic retreat and speedup along the edges of the ice sheet, so I’d assumed that the interior was faster now too. But it wasn’t,” said MacGregor.
The authors identified three causes for this deceleration. First is that snowfall rates were generally higher during the past 9,000 years, second is the slow stiffening of the ice sheet over time, and third is the collapse of an “ice bridge” that used to connect Greenland’s ice to that on nearby Ellesmere Island. Of most interest were the last two.
“The ice that formed from snow that fell in Greenland during the last ice age is about three times softer than the ice being formed today,” according to William Colgan of York University’s Lassonde School of Engineering, a co-author of the study.
Because of this difference, the ice sheet is slowly becoming stiffer. As a consequence, the ice sheet is flowing more slowly and getting thicker over time. This effect is most important in southern Greenland, where higher snowfall rates have led to rapid replacement of ice from the last glacial period with more modern Holocene ice.…
Climate change SHOCK: Crumbling icebergs are actually SLOWING global warming
Research has proven the huge glacial masses in Antarctica – some of which are as big as Manhattan – are in fact slowing climate change as they break apart.
Experts suggest when the massive icebergs crumble, they release vast amounts of nutrients such as iron which help algae and other organisms reproduce in the surrounding ocean.
These minuscule beings extract carbon dioxide from the atmosphere, thus reducing the pace of global warming.
The study conducted by members of the University of Sheffield found these ocean blooms are reducing the amount of carbon released into the atmosphere by between 10 and 40 million tons a year, similar to how much greenhouse emissions a country like New Zealand produces.…
‘Data Surprise! Global Temperature Continues Stall, Polar Ice And Snow Cover Continue Surprising Growth’
Data Surprise! Global Temperature Continues Stall, Polar Ice And Snow Cover Continue Surprising Growth
Thanks to German site wobleibtdieerderwärmung for providing what follows. The slightly negative linear trend in global temperature measured by RSS satellite (TLT) continues despite the El-Nino-driven warm 2015. Source: www.woodfortrees.org trend This flat trend has held since the end of 1997 and is closing in on two decades – catching a number of scientists by surprise. The preliminary data from UAH and RSS shows that 2015 was the third warmest year since the measurements began in 1978, and thus did not set a new record. A reanalysis of the global 2m temperature from CFSv2 measured a positive deviation from the mean of 0.27 K, but put the year 2015 only in 6th place: Note that the poles in the chart have been stretched out and so appear much larger in size than what they actually are. Source: What Causes El Nino Warmth? This all means that more than half of the satellite measurement era has seen no warming whatsoever! In Germany according to a DWD press release dated 30 December 2015, the mean temperature for 2015 was 9,9°C and so was the second warmest on record, tied with 2000 and 2007, despite the unusually warm November and December months, which were dominated by mild southerly winds. Polar ice growth A big surprise for many has been the ice growth measured in Greenland since 2014. Moreover the Greenland ice sheet has gown some 300 km³ since September 1, 2015 alone: Top: The total daily contribution to the surface mass balance from the entire ice sheet (blue line, Gt/day). For comparison, the mean curve from the period 1990-2013 is shown (dark grey). The same calendar day in each of the 24 years (in the period 1990-2013) will have its own value. These differences from year to year are illustrated by the light grey band. For each calendar day, however, the lowest and highest values of the 24 years have been left out.” Source: www.dmi.dk/en/greenland-ice-mass-budget/. It’s also worth taking a look at the surprising NASA-Study here! The northern hemisphere in November 2015 saw a total of 36.25 million km² of snow cover. That’s about 2.3 million km² above the WMO 1981-2010 mean. It’s the 7th greatest extent since measurements began in 1966. Northern hemispheric snow cover in November for the 2011 to 2015 five-year period set a new …
Greenland retained 99.7% of its ice mass in 20th Century
…Scientists Recycling The Identical Greenland Melt Scare From 75 Years Ago
Climate scientists are plagiarizing 75 year old scare stories for their latest alarmism.
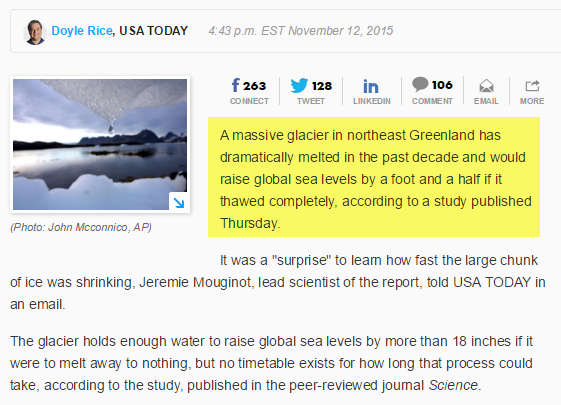
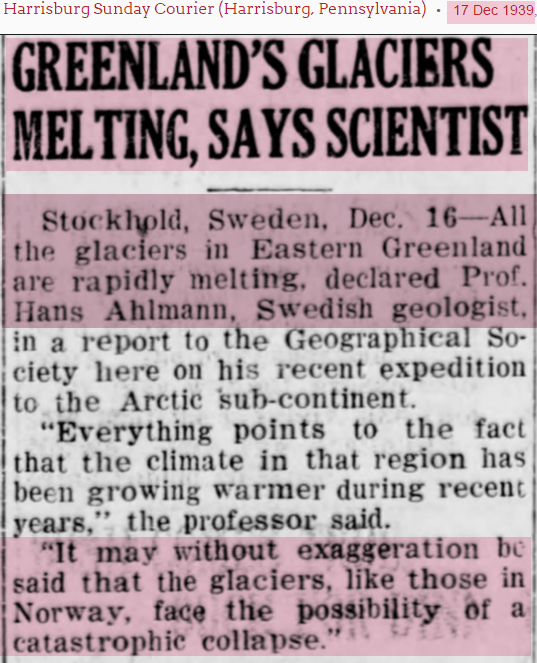
Seventy five years ago, most of the glaciers in Northeast Greenland were on the verge of collapse. And scientists needed money to study it.
…
31 May 1947 – Danger Seen In Mysterious Warning Of Arctic Climate
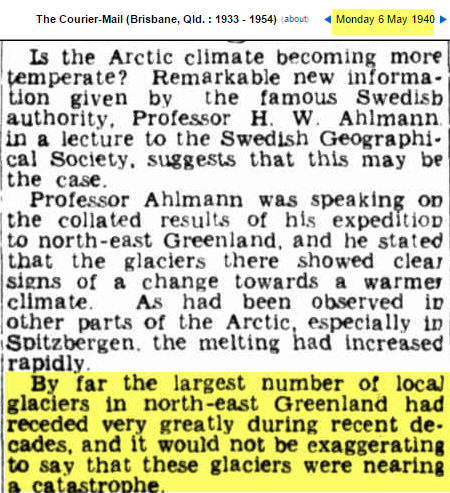
06 May 1940 – Greenland’s Climate Becoming Milder

Just in Time for UN Climate Summit in Paris—Ice Galore
Just in Time for Paris—Ice Galore
http://iceagenow.info/2015/11/just-in-time-for-paris-ice-galore/
A UN “wealth redistribution scheme.” “In any event, regardless of who agrees to what at COP-21 in Paris, nature doesn’t care, the polar ice sheets will be waxing and waning as per her dictate alone.” – Dr. Klaus L.E. Kaiser ________________________________________________________________________ Just in Time for Paris—Ice Galore By Dr. Klaus L.E. Kaiser November 7, 2015 You’ll have heard of it, COP-21, the latest United Nation conference on all things climate, coming to Paris (France) in December. Wouldn’t you know it, just in time for that “cataclysmic” event, nature does not want to play according to the organizers’ script. Rather than the polar ice caps having shrivelled to mere remnants by now, forecast for many years by all climate modelling enthusiasts, the polar ice shields have been growing by leaps and bounds. For example, according to a recent report by NASA scientists HJ Zwally et al., the Antarctic ice shield has been growing for 15 years already, even at an alarming rate. Then we learn that near the earth’s opposite pole, in Greenland, the rate of ice accumulation is breaking new records too; see the figure below (source: Danish Met. Inst., Nov. 7, 2015) and, last not least, the seasonal growth of the sea ice extent in the Arctic is not far behind. Consternation It must come as total consternation to all those people who have claimed for years now that “climate change” or “global warming” as it used to be termed is about ready to “incinerate” all life on earth. For example, “climate modellers” like S. Rahmstorf at Germany’s PIK have claimed for years that the polar regions would be most sensitive to any warming and that the polar ice masses were going to recede in a great hurry and that the ocean levels would rise fast. In reality, none of that is the case. In fact, the polar ice masses continue to grow, some reaching new all-time records in both ice extent and accumulated mass. Also ocean levels are NOT rising as previously predicted. If you feel somewhat confused, please don’t shoot the messenger. As the late Alan Caruba has claimed for years, the climate fear-mongering is nothing but an elaborate hoax. The fact that even Pope Francis subscribes to the climate gospel now does not cause the ice masses to shrink. Perhaps his Holiness’ recent encyclical letter “Laudato Si, on care …
Study: Greenland ice melt due to ‘global warming’ found not so bad after all
From the UNIVERSITY OF EDINBURGH and the “note the soot on the ice in the image they included above” department:
Satellites shed light on Greenland Ice Sheet response to warming
Parts of Greenland’s ice sheet have been found to be less vulnerable to climate warming than was thought – a discovery that could have a small but beneficial impact on sea level forecasts.
Satellite images have revealed that despite dramatic increases in ice melt across Greenland in recent years, the speed of ice movement in some areas has slowed down rather than accelerated.…
New York Times Misleading Their Readers Again About Greenland ‘melting’ – NYT recycles ‘same hysteria for almost 85 years’
Even the most ridiculous estimates of ice loss in Greenland are less than 200 km³ per year. The volume of the ice sheet is 3,000,000 km³. Using the most aggressive claims, it would take 15,000 years for the ice sheet to melt. That accounts for a sea level rise of about one hundredth of an inch per year. Does Coral Davenport think that one inch of sea level rise over the next century is going to drown her?
But the reality is that the surface of Greenland gains about 300 billion tons of ice every year. Greenland is not melting.
…
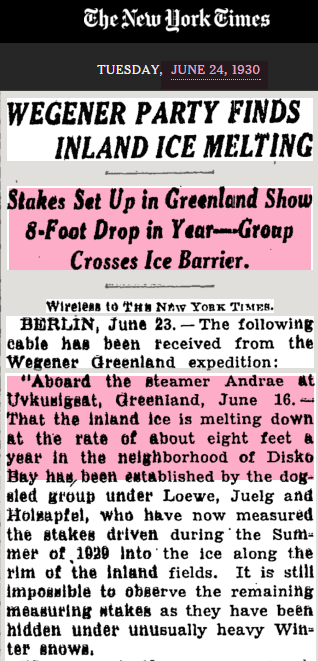
The New York Times has been reporting this same hysteria for almost 85 years.
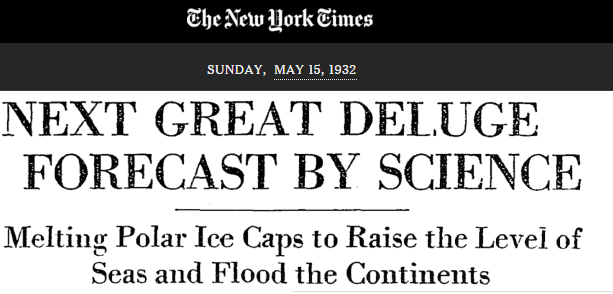
Thirty years later they were predicting a new ice age.

Climate is cyclical. There is no rational reason to believe that the Greenland ice sheet is going to disappear. More than half of it never gets above freezing most years.…
Nobel Laureate Physicist Dr. Ivar Giaever. Where’s the warming in Greenland? ‘There’s no warming there’
Where’s the warming in Greenland? – Video
http://iceagenow.info/2015/09/wheres-the-warming-in-greenland-video/
“We’re told that the ice in Greenland will disappear,” says Nobel Laureate Ivar Giaever. But there’s no warming there. “There’s information on the internet, which is wonderful, says Giaever. “And I looked it up.” There are four harbors in Greenland, says Giaever. They are Upernavik, Iluissat/Jakobshavn, Nuuk/Godthab and Tasiilaq/Ammassalik. Look at Giaever’s chart. On the left you see the five coldest years. On the right, the five warmest years. Now look at the dates. “The warmest years are basically in the 1930s,” says Giaever. “Those are the facts. Those are the temperatures the people in the harbors in Greenland has measured over the years. And it doesn’t look like it’s getting any warmer.” (This info is at approx. 15:40 on the video below.) If you haven’t yet viewed the video, you’ll find it to be a real eye opener. The post Where’s the warming in Greenland? – Video appeared first on Ice Age Now.
— gReader Pro…