
Why the Media’s Portrayal of Carbon Dioxide Is Often Wrong
But the entire story is about reducing carbon dioxide emissions and combatting man-made global warming. Carbon dioxide is a colorless, odorless, nontoxic gas. We exhale it. Carbon dioxide is a necessary component for photosynthesis and the growth of green vegetation. The reason behind the regulatory agenda to close existing coal-fired power plants in the United States and push for an international crusade against conventional fuels is because of carbon
…
So, if you want to look at some pictures, look at ones where global warming policies will prevent better standards of living. Look at the group of boys studying by lantern in Chowkipur, India, as they are just a few of the 1.3 billion people without access to electricity. Look at the images of North Korea and South Korea at night. South Koreans use 10,162 kilowatt hours (kWh) of power per person in a year. Energy-poor North Koreans each use a paltry 739 kWh. The poorest in the world are those most harmed by global warming policies.
To make matters worse, the developed and developing world will be making economic sacrifices to maybe reduce the earth’s temperature a few tenths of a degree Celsius over the next 80 years.
As a colorless gas, it’s not easy to show a picture of carbon dioxide. A smokestack with nothing emitted from it, or even with water vapor, doesn’t have the same fear-mongering feel to it. But instead of taking deceptive and salacious shortcuts, news outlets and the Obama administration alike should stop misleading the public about what carbon dioxide really is.
…
UN Paris climate deal ‘is likely to be history’s most expensive treaty’ – ‘Cost of between $1 trillion and $2 trillion annually’
http://www.wsj.com/articles/about-those-non-disappearing-pacific-islands-1476400840?mod=djemMER
Bjorn Lomborg:
Even more insidiously, doom-mongering makes us panic and seize upon the wrong responses to global warming. At a cost of between $1 trillion and $2 trillion annually, the Paris climate agreement, recently ratified by China, is likely to be history’s most expensive treaty. It will slow the world’s economic growth to force a shift to inefficient green energy sources.
This will achieve almost nothing. My peer-reviewed research, published last November in the journal Global Policy, shows that even if every nation were to fulfill all their carbon-cutting promises by 2030 and stick to them all the way through the century—at a cost of more than $100 trillion in lost GDP—global temperature rise would be reduced by a tiny 0.3°F (0.17°C).
…
Tackling issues like poverty, health care, corruption and domestic violence would do even more. Those who seek to help should keep the bigger picture in mind.
Mr. Lomborg, director of the Copenhagen Consensus Center, is the author of “The Skeptical Environmentalist” (Cambridge Press, 2001) and “Cool It” ( Knopf, 2007)…
Bjorn Lomborg About Those Non-Disappearing Pacific Islands – ‘Total land area of the islands has actually grown’
http://www.wsj.com/articles/about-those-non-disappearing-pacific-islands-1476400840?mod=djemMER
Hype and exaggeration serve no one.
Their peer-reviewed study, published in the September 2015 issue of Anthropocene, revealed that since the middle of the 20th century the total land area of the islands has actually grown.
Telling viewers in the U.S. starkly that they’re “making this island disappear,” as a report from CNN’s John Sutter did in June 2015, makes for good, blame-laden television. But this reductionist, fact-averse rhetoric contributes to the idea that climate-change discussion should be a two-sided, cartoonish fight between those who say it is not real and those who say it is the worst problem facing humanity.
…
Even more insidiously, doom-mongering makes us panic and seize upon the wrong responses to global warming. At a cost of between $1 trillion and $2 trillion annually, the Paris climate agreement, recently ratified by China, is likely to be history’s most expensive treaty. It will slow the world’s economic growth to force a shift to inefficient green energy sources.…
DiCaprio asked to resign his U.N. climate change post amid growing scandals
…Climate Activists Seek To Redefine What A Hurricane Is ‘So We’ll Have More Of Them’ – Every storm now will be ‘unprecedented’
…Leaked memo between top Democrats about climate change explains why their crusade failed
Summary: A leaked memo from the highest levels of the Democratic Party leadership discuss how to build public support for large-scale climate policy initiatives. It shows why their efforts failed, and raises questions about the coming Hillary Clinton administration.
“We don’t even plan for the past.”
— Steven Mosher (member of Berkeley Earth; bio here), a comment posted at Climate Etc.

Memorandum: “Climate: A unifying theory to the case“,
Emailed from John Podesta to Chris Lehane, 28 January 2014.
This memo was emailed to Podesta (a senior White House official) from Lehane (partner in the strategic communications firm Fabiani & Lehane, dissolved in Nov 2015). We have it courtesy of Wikileaks — and whoever leaked it to them.
John Podesta was Chief of staff to Bill Clinton and Counselor to the President for Obama. He is Chairman of Hillary Clinton’s campaign.
Chris Lehane – When an attorney in the White House Counsel’s office, he and his current business partner Mark Fabiani called themselves the “Masters of Disaster” for their work as a “rapid-response” team responding to the many scandals of the Clinton Administration. Lehane co-authored a book on damage control titled Masters of Disaster: The Ten Commandments of Damage Control. Jim Jordan, Kerry’s former campaign manager, called him ”a master of the political hand-to-hand” for his work as a political strategist.
——————————————-
“Thank you for asking us to share some ideas for a holistic approach to climate. Per your direction, the goal is to unify policy, politics, and communications to help the Administration best execute an informed plan over a multi-year time period. …this document is intended to provide some food for thought as the Administration refines its thinking on climate. …{it} addresses the four components that the Administration may want to consider as it seeks to lead on this issue.…
$3 Billion Embezzlement Scandal Could Cost DiCaprio UN Climate Position
…India To Overtake U.S. And China As World’s Biggest Coal Miner
India is set to surpass the U.S. as the world’s biggest coal producer after China by 2020, as state-miner Coal India Ltd. ramps up output to meet demand from domestic power producers, according to BMI Research.

The South Asian nation’s share of world output will increase to 12.7 percent by 2020 from 9.8 percent in 2016, BMI said in a report Thursday. It cautioned that the country will still fall short of the government’s ambitious coal output target and domestic demand will continue to exceed production up to 2020.
India, where coal accounts for 61 percent of electricity generation capacity, is seeking to reduce imports of the fuel by boosting domestic output. India foresees coal as a dominant source of energy at least for a couple of decades, while other countries, including the U.S., are moving faster toward replacing the fuel with cleaner energy sources such as natural gas to meet tougher emissions standards.
India plans to expand coal output to 1.5 billion metric tons by 2020 from an estimated 634 million tons in the year ended March 31. China produced nearly 3.7 billion tons of coal last year, according to the country’s National Bureau of Statistics.…
18 New Papers Link High Solar Activity To Medieval And Modern Warmth, Low Solar Activity To Little Ice Age Cooling
18 New Papers Link High Solar Activity To Medieval And Modern Warmth, Low Solar Activity To Little Ice Age Cooling
“It is generally accepted that the climate warms during periods of strong solar activity (e.g., the Medieval Warm Period) and cools during periods of low solar activity (e.g., the Little Ice Age).” —Lyu et al., 2016
Within the last 1,000 years, global-scale surface temperatures underwent a warm period during Medieval times, centennial-scale cooling during the 14th to 19th centuries, and another warm period since the early 20th century. According to scientists publishing in the peer-reviewed scientific literature within the last several months (2016), these long-term thermal changes are well correlated with long-term variations in solar activity, namely the Medieval Solar Maximum (Medieval Warm Period), Spörer, Maunder and Dalton Minimums (Little Ice Age), andModern Grand Maximum (20th Century). Scientists Zharkova and colleagues (2015) provide a cogent summary with a user-friendly graphic denoting the solar changes and their correspondence with warming and cooling trends.
“The longest direct observation of solar activity is the 400-year sunspot-number series, which depicts a dramatic contrast between the almost spotless Maunder and Dalton minima, andthe period of very high activity in the most recent 5 cycles [1950s – 2000s], prior to cycle 24. … The records show that solar activity in the current cycle 24 is much lower than in the previous three cycles 21–23 revealing more than a two-year minimum period between cycles 23 and 24. This reduced activity in cycle 24 was very surprising because the previous five cycles were extremely active and sunspot productive forming the Modern Maximum. … We predict correctly many features from the past, such as: 1) an increase in solar activity during the Medieval Warm period; 2) a clear decrease in the activity during the Little Ice Age, the Maunder Minimum and the Dalton Minimum; 3) an increase in solar activity during a modern maximum in 20th century.”
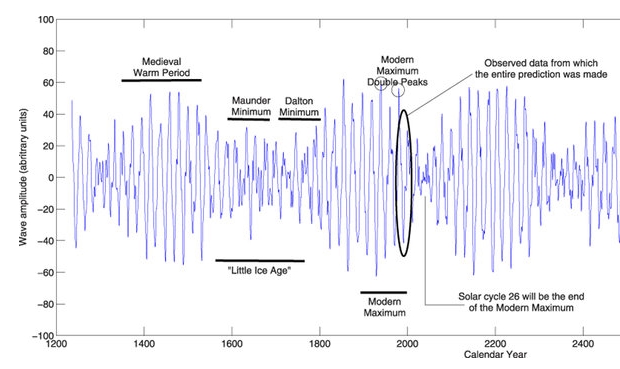
“The corrected series is provided as supplementary material in electronic form and displays secular minima around 1800 (Dalton Minimum) and 1900 (Gleissberg Minimum), as well as the Modern Grand Maximum of [solar] activity in the second half of the twentieth century. The uniqueness of the grand maximum is confirmed for the last 250 years.”
Did Hurricane Matthew Ever Get Anywhere Near Cat 5? ‘Wind speeds are not based on actual measurements’
By Paul Homewood
According to the official records, it hit 160 mph sustained speeds on 1st October, making it the first Cat 5 Atlantic hurricane since 2007. Apparently, if you believe the official view of events, Matthew intensified from a Category 1 hurricane on the Saffir–Simpson scale to a Category 5 hurricane in just 24 hours.
However, extremely suspiciously, it only stayed at Cat 5 for 6 hours, before weakening. (In fact, NOAA’s records are at 6-hourly intervals – Matthew reached Cat 5 speeds of 140 Kts at 6.00am on Oct 1st, but dipped to Cat 4 speeds of 135 Kts at 12.00 am. Therefore it stayed at Cat 5 speeds for UNDER 6 hours.)
However, as I have pointed out before, these categorisation of wind speeds are not based on actual measurements, as they would have been in the past. Instead, they are derived from Track History, which in NOAA’s own words is defined as:
Track history for each storm is created from the operational warnings that are issued every six hours by NHC, CPHC , and JTWC . The positions and intensities are best estimates of those quantities when the warning is issued. THESE ARE NOT BEST TRACKS – having not been reanalyzed in any systematic manner.
So, somehow, Matthew’s windspeeds are supposed to have risen precipitously not in actuality, but because that is what was forecast by NOAA.
But what actually happened?
Whether we trust what the satellites tell us or not, NOAA’s actual plots show that Matthew barely got above 100 Kts, and nowhere near the green line, which is the Best Track which they forecast, and on which all of the hyped news reports have been based on. (100 Kts would put Matthew as a Cat 3).
…