NPR laments ‘paid confusionist’ Morano speaking at Utah energy summit – ‘Denier…sparks controversy’
http://kuer.org/post/energy-summit-speaker-sparks-controversy-utah-appearance
The Uintah Basin Energy Summit takes place this week, and the controversy’s started even before the program begins. That’s because Wednesday’s keynote speech is being given by prominent climate change denier, Marc Morano.
He’s a conservative blogger who’s made a career of disputing climate science and the people who take it seriously. His ideas – and in-your-face style — are included in the 2015 film,Climate Hustle.
“I think it’s good to get information from all sides” says Uintah County Commissioner Mike McKee, whose county is hosting the two-day conference. “This is an energy summit. There’s science out there on both sides of this, and I’m anxious to see what his presentation is and see where that goes.”
McKee says extractive industries account for 60 percent of his county’s economy and 50 percent of its jobs.
That’s a big reason why the Utah School and Institutional Trust Lands Administration is a conference sponsor, according to the organization’s deputy director Kim Christy.
“We definitely don’t feel it’s out of line with our responsibilities in managing our portfolio,” he says.
The state Office of Energy Development, which is also sponsoring the conference as a show of support, noted in a statement: “ our views on climate change do not align with those of Mr. Morano.”
Both agencies say they had no role in selecting the speakers.
Meanwhile, others doubt the value of Morano’s message. Utah State University physicist, Rob Davies, describes Morano as a “paid confusionist” and sees the keynote speech as a missed opportunity for the energy industry and eastern Utah.
“They deserve really good information as to what the potential changes are and why,” says Davies. “And I just can’t see someone like Marc Morano bringing constructive, good information to those communities on this topic.”
That’s a view shared by Barry Bickmore, a Brigham Young University geologist.
“They’re just bringing in somebody who can give them a really good sales pitch for what they want to hear,” says Bickmore. “In a way, though, it’s sad because they could be preparing for the inevitable transition away from fossil fuels.”…
Say what?! U. S. Department of Transportation asks: ‘How might climate change increase the risk of fatal crashes in a community?’
2015 Traffic Fatalities Data Has Just Been Released: A Call to Action to Download and Analyze
Posted by DJ Patil, Deputy Chief Technology Officer for Data Policy and Chief Data Scientist in the White House Office of Science and Technology Policy and Dr. Mark Rosekind, Administrator of the National Highway Traffic Safety Administration
This post is cross-posted at the White House Office of Science and Technology Policy blog.
35,092.
That is the number of people who died on our nation’s highways in motor vehicle traffic crashes in 2015. Your neighbor driving to work. Your niece walking to the park. Your brother biking home. Every day, nearly 100 people die from vehicle-related accidents.
Today, the U.S. Department of Transportation is releasingan open data set that contains detailed, anonymized information about each of these tragic incidents. As the new data being released show, and as DOT reported earlier this summer, 2015 showed a marked increase in traffic fatalities nationwide.

To be precise, 7.2% more people died in traffic-related accidents in 2015 than in 2014. This unfortunate data point breaks a recent historical trend of fewer deaths occurring per year.
Under the leadership of Transportation Secretary Anthony Foxx, we’re doing two things differently this year.
One: We’re publishing the data through NHTSA’s Fatality Analysis Reporting System (FARS) three months earlier than last year.
Two: We’re directly soliciting your help to better understand what these data are telling us. Whether you’re a non-profit, a tech company, or just a curious citizen wanting to contribute to the conversation in your local community, we want you to jump in and help us understand what the data are telling us.
Some key questions worth exploring:
- How might improving economic conditions around the country change how Americans are getting around? What models can we develop to identify communities that might be at a higher risk for fatal crashes?
- How might climate change increase the risk of fatal crashes in a community?
- How might we use studies of attitudes toward speeding, distracted driving, and seat belt use to better target marketing and behavioral change campaigns?
- How might we monitor public health indicators and behavior risk indicators to target communities that might have a high prevalence of behaviors linked with fatal crashes (drinking, drug use/addiction, etc.)? What countermeasures should we create to address these issues?
A number of private sector firms and educational institutions have …
Emergency Theater for Paris Agreement: China, US rush to sham ratification
…Study in journal Nature: ‘Overestimated global warming over the past 20 years’
Recent observed global warming is significantly less than that simulated by climate models. This difference might be explained by some combination of errors in external forcing, model response and internal climate variability.…
Glaring Falsehoods By German ZDF Public Television Aimed At Attacking Climate Science Skepticsm
…All Natural… Four New Scientific Publications Show No Detectable Sea Level Rise Effect of CO2
It is widely assumed that sea levels have been rising in recent decades largely in response to anthropogenic global warming. However, due to the inherently large contribution of natural oscillatory influences on sea level fluctuations, this assumption lacks substantiation. Instead, natural factors or internal variability override the detection of an anthropogenic signal and may instead largely explain the patterns in sea level rise in large regions of the global oceans.
Scientists who have recently attempted to detect an anthropogenic signal in regional sea level rise trends have had to admit that there is “no observable sea-level effect of anthropogenic global warming,” or that the “sea level rise pattern does not correspond to externally forced anthropogenic sea level signal,” and that sea level “trends are still within the range of long-term internal decadal variability.”
Below are highlighted summaries from 4 peer-reviewed scientific papers published within the last few months.
For the convenience of the readers, our basic results are shown in Figure 1. We identified five individual oscillations (upper panel), including a sea-level amplitude of 70 mm (top–bottom [t-b]) of the 18.6-year oscillation caused by the lunar nodal oscillation (LNO) … Together with a general sea-level rise of 1.18 mm/y, the sum of these five sea-level oscillations constitutes a reconstructed or theoretical sea-level curve of the eastern North Sea to the central Baltic Sea(Figure 1, lower panel), which correlates very well with the observed sea-level changes of the 160-year period (1849–2009), from which 26 long tide gauge time series are available from the eastern North Sea to the central Baltic Sea. Such identification of oscillators and general trends over 160 years would be of great importance for distinguishing long-term, natural developments from possible, more recent anthropogenic sea-level changes. However, we found that a possible candidate for such anthropogenic development, i.e. the large sea-level rise after 1970, is completely contained by the found small residuals, long-term oscillators, and general trend. Thus, we found that there is (yet) no observable sea-level effect of anthropogenic global warming in the world’s best recorded region.
Building up on the relationship between thermocline and sea level in the tropical region, we show that most of the observed sea level spatial trend pattern in the tropical Pacific can be explained by the wind driven vertical thermocline movement. By performing detection and attribution study …
30 Scientific Papers Reveal Inverse CO2 – Sea Level Signal: As CO2 Rises, Sea Level Falls
According to the IPCC (2013), global sea levels rose by less than two-tenths of a meter (0.19 m) between 1901 and 2010. Considering the scientific record of long-term sea level trends from locations across the globe, this small <0.2 m change in sea levels over the course of the last 110 years does not even fall outside the range of natural variability.
Sea levels have commonly risen and fallen at amplitudes much greater than two-tenths of a meter. As Harris et al. (2015) confirm, “relative sea-level variations of ∼1 m were common throughout the Holocene.”
For example, consider Bracco et al. (2014). These scientists found that sea levels along the coasts of South America were a full 4 meters higher than they are now between 5,500 and 6,000 years ago. Then, over the course of just a 400-year time span (between 4,700 -4,300 years ago), sea levels dropped by a full 3 meters (to +1 meter above today’s levels), then rose by 2 meters (to +3 meters above today’s levels), and then fell to current levels after 4,300 years ago. Here’s what these long-term sea-level oscillations look like graphed (Fig. 5):
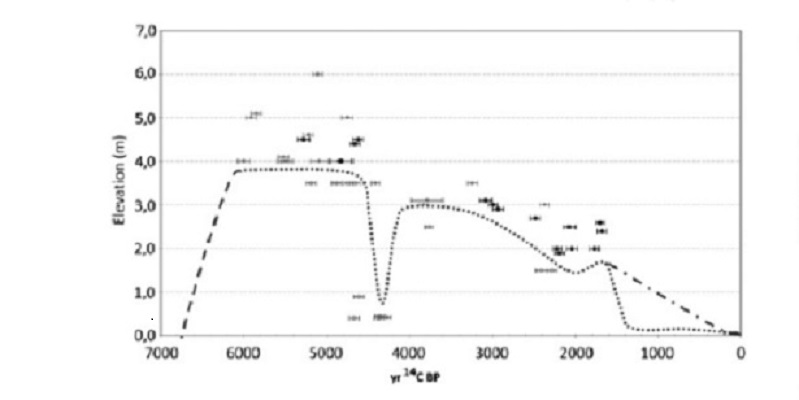
These rapid variations in sea levels pose critical explanatory problems for advocates of the AGW (anthropogenic global warming) supposition that human CO2 emissions, and not internal Earth-system dynamics, are what drive sea level changes. Specifically, AGW advocates presume that rising CO2 concentrations cause sea levels to rise (and lowering CO2 concentrations cause sea levels to fall). A large volume of rapidly accumulating scientific evidence not only does not support this CO2-rise-causes-sea-level-rise supposition, it suggests that a long-term inverse correlation could just as easily be formulated: As CO2 rises, sea levels decline.
To illustrate this, consider the Bracco et al. (2014) graph above depicting meters-per-century variations in sea levels with the corresponding CO2 concentration recorded for each period. Notice that the highstand period (5,000 to 6,000 years ago) had lower concentrations of CO2 than the following millennia that subsequently had higher CO2 concentrations. Also, consider that there was no significant change in CO2 levels during the 400 years of rapid sea level changes. Finally, notice that the last 200 years of sea level changes (if there have been any) are undetectable on this scale at this location even though CO2 concentrations were rising from 280 ppm to
Report: ‘Collusion Between Michael Mann, James Hansen And Gavin Schmidt To Create The Hockey Stick’
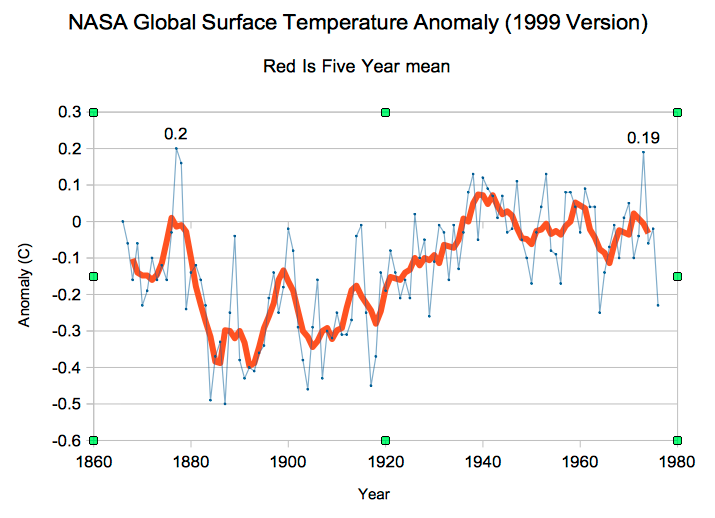
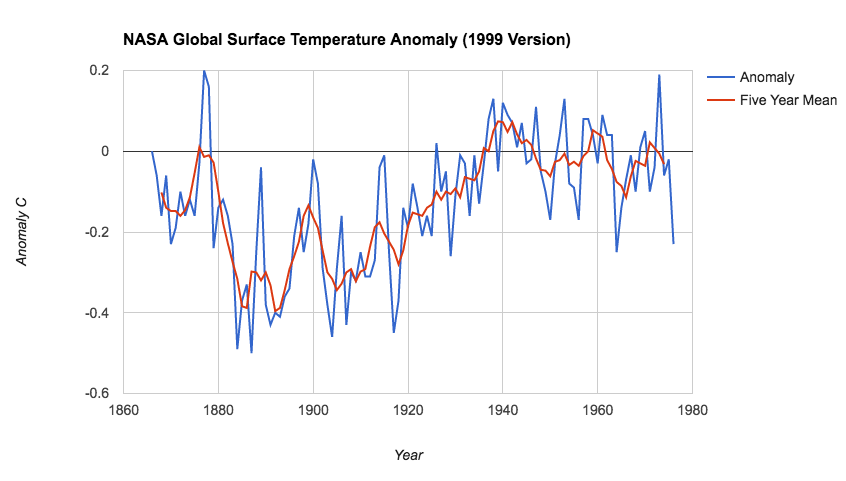
As of 1999, NASA showed no net warming from the 1870’s to the 1970’s, and showed 1877 as the warmest year from 1866 to 1976.
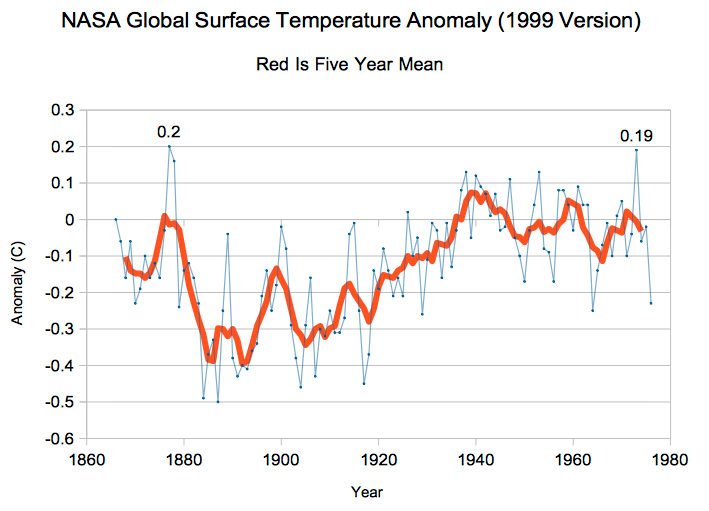
Archived from: http://www.giss.nasa.gov/data/gistemp/GLB.Ts.txt
The IPCC showed that the warmest period of the last thousand years was in the 13th century, and that all recent warming occurred before the year 1940.

There was no evidence of a human influence on climate, and that was no use for funding or political influence. So the decision was made to get rid of the Medieval Warm Period, and create a hockey stick of recent warming.
IPCC participant Jay Overpeck said in his email to Professor Deming, “We have to get rid of the Medieval Warm Period.”
Michael Mann was up to the task, and he did exactly what Overpeck wanted him to do – he erased the Medieval Warm Period.

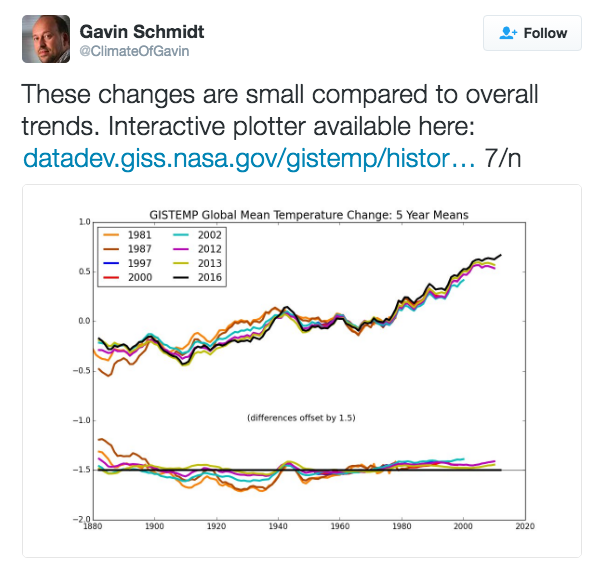
But that wasn’t enough to make the Hockey Stick. Mann needed some help from his buddies at NASA, James Hansen and Gavin Schmidt. They had to create about 0.6C warming from 1850 to 1976 – which they did by altering their own data.
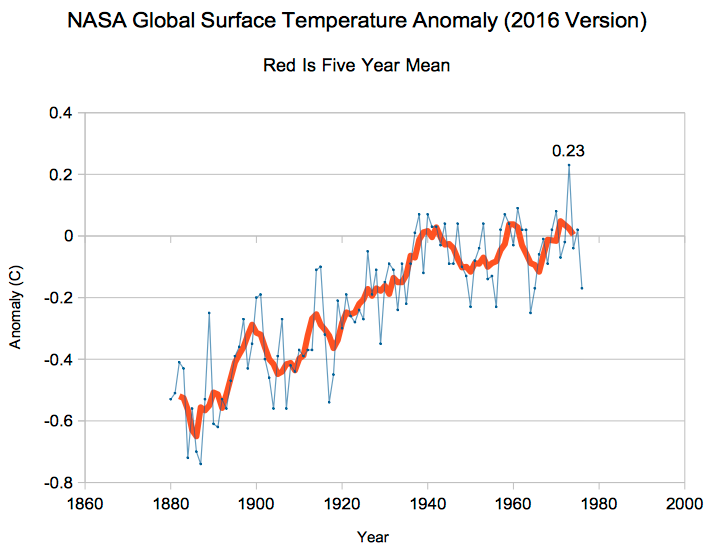
Hansen and Schmidt erased all of the warm years before 1880, and massively cooled all of the remaining years before 1970.
Hansen and Schmidt created the blade of the hockey stick by tampering with their own data, just as Mann did with the proxy data to get rid of the MWP and LIA.
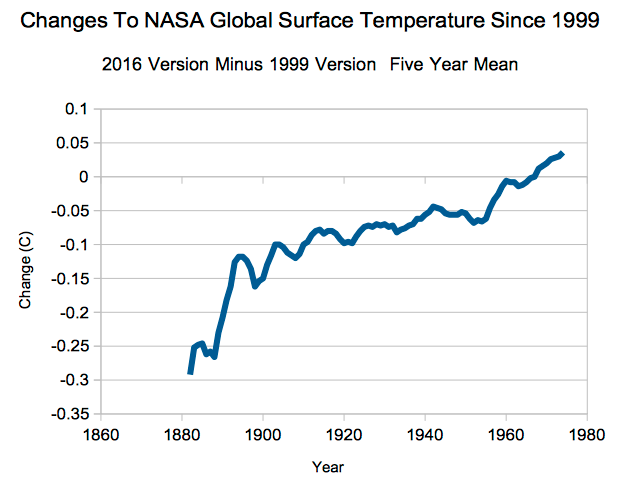
The massive climate fraud we are currently experiencing didn’t just happen. It required two decades of planning and collusion to make it happen. Gavin says that is is no big deal that he nearly doubled 1880 to 1999 warming, hid the pre-1880 warmth, adjusted data far outside of his own error bars, and declared hottest year ever by a couple of hundredths of a degree.
Analysis: NASA’s ‘massive temp increase caused primarily by altering the historical record. The past keeps getting cooler’
This massive increase since the year 2000 occurred during a period when satellites showed air temperatures over land decreasing.