
Actress Judi Dench Narrates Rio Olympics Climate Change Video
https://www.romper.com/p/judi-dench-narrates-rio-olympics-climate-change-video-its-epic-15860
Although the Rio Opening Ceremony is a time for celebration and a showcase of all the wonderful things Brazil has to offer, the ceremony also took the time to talk about a serious issue: climate change. And who better to discuss this worldwide issue than England’s sweetheart? Academy Award winner Judi Dench narrated the Rio Olympics climate change video with a sincerity and seriousness that caught many viewers attention. The video showed maps and diagrams, displaying how the global temperatures are rising, causing the melting of ice caps and the warming of cities across the globe, including, of course, Rio.…
‘Climate change’ front and center at Olympics opening ceremony
The 2016 Summer Olympics in Rio de Janeiro commenced Friday night with an opening ceremony that made a global plea to reverse climate change and conserve the Earth’s resources.
It’s Brazil’s first time hosting the Olympics. In fact, it’s the first time any South American country has welcomed more than 200 nations’ athletes for the historic games.
The opening ceremonies’ planning committee put on a more earthy, funky and down-to-Earth experience than previous summertime host countries like London and Beijing. Part of that focus was calling on all nations to save the environment, an almost ironic plug considering the neglected state that parts of Rio are in despite the Amazon rainforest in Brazil.
…
Say what?! NYT features Warmist: ‘How Lowering Crime Could Contribute to Global Warming’ – ‘Fewer prisoners might mean higher overall energy consumption’

Get a load of this. We’ve all heard the usual hate-speech that climate skeptics should be “locked up” for having an alternate opinion.
But, did you ever think you’d see something as ridiculous as this in the NYT?
…inmates generally consume less than an average citizen in the country, so fewer prisoners might mean higher overall energy consumption.
Additionally, the money saved from reducing crime would go into the government’s budget and people’s pockets. All that money could be spent in other ways — infrastructure, buildings or goods — that may require more energy to produce or operate, possibly adding more greenhouse gases to the atmosphere.
http://www.nytimes.com/2016/08/04/science/climate-change-rebound-effect.html?_r=0
The author, Tatiana Schlossberg, is the granddaughter of JFK
http://www.etonline.com/news/184542_jackie_kennedy_lookalike_granddaughter_rose_schlossberg_launches_comedy_web_series/
In other words, if we’re all locked up, that’s good! Smaller carbon footprint!! More criminals running free means more GHG’s. Perhaps this will quell the mentally aberrant thinking of California Governor Jerry Brown, who wants to release even more criminals -both violent and non-violent.
h/t to Marc Morano of Climate Depot…
Climate Exit or Clexit has arrived. Time to exit UN Paris Climate Agreement
…Claim: global warming driven extreme weather will increasingly disrupt striped bass fishing holes
…A Brief Journey into the Dark Art of Rapid Extreme Weather Attribution
…MIT: China is beating America in nuclear energy
…Senate Liberals, Targeting Climate Change ‘Deniers,’ Demand to Know Donors to 22 Think Tanks
http://dailysignal.com/2016/08/03/senate-liberals-targeting-climate-change-deniers-demand-to-know-donors-to-22-think-tanks/
Some of the Senate’s most liberal Democrats, demanding that 22 national and state-based think tanks disclose their donors, disparaged them as being part of a network of free-market policy organizations the senators accuse of “laundering” identities while denying climate change exists.
The existence of the conservative and libertarian policy research and education organizations, Senate Minority Leader Harry Reid and eight fellow senators wrote in a letter to some of the organizations’ leaders, suggests the extent of a “web of denial” about man’s contribution to global warming, or climate change.
“Because your organizations do not regularly disclose where your donations come from, we cannot know for sure how deep and wide the web of denial truly is,” the nine senators write.…
Polar Bear numbers ‘up spectacularly this year and all are looking very fat and healthy’
Polar bears off the ice in W. Hudson Bay are “well fed and in great shape” this year

Reports from Seal River, just north of Churchill at Churchillwild, at July 26 were crowing about seeing lots of bears onshore, with a veritable beehive of activity the weekend of 16/17 July:
“This has without a doubt been Churchill Wild’s most spectacular start to the summer polar bear watching season. …Bear numbers are up spectacularly this year and all are looking very fat and healthy, perhaps much to the chagrin of climate change “experts.” Our best day for the seductive white carnivores over the past week featured 21 polar bears sighted between the Lodge and our whale swim spot!
…
The ice pack, which was still visible a week ago [i.e, 17 July or so], has finally dissipated and pushed a large number of bears on to our coastline here at Seal River, with the end result being many very happy cameras!” [my bold]
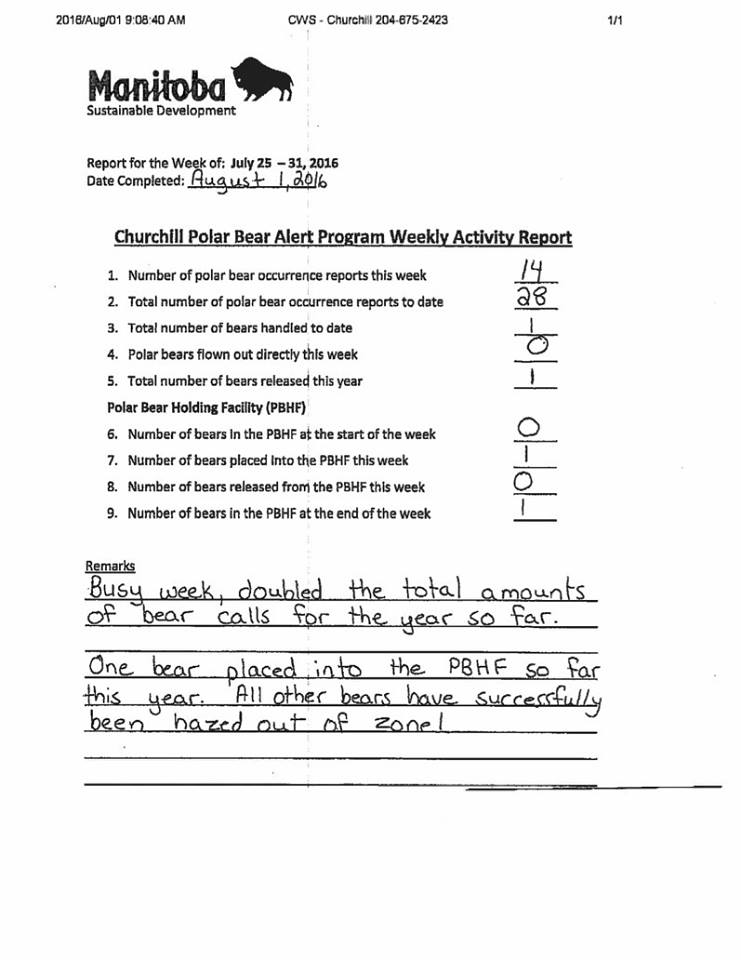
And in Churchill proper, the Polar Bear Alert program has issued three reports so far this season (courtesy the Town of Churchill), which confirm that bears in the Polar Bear Capital of the World are also in great shape.
For the week of July 11-17, 2016:
“Bears are off the sea ice and on land. They are looking well fed and in great shape.”
See all three PBA reports below, compared to one from last year at this time (as well as a map and some ice charts).
More fat, healthy bears than last year, enough to keep the Polar Bear Alert folks hopping and tourists in the north happy. Sure doesn’t sound like a suffering population to me.
Map (courtesy Churchillwild):

WEEK 1, 2016

WEEK 2, 2016

WEEK 3, 2016
EARLY JULY, 2015 (FOR COMPARISON), NO MENTION OF CONDITION:

LATE JULY 2015:

SEA ICE COMPARISON GRAPH FOR THE WEEK OF 9 JULY, 1971-2016:

SEA ICE MAP FOR 17 JULY 2016:

Analysis: Non-Existent Relationship …CO2-Temperature Correlation Only 15% Of Last 165 Years
Non-Existent Relationship …CO2-Temperature Correlation Only 15% Of Last 165 Years
By Kenneth Richard The HadCRUT global temperature dataset that the IPCC references contains instrumental records that date back to the year 1850. Precise CO2 data (measured in tenths of parts per million) from thousands of years ago can be found in Antarctic ice cores, with direct measurements (Mauna Loa) available since the 1950s. In comparing the two records, it can be concluded that during the last 165 years, rapidly increasing CO2 concentrations only correlate with rapidly increasing global temperatures for one 25-year period (1977-2001). Put another way, for 85% of the last 165 years there has been little to no correlation between CO2 concentration changes and temperature changes. Maximum CO2 warming occurs within 10 years after emission Before illustrating the lack of trend correlation between CO2 and temperature during the last 165 years, it needs to be pointed out that scientists have determined that on average it takes about 10 years for the maximum warming effect from CO2 emission to be realized. In other words, CO2 emissions from the 1950s predominantly had the most pronounced effect on temperature trends by the 1960s. It could also be said that we are now experiencing the height of the warming effects of the CO2 emissions from the early 2000s. The timing of the CO2-to-temperature effect was determined by Ricke and Caldeira (2014) in their Environmental Research Letters paper entitled “Maximum warming occurs about one decade after a carbon dioxide emission”. Ricke and Caldeira, 2014: It is known that carbon dioxide emissions cause the Earth to warm, but no previous study has focused on examining how long it takes to reach maximum warming following a particular CO2 emission. Using conjoined results of carbon-cycle and physical-climate model intercomparison projects, we find the median time between an emission and maximum warming is 10.1 years. Selecting decadal-sale warming and cooling phases Having established that correlational fluctuations between CO2 concentrations and global temperature should be detectable on a decadal scale (presuming that Ricke and Caldeira [2014] are correct), the CO2 and temperature record for the last 165 years can be considered — rooted in the anthropogenic global warming (AGW) assumption that temperature fluctuations should occur in direct response to CO2 concentration changes. The IPCC routinely selects starting and ending points from the instrumental record to establish warming and cooling phases in their trend analysis. For example, the years …