
Record Snow in Alaska – Brazil coldest in 22 years – Argentina buried in snow – South Africa snows
Record cold and snowfalls for the past week as collected by http://iceagenow.info/
Snow in Russia on June 13 – Today in Tiksi it snowed.

South Africa – Snow around the country

Brazil – Coldest in 22 years – Waterfall freezes.

Nature continues to mock Ukrainians – In June it snows – Kyiv, June 10 – “The snow falls in the summer,” says nahnews.org.
Surprise snow in Mexico – Snow in June in Creel.
Record snowfall in Barrow, Alaska – Shatters old daily snowfall record for June 9.

More than 2 meters of snow in Argentina – School classes suspended.
Misiones, Argentina – One of the coldest autumns in 30 years – Global warming news from Argentina, homeland of Bernie Sander’s friend Pope Francis.
Argentina – Nearly 1,500 trucks waiting to enter Chile– The international crossing Cristo Redentor has been closed since June 1 due to heavy snowfall.
Snow Stranded Argentina truckers being robbed and beaten: The international crossing continues closed by snow.
More snow for California – Almost mid June! – WINTER weather advisory.
Snow expected six days in a row at Mt Rainier In mid June.
Snow in Washington Cascades – More than 6 inches (15 cm) of snow likely above 6000 feet.
Snowfall on Mt Washington, NH – If you’d like to find wintry conditions this late in the season, look no further than at Mt Washington, New Hampshire
South American Ski Resorts Digging Out From Close to 10 Feet of Snow

Snow in Alaska – Winter – WINTER – storm watch. On June 9.
Snow in Lapland – Video – Rare June snow covered summer lawns and flower beds.
Snow Strikes China’s Northernmost Province – Video – Analysts say it is unusual to see snow at this time of year.
Lowest May temp on record for Lithgow, NSW Australia
…
New paper shows no harm from more time on land for S. Beaufort polar bears
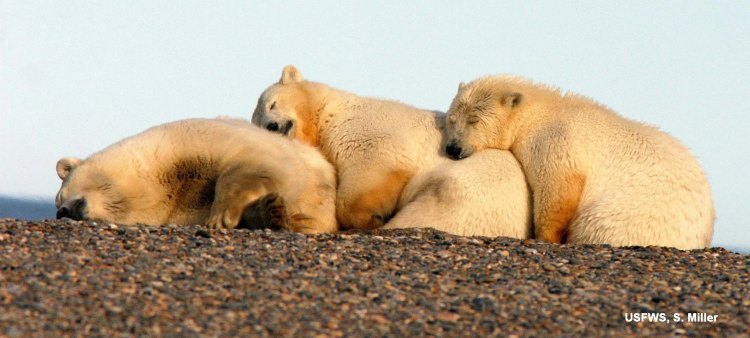 Take-home quote from a new polar bear paper by Todd Atwood and colleagues (2016):
“…there is no causal link between the patterns in polar bear vital rates and increased use of terrestrial habitat…”
In other words, there was no information to link the increased time polar bears spent onshore with either an increase or a decrease in body condition, survival or cub production. The authors did find that polar bears were strongly attracted to the bone piles that accumulated in the fall from 2010-2013 after Inuit bowhead whale (Balaena mysticetus) hunting at Barrow, Cross Island, and Kaktovik. Isn’t that a surprise?
The results also appear to confirm previous work that showed terrestrial (land-based) foods are not important to polar bears – a conclusion I totally agree with and which I discussed last year here. No wonder there was no press release issued by USGS about this study. It’s only “news” because someone the Anchorage Daily News interviewed lead-author Atwood yesterday as a way of promoting the International Bear Conference (see previous post here, now updated with a link to the Talk of Alaska radio podcast). Atwood implied there could be advantages to bears from feeding on the bone piles but admitted he had no data to support that assumption.…
CO2 Warming Grossly Exaggerated… 50+ Published Papers Find Extremely Low Climate Sensitivity To Doubled CO2
When it comes to climate’s sensitivity to increases the CO2 concentration, the commonly stated assumption – based on modeled calculations – is that the resulting temperature change when CO2 concentrations are doubled from 275 ppm (pre-industrial) to 550 ppm is about 1.2°C. This is the direct result reported from doubling CO2 concentrations without any feedbacks (primarily from water vapor or cloud cover changes).
Below is a summarizing quote from the IPCC pertaining to the climate’s sensitivity to direct CO2 increases:
If the amount of carbon dioxide were doubled instantaneously, with everything else remaining the same, the outgoing infrared radiation would be reduced by about 4 Wm-2. In other words, the radiative forcing corresponding to a doubling of the CO2 concentration would be 4 Wm-2. To counteract this imbalance, the temperature of the surface-troposphere system would have to increase by 1.2°C (with an accuracy of ±10%), in the absence of other changes.”
As well as another from the skepticalscience.com blog:
If there were no feedbacks in the Earth’s climate system, physics tells us climate sensitivity would be 1.2°C for a doubling of CO2.”
Although this temperature calculation of just over one degree Celsius for doubled CO2 is widely accepted in the scientific community – even by skeptics of the IPCC’s conclusions – many scientists have found a 1.2°C increase in surface temperature from doubled CO2 is still way too high.
Click here to go to the list of over 50 papers that support the conclusion that doubling CO2 concentrations to about 550 ppm results in a much lower temperature increase than 1.2°C. The papers are divided into 3 categories: (a) quantified low CO2 climate sensitivity results (2X CO2 may cause just ~0.02 to 0.7°C of warming), (b) non-quantified low climate sensitivity results for doubling (or significantly increasing) CO2 concentrations, and (c) conclusions that increasing CO2 concentrations leads to a net cooling rather than a warming.
50+ Papers Extremely Low Climate Sensitivity To Doubled CO2!
– See more at: http://notrickszone.com/2016/06/13/co2-warming-grossly-exaggerated-50-published-papers-find-extremely-low-climate-sensitivity-to-doubled-co2/#sthash.hCnKwvoy.dpuf…
California State to climate change skeptics: Shut up, already
Building a green utopia would be so much easier if people would just shut up, stop asking questions and behave like good subjects. Don’t they know the science of climate change is settled?
The debate is over. There never was one. Oh, goodness. Big Oil. The fracking people.Conservatives. Why should anyone listen to them?
Senate Bill 1161, the ill-named “California Climate Science Truth and Accountability Act of 2016,” would have lifted a four-year statute of limitations, empowering the attorney general or adventurous district attorneys to delve into claims of any vintage that dare challenge the orthodoxy.
Particularly chilling is the declaration that the state will seek “redress for unfair competition practices committed by entities that have deceived, confused, or misled the public on the risks of climate change or financially supported activities that have deceived, confused, or misled the public on those risks.”
That last clause gives the game away: It’s about shutting down advocacy and using state power to discourage an unpopular point of view, not protecting the public from false claims.
SB 1161, authored by Sen. Ben Allen, a Santa Monica Democrat, had already cleared two committees and was scheduled for a Senate floor vote last week before it was withdrawn. Perhaps somebody realized the law would have been demolished on First Amendment grounds.
Contrary to internet rumors, SB 1161 said nothing about criminal sanctions against climate apostates. But skeptics may be forgiven for imputing ill motives and bad faith to the bill’s authors. California Attorney General Kamala Harris belongs to a coalition of 17 attorneys general who got together in March to pursue climate change skeptics, starting with big, bad ExxonMobil.
Some inconvenient polar bear facts supported by scientific literature
The evidence that polar bears have not been harmed by recent declines in sea ice is contained in the scientific literature, no matter what some researchers say when they talk to the media.
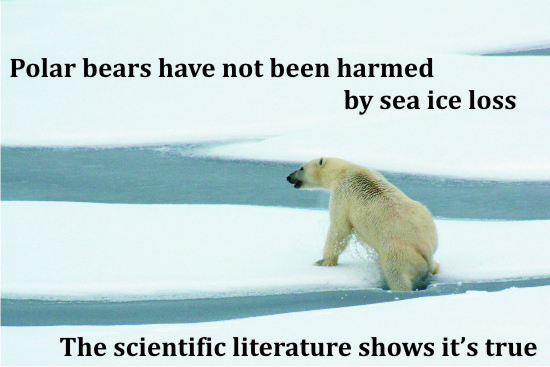
Here’s a few of those facts (not all, by any means), with the references to back them up:
- Southern Beaufort bear numbers did not fall in the mid-2000s due to global warming or summer sea ice loss but because of thickspring sea ice conditions that were as bad as a similar event that occurred in 1974-1976 – a fact that’s well documented in the scientific literature (Amstrup et al. 1986; Bromaghin et al. 2015; Burns et al. 1975; Lentfer 1976; Harwood et al. 2000, 2012; Pilfold et al. 2015; Smith 1987; Stirling 2002; Stirling and Lunn 1997; Stirling et al. 1980, 1982). See this post: Biggest threat to polar bears reconsidered [especially the appendix]
- Recent loss of sea ice in the Beaufort Sea (April/May 2016) has been due to the actions of the massively strong current called theBeaufort Gyre. See this post (with NASA video) Beaufort Sea fractured ice due to strong Beaufort Gyre action – not early melt
- The polar bear who swam the longest may have lost 22% of her body weight but that is a meaningless figure – other research shows that 22% was less than she would have lost if she’d stayed on land (Derocher and Stirling 1995; Durner et al. 2011; Pagano et al. 2012; Pilfold et al. 2016 in press). See this post: Longest-swimming polar bear lost less weight than if she had stayed onshore
- Although it’s true that polar bears that spend the summer on the sea ice of the Arctic Basin don’t catch very many seals, biologists assume most bears eat very little over the summer regardless of where they spend it – on land or on sea ice (Derocher et al. 2002; Pilfold et al. 2015; Hammill and Smith 1991; Stirling 1974; Stirling and Øritsland 1995). See these posts: Polar bears out on the sea ice eat few seals in summer and early fall and Summer habitat for most polar bears is either shoreline or sea ice in the Arctic Basin
- Starvation is the leading cause of death for young bears, sick or injured bears, and very old bears – it’s just a fact of life for this apex predator with no natural enemies (Amstrup
The Hyping of Anthropogenic Global Warming (AGW) Required Weather Myths
Dr. Tim Ball
Some claim the entire notion that human addition of CO2 to the atmosphere is causing global warming is a deliberately created myth, that it was produced to isolate CO2 as a serious environmental problem that required curtailing the economies of developed countries. To enhance the threat required endangerment to plants, animals, and humans. The list of threats is endless because proponents of AGW can take everyday natural events and say they are not ‘normal.’ They know that most don’t know what is normal, as I discussed in a previous article, and that what is a ‘normal’ climate, changes with time. Many people use these interchangeably with natural and unnatural. The list of myths attributed to global warming is endless, but one started a few years ago titled, “A complete list of things caused by global warming” keeps expanding.
There is added confusion in the climate debates because proponents continually interchange ‘natural’ and ‘normal.’ It is a reflection of the philosophical and intellectual confusions and contradictions that result from the deception. It probably also reflects the underlying anti-humanity of many extreme environmentalists. For example, in Global Warming: The Greenpeace Report (1990), edited by Jeremy Leggett, says CO2 is added to the atmosphere naturally and unnaturally. By unnatural they mean the portion comes from humans. Is it reasonable to assume that if what we do as animals is unnatural, then we are unnatural? Goethe confronted the dilemma when he said,
…“The unnatural – that too is natural.”
North Atlantic Ocean Heat Content Dropping Rapidly

Ole Humlum’s excellent site, Climate4you, has just published the latest Ocean Heat Content data, now up to March 2016. They show some interesting things happening in the North Atlantic.
First, let’s look at the area highlighted below:

Map showing the North Atlantic area within 60-0W and 30-65N, for which the heat content within the uppermost 700 m is shown in the two diagrams below.

Global monthly heat content anomaly (GJ/m2) in the uppermost 700 m of the North Atlantic (60-0W, 30-65N) ocean since January 1955. The thin line indicate monthly values, and the thick line represents the simple running 37 month (c. 3 year) average. Data source: National Oceanographic Data Center (NODC). Last period shown: January-March 2016. Last diagram update 7 June 2016.
We have become familiar with the cold blob, which has developed at the ocean surface in the northern part of the North Atlantic during the last couple of years, but it is evident that it has been getting much colder below the surface as well, down at least to 700 m. Temperatures are now back down to where they were in the early 1990s.
(It is also worth noting that the 1970s marked the coldest period in the record). Unfortunately we don’t have data for the warm 1930s and 40s.
…
OBAMA’S UNDERWATER MANHATTAN DOESN’T COME FROM SCIENCE, BUT FROM SCIENCE FICTION
So Obama decided to warn everyone that Manhattan is about to turn into Atlantis.
“The majority of people believe in things like science — and scientists. And so when scientists tell us that the planet is getting warmer and we need to do something about it, the majority of people think that’s a good idea, let’s do something about that, because we don’t want Manhattan to be underwater.”
Manhattan going underwater isn’t science. It’s science fiction.
It’s the sort of thing you get from watching movies like The Day After Tomorrow where evil Republican politicians neglect the Flying Global Warming Monster and suddenly waves cover Manhattan and everything freezes.
That’s not science. It’s hardly even science fiction.
Here’s what Obama’s science really looks like.
New York City underwater? Gas over $9 a gallon? A carton of milk costs almost $13? Welcome to June 12, 2015. Or at least that was the wildly-inaccurate version of 2015 predicted by ABC News exactly seven years ago. Appearing on Good Morning America in 2008, Bob Woodruff hyped Earth 2100, a special that pushed apocalyptic predictions of the then-futuristic 2015.
The segment included supposedly prophetic videos, such as a teenager declaring, “It’s June 8th, 2015. One carton of milk is $12.99.” (On the actual June 8, 2015, a gallon of milk cost, on average, $3.39.) Another clip featured this prediction for the current year: “Gas reached over $9 a gallon.” (In reality, gas costs an average of $2.75.)
On June 12, 2008, correspondent Bob Woodruff revealed that the program “puts participants in the future and asks them to report back about what it is like to live in this future world. The first stop is the year 2015.”
As one expert warns that in 2015 the sea level will rise quickly, a visual shows New York City being engulfed by water. The video montage includes another unidentified person predicting that “flames cover hundreds of miles.”
That reminds me of uber-eco alarmist Paul Ehrlich
“Most of the people who are going to die in the greatest cataclysm in the history of man have already been born… [By 1975] some experts feel that food shortages will have escalated the present level of world hunger and starvation into famines of unbelievable proportions. Other experts, more optimistic, think the ultimate food-population collision will not occur until the decade of the 1980s.”
Also Manhattan was supposed to be underwater.…