
Up Or Down? Land Surface Study Shows Varying Global Warming Trends
Meteorologist Joe D’Aleo Rips New Alarmist Report: ‘Get ready for more Junk Science from the highly paid Obama psuedo scientists this week’
http://icecap.us/index.php/go/political-climate
Get ready for more Junk Science from the highly paid Obama psuedo scientists this week
The National Climate Assessment, a 1,300-page report compiled by 300 leading laugh out loud here scientists and experts, is meant to be the definitive account of the effects of climate change on the US. It will be formally released at a White House event and is expected to drive the remaining two years of Barack Obama’s environmental agenda.
The findings are expected to guide Obama as he rolls out the next and most ambitious phase of his climate change plan in June – a proposal to cut emissions from the current generation of power plants, America’s largest single source of carbon pollution.
The White House is believed to be organising a number of events over the coming week to give the report greater exposure.
“Climate change, once considered an issue for a distant future, has moved firmly into the present,” a draft version of the report says. The evidence is visible everywhere from the top of the atmosphere to the bottom of the ocean, it goes on.
“Americans are noticing changes all around them. Summers are longer and hotter, and periods of extreme heat last longer than any living American has ever experienced. Winters are generally shorter and warmer. Rain comes in heavier downpours, though in many regions there are longer dry spells in between.”
The final wording was under review by the White House but the basic gist remained unchanged, scientists who worked on the report said.
———–
The real story:
Sitting on the world’s greatest supply of gas and oil, we may face shortages because of green energy policies and flawed science
This past winter, bitterly cold weather placed massive stress on the US electrical system – and the system almost broke down. It was the coldest winter on record in Chicago and many other midwest cities and the cold has continued into the spring.
Eight of the top ten of all-time winter energy demand peaks occurred in January 2014. Heroic efforts by grid operators saved large parts of the nation’s heartland from blackouts during record-cold temperature days. Nicholas Akins, CEO of American Electric Power, stated in Congressional testimony, “This country did not just dodge a bullet – we dodged a cannon ball.”
Environmental policies established by Congress and the Environmental Protection Agency are moving us toward electrical grid failure. This …
Climate change is clear and present danger, says landmark US report – ‘National Climate Assessment, to be launched at White House, says effects of climate change are now being felt’
‘Climate change is the defining issue of our time,’ says UN chief
“Climate change is the defining issue of our time,” says UN chief. http://goo.gl/yySiEi AGREED. Are we stupid enough to believe Al Gore?
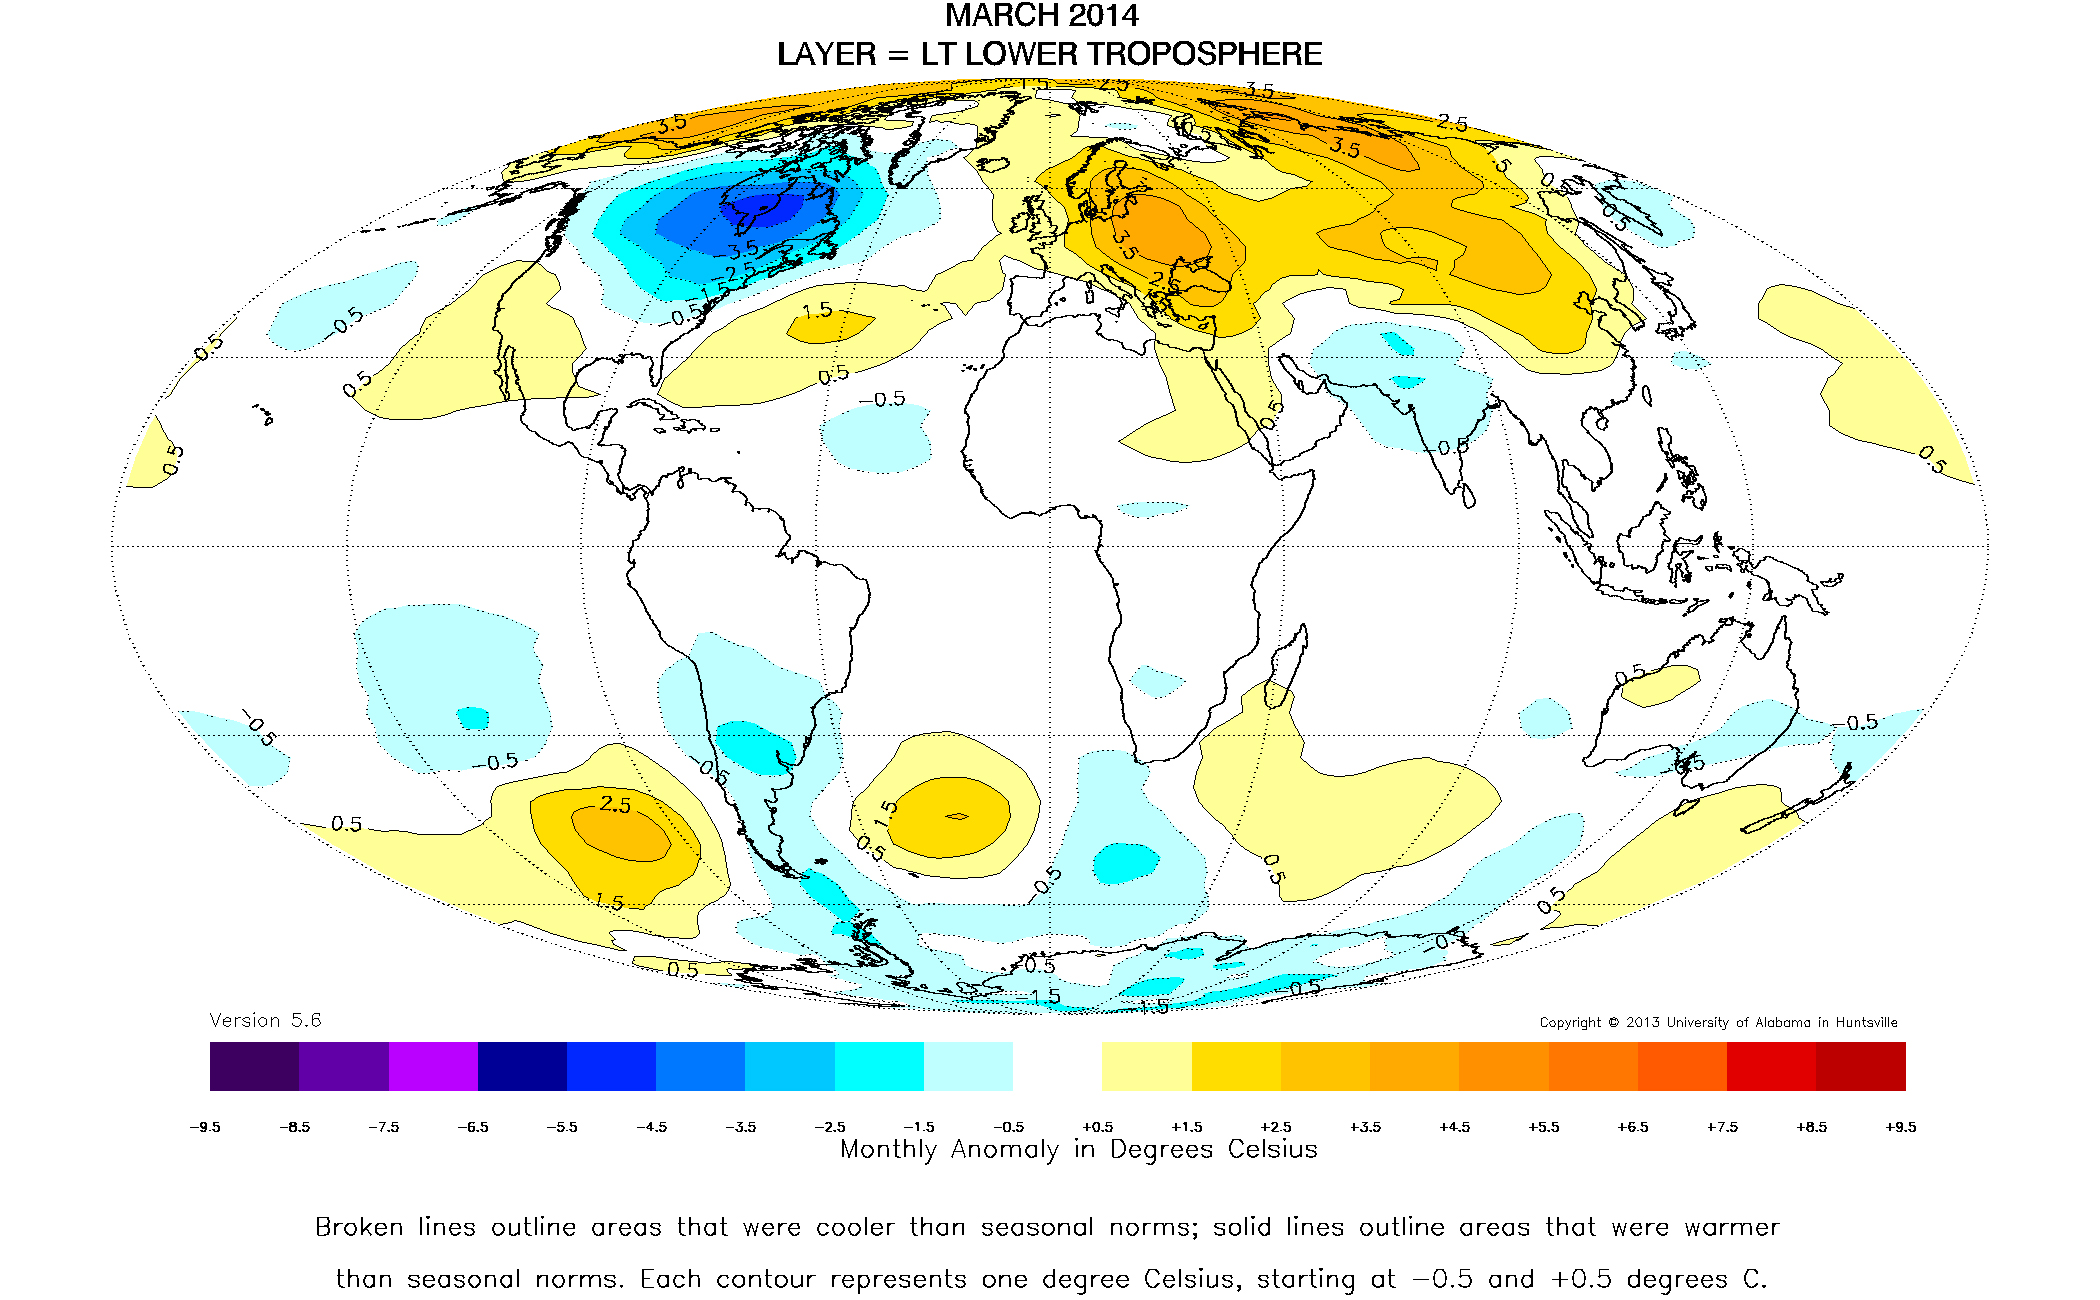
Antarctic Sea Ice Blows Away Records In April – Ice ‘extent in April at the highest since measurements began in 1979’
Antarctic Sea Ice Blows Away Records In April
By Paul Homewood
http://nsidc.org/data/seaice_index/index.html
Antarctic sea ice continues to set new records, with extent in April at the highest since measurements began in 1979.
http://nsidc.org/data/seaice_index/index.html
Ice extent has also been above last year’s already high levels for most of this year.
http://nsidc.org/data/seaice_index/index.html
Meanwhile, both GISS surface and UAH satellite datasets show the Antarctic has been much colder than usual recently.
http://data.giss.nasa.gov/cgi-bin/gistemp/nmaps.cgi?sat=4&sst=3&type=anoms&mean_gen=03&year1=2014&year2=2014&base1=1981&base2=2010&radius=1200&pol=rob
http://nsstc.uah.edu/climate/2014/march/MARCH-2014.jpg
Finally, global sea ice area remains well above average.
http://arctic.atmos.uiuc.edu/cryosphere/IMAGES/global.daily.ice.area.withtrend.jpg
Sent by gReader Pro…
‘Backed by millions of dollars from the federal government’, scientists race to develop farm animals to survive climate change
http://www.latimes.com/nation/la-na-climate-chickens-20140504,0,2628316.story…
Calgary a winter wonderland in May
http://www.theprovince.com/news/alberta/Calgary+winter+wonderland/9800702/story.html…
Global Temperature Update: No global warming at all for 17 years 9 months
Special to Climate Depot
By Christopher Monckton of Brenchley,
According to the RSS satellite data, whose value for April 2014 is just in, the global warming trend in the 17 years 9 months since August 1996 is zero. The 212 months without global warming represents more than half the 423-month satellite data record, which began in January 1979. No one now in high school has lived through global warming.
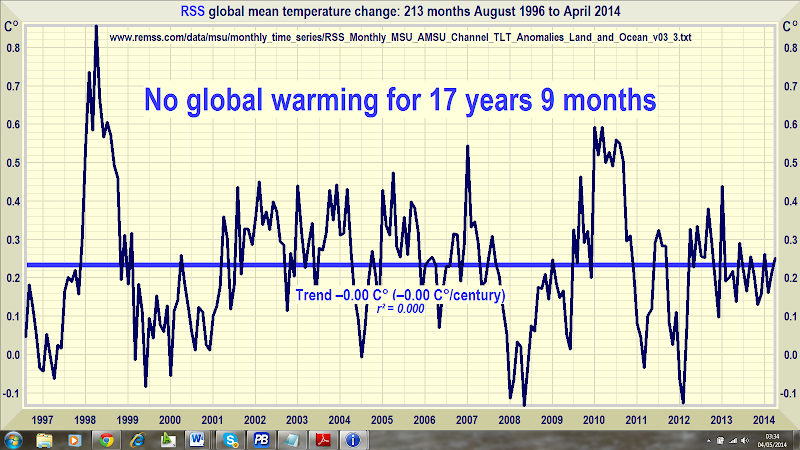
The long Pause may well come to an end by this winter, when an el Niño event is expected in the equatorial eastern Pacific, causing global temperature to rise quite sharply. The el Niños of 1998, 2007, and 2010 are visible in the graph. El Niños occur about every three or four years, though no one is entirely sure what triggers them. They cause a temporary spike in temperature, often followed by a sharp drop during the la Niña phase, as can be seen in 1999, 2008, and 2011-2012, where there was a “double-dip” la Niña.
The ratio of el Niños to la Niñas tends to fall during the 30-year negative or cooling phases of the Pacific Decadal Oscillation, the latest of which began in late 2001. So, though the Pause may pause for a few months at the turn of the year, it may well resume late in 2015.
Either way, it is ever clearer that global warming has not been happening at anything like the rate predicted by the climate models, and is not at all likely to occur even at the much-reduced rate now predicted. There could be as little as 1 Cº global warming this century, not the 3-4 Cº predicted by the IPCC.
Key facts about global temperature:
- The RSS satellite dataset shows no global warming at all for 213 months from August 1996 to April 2014. That is more than half the entire 423-month satellite record.
- The fastest centennial warming rate was in Central England from 1663-1762, at 0.9 Cº per century – before the industrial revolution began. It cannot have been our fault.
- The global warming trend since 1900 is equivalent to 0.8 Cº per century. This is well within natural variability and may not have much to do with us.
- The fastest warming trend lasting ten years or more occurred over the 40 years from 1694-1733 in Central England. It was equivalent to 4.3 Cº per century.
- Since 1950, when a human